“Demystifying the world of Classical Charting”
– AKSEL KIBAR
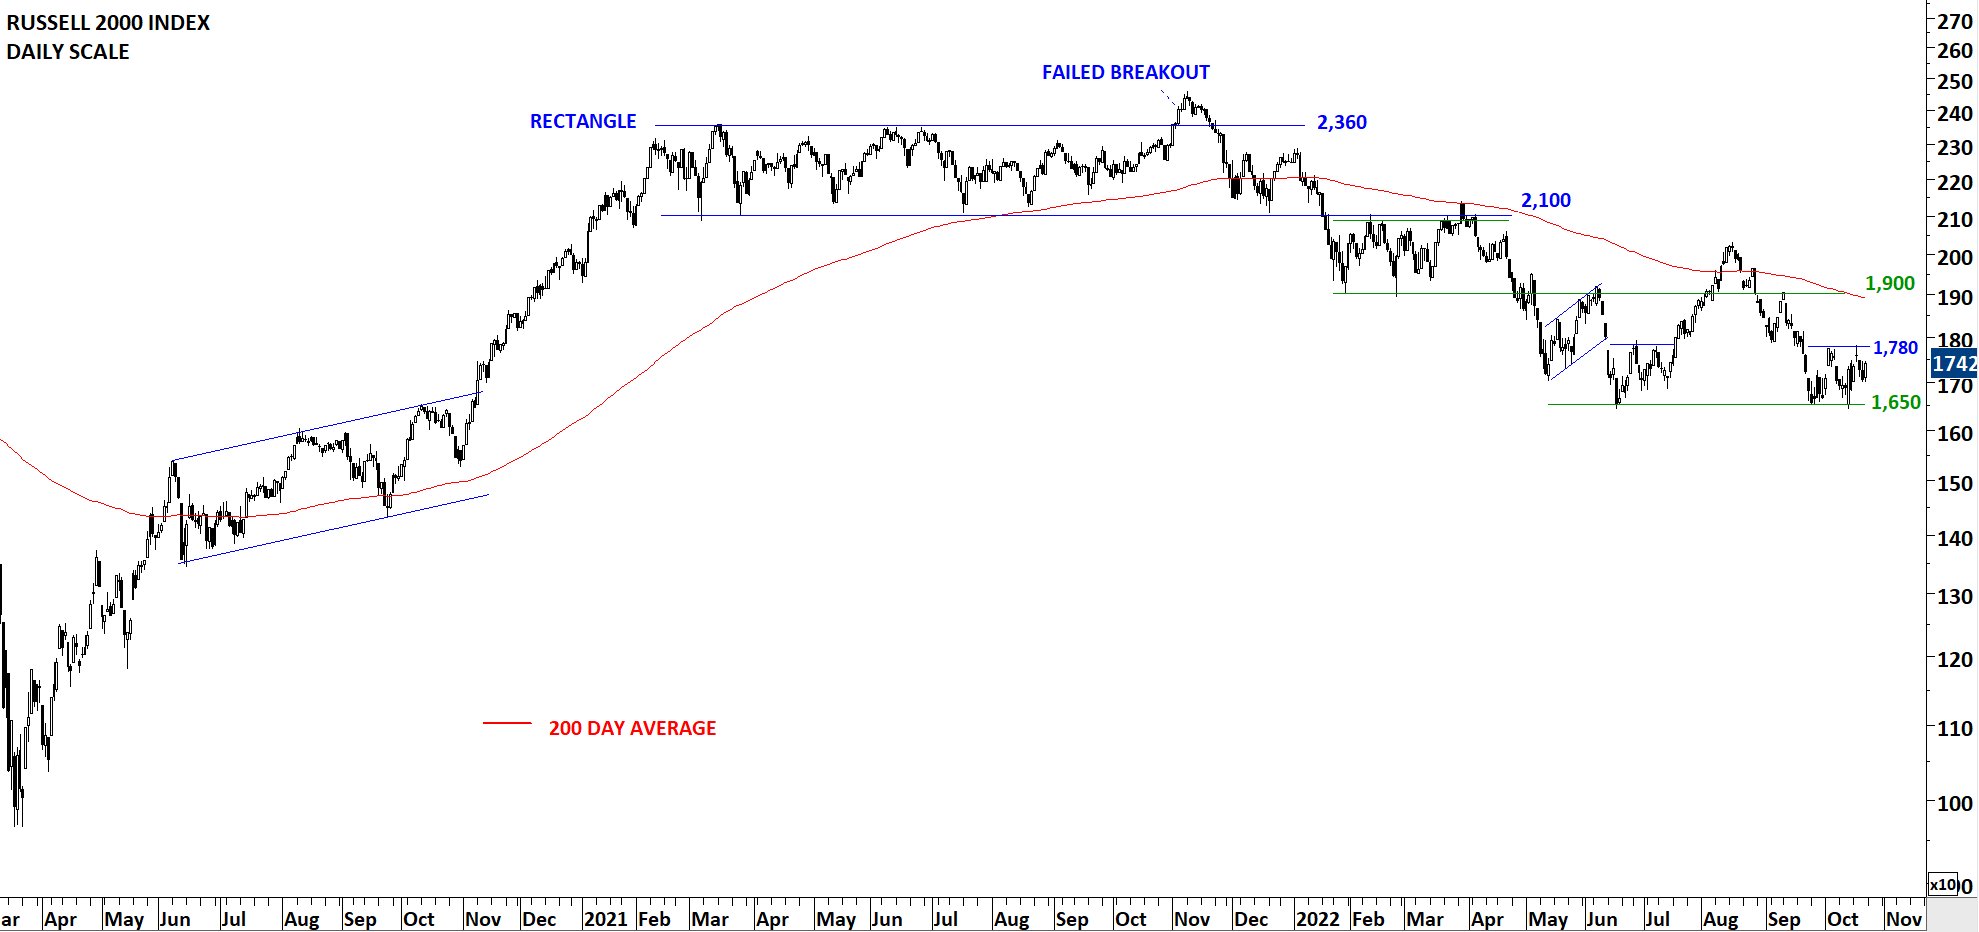
Every week Tech Charts Global Equity Markets report features some of the well-defined, mature classical chart patterns under a lengthy watchlist and the chart pattern breakout signals that took place during that week. Global Equity Markets report covers single stocks from developed, emerging and frontier markets, ETF’s, select commodities, cryptocurrencies and global equity indices. Below chart is from the review section of the weekly report. It is featuring a trading opportunity on the price chart of Russell 2000 Index.
Russell 2000 Index, a measure of small cap performance, found support at the June 2022 lows; 1,650 levels. Until there is a breakdown below the support, I see a trading range between 1,650 and 1,900 levels. Breakdown can resume the downtrend. This week’s price action managed to hold above the June lows. Breakout above 1,780 levels can result in a short-term bullish reversal with the price target of 1,900 levels. I favor Russell 2000 Index for a short-term long position when compared with other U.S. equity benchmarks.

By becoming a Premium Member, you’ll be able to improve your knowledge of the principles of classical charting.
With this knowledge, you can merge them with your investing system. In fact, some investors use my analyses to modify their existing style to invest more efficiently and successfully.
You will receive:
For your convenience your membership auto renews each year.

Dear Tech Charts Blog followers,
Over the past few weeks I started putting out those interactive charts and videos that met great interest from classical charting enthusiasts. I’ve been thinking of ways to improve your learning experience. I realized that many who are interested in charts and technical analysis want feedback on their input and also test their knowledge. Interactive content is the best way to do this. It is almost like one on one lecture/tutoring.
I will continue to add more interactive content and possibly make this an ongoing educational platform for our members.
Here is a recap of the last 3 public posts/videos I created for our followers.
SYMMETRICAL, ASCENDING & DESCENDING TRIANGLES
CANDLESTICK PATTERNS AT SUPPORT & RESISTANCE
By becoming a Premium Member, you’ll be able to improve your knowledge of the principles of classical charting.
With this knowledge, you can merge them with your investing system. In fact, some investors use my analyses to modify their existing style to invest more efficiently and successfully.
You will receive:
For your convenience your membership auto renews each year.
There are three types of triangles covered under the classical charting principles. The symmetrical triangle, ascending triangle and descending triangle. Between those three I favor ascending and descending triangles for couple of reasons. One of them is, both ascending and descending triangles have horizontal boundaries. Breakouts through the horizontal boundaries are the chart pattern signal. The other reason is that, both ascending and descending triangles have directional bias due to their upward and downward sloping lower and upper boundaries. I find symmetrical triangles difficult to trade as price usually finds resistance at the minor highs following the breakout. Pause around minor resistance usually hampers the momentum and can result in more frequent failures.
Let’s analyze the 3 different types of triangles with below interactive charts.
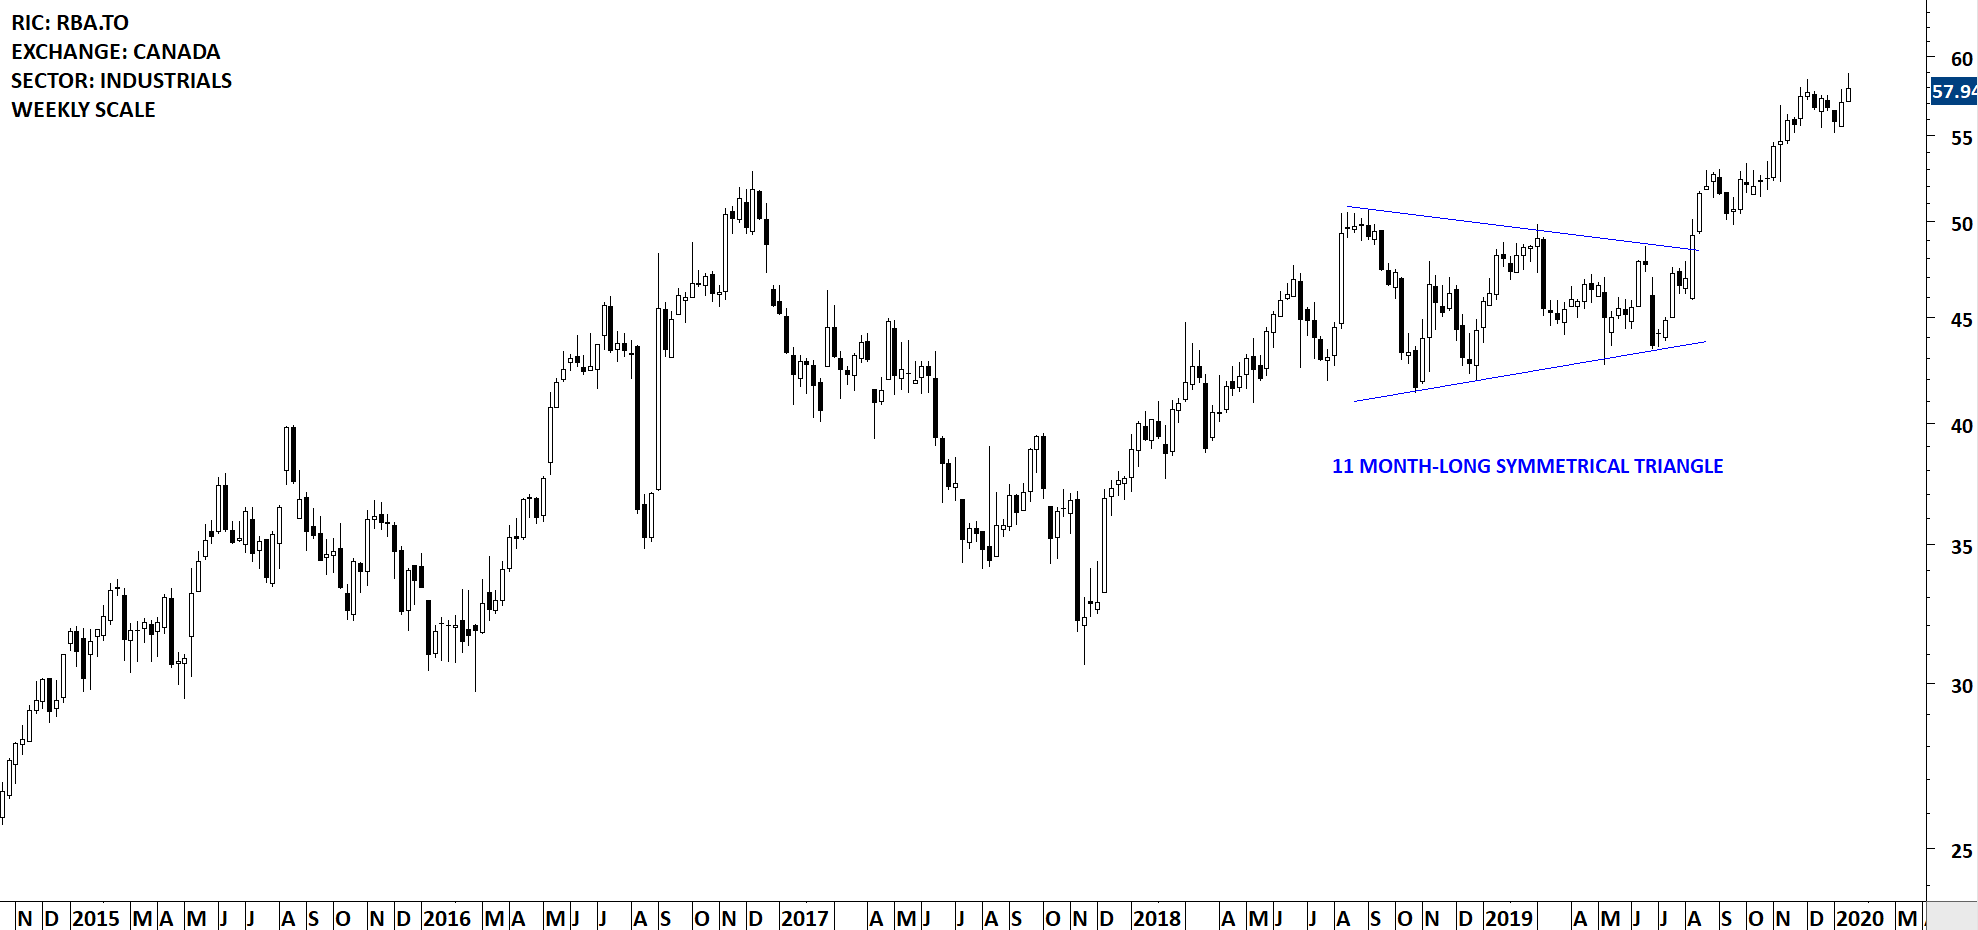
Symmetrical triangle has both boundaries converging towards an apex. It is a neutral chart pattern and doesn’t have a directional bias.
I follow the below template to review weekly scale price charts. The template loads 5 years of data (+/- 250 candles) on the weekly scale price chart. I like to view price action without any indicators and also on white background.
This is how I would draw the boundaries of a symmetrical triangle. I pay attention to several tests of pattern boundary before a breakout takes place. Minimum 3 touches of a chart pattern boundary gives me the confidence that the chart pattern boundary is well-defined and a breakout can trigger a directional movement.
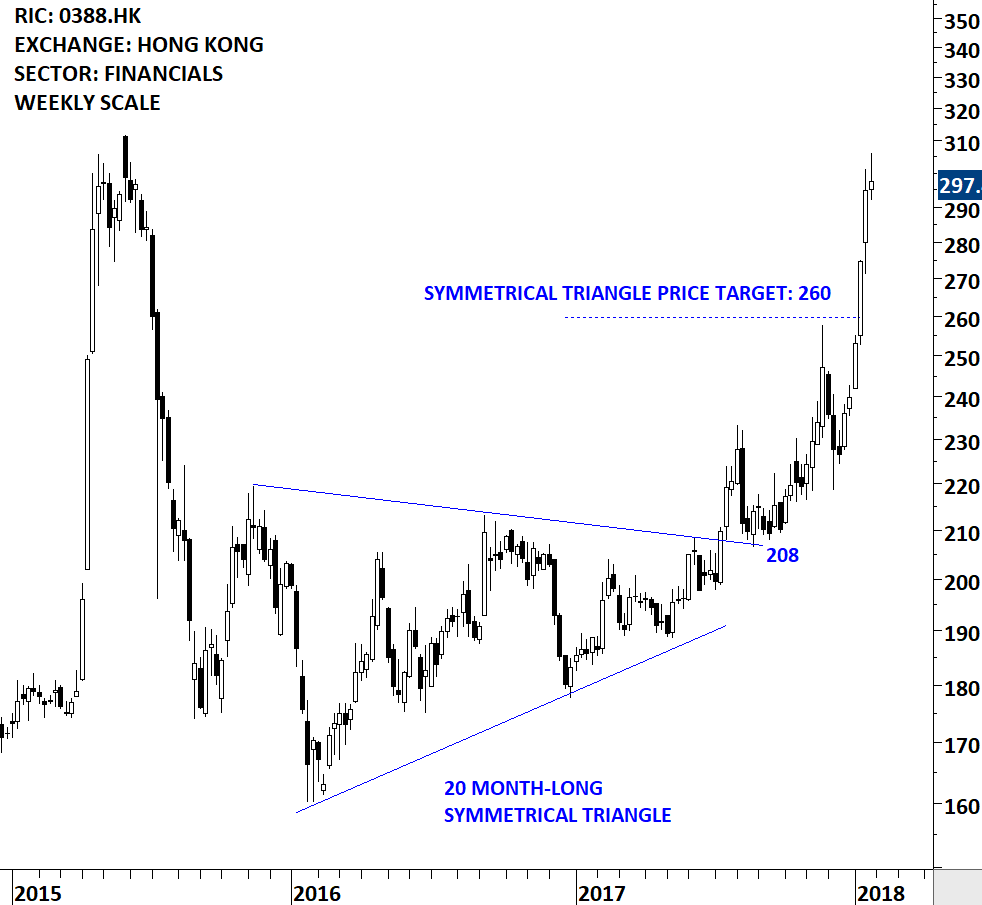
This was a symmetrical triangle reversal that was alerted to Tech Charts members as a symmetrical triangle bottom reversal. Note the 3 touches of the upper boundary and also the sharp pullback that followed the breakout. Minor high acted as resistance and resulted in several weeks of hesitation around the pattern boundary.
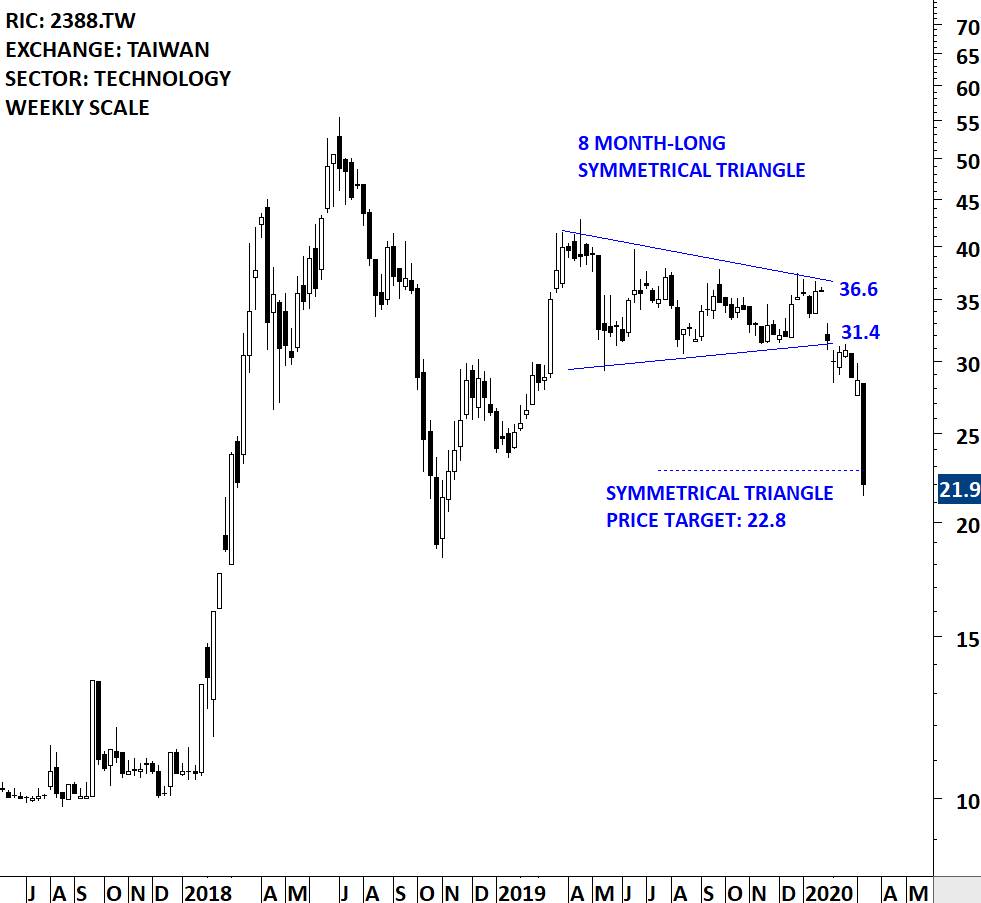
This was a symmetrical triangle that acted as a top reversal. You can see the several tests of the lower boundary before the breakdown took place. Note the re-test of the pattern boundary and where the rebound started from; the minor low.
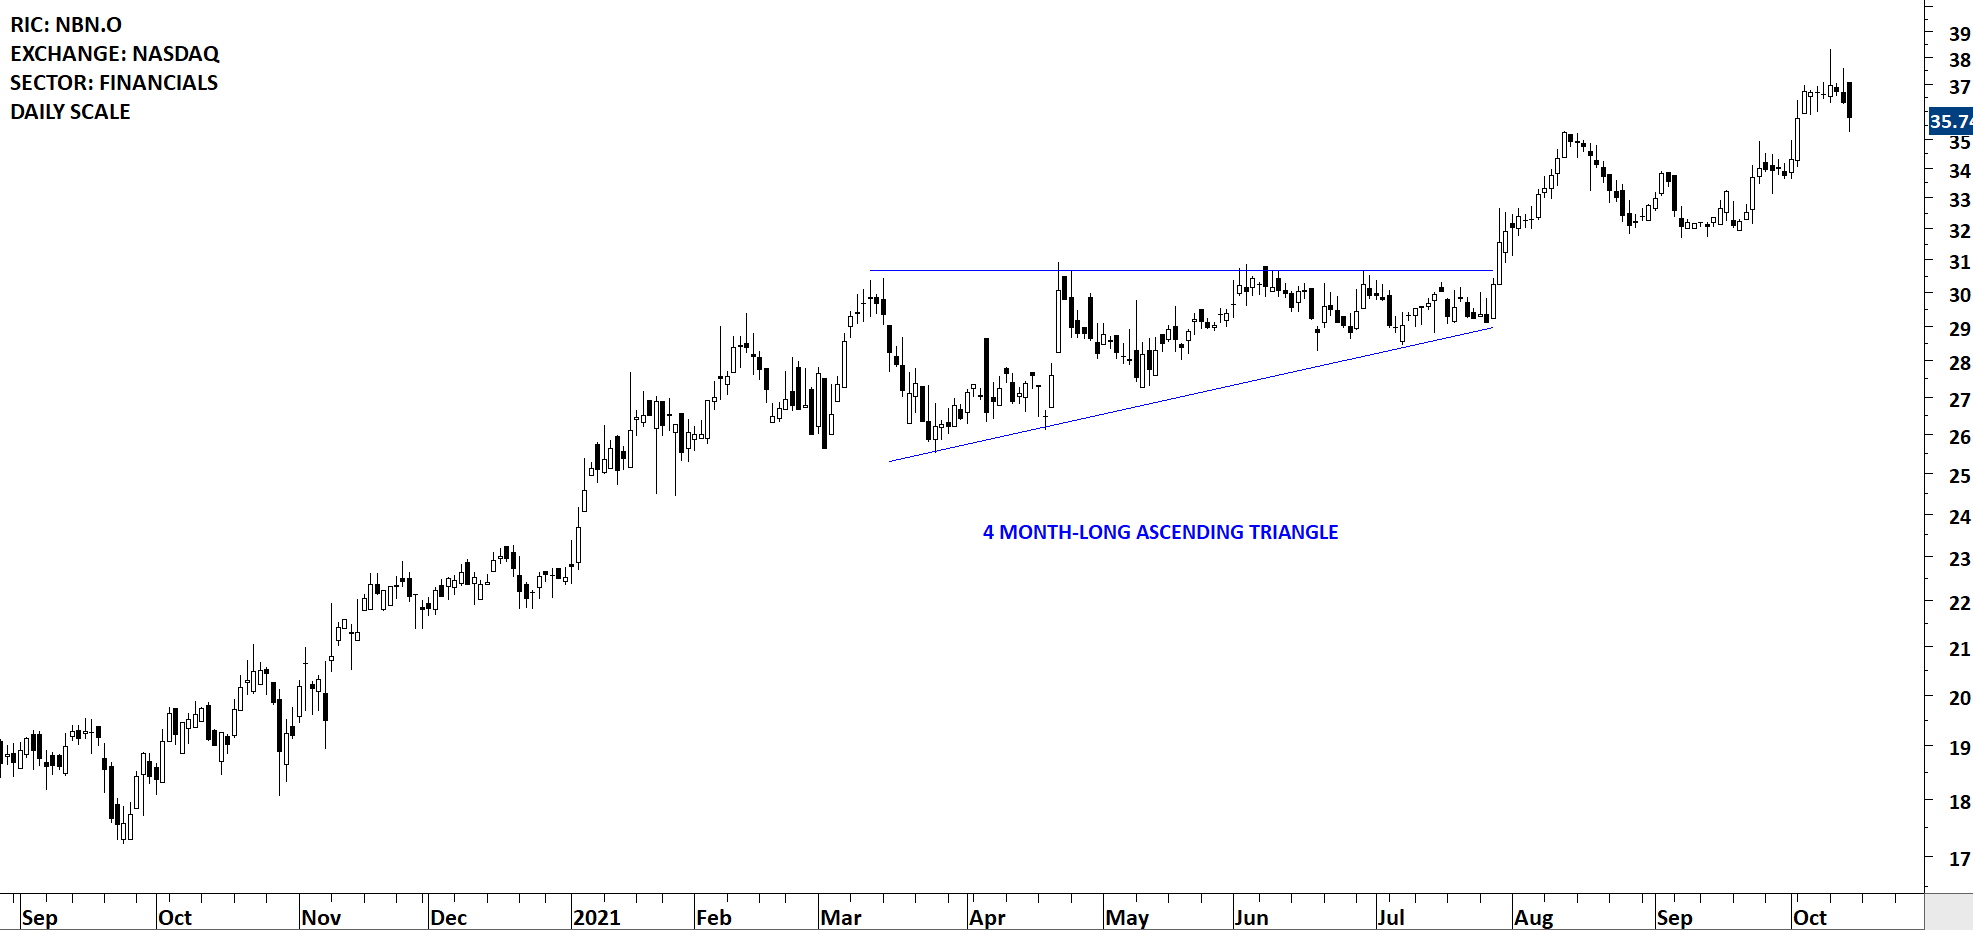
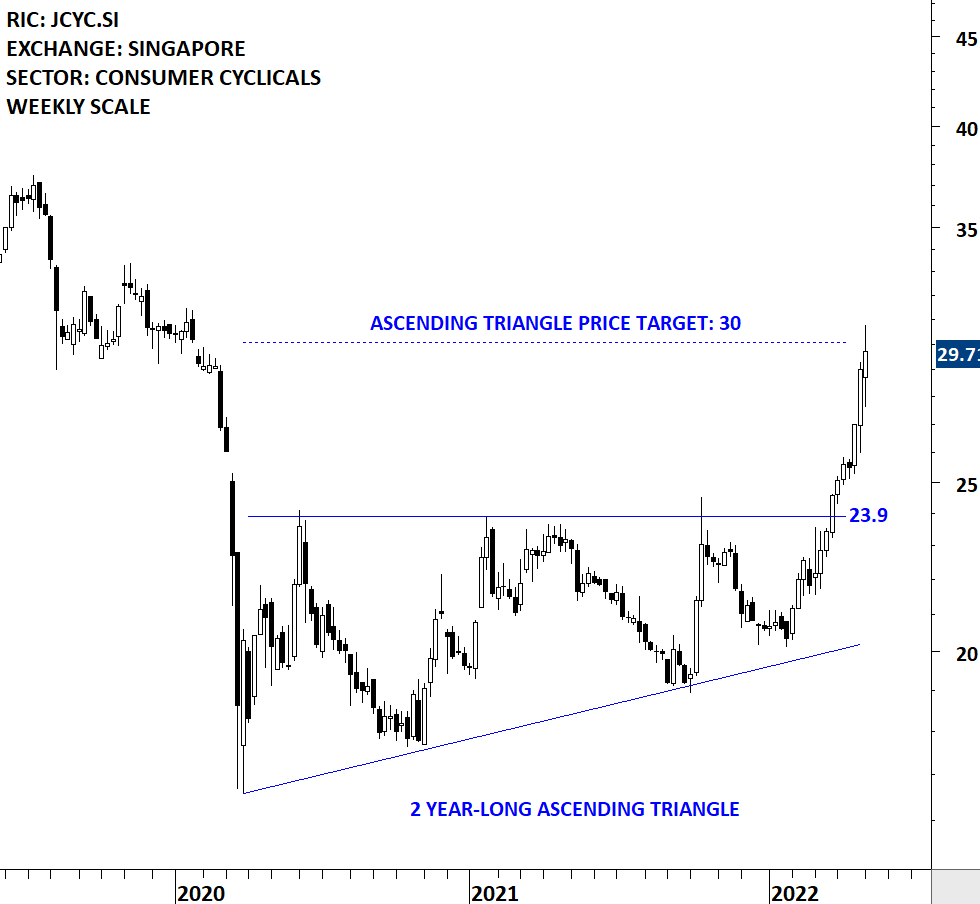
Ascending triangle is a bullish chart pattern. Its upward sloping lower boundary gives the pattern the bullish bias. Buyers are more impatient at every correction, bidding the price at a higher level while sellers defend the same horizontal resistance. Over time the pattern shows the battle between buyers and sellers shifting in favor of buyers. The pattern is completed with a breakout through the horizontal boundary.
I follow the below template to review daily scale price charts. The template loads 1 year of data (+/- 250 candles) on the daily scale price chart. I like to view price action without any indicators and also on white background.
This is how I would draw the boundaries of the ascending triangle. Please note the several tests of the upper boundary before the breakout takes place.
As a bottom reversal, the formation of the ascending triangle can spread over several months. Qualities I look for don’t change. I continue to look for a breakout through the horizontal boundary and also the several tests of the horizontal boundary before the breakout.
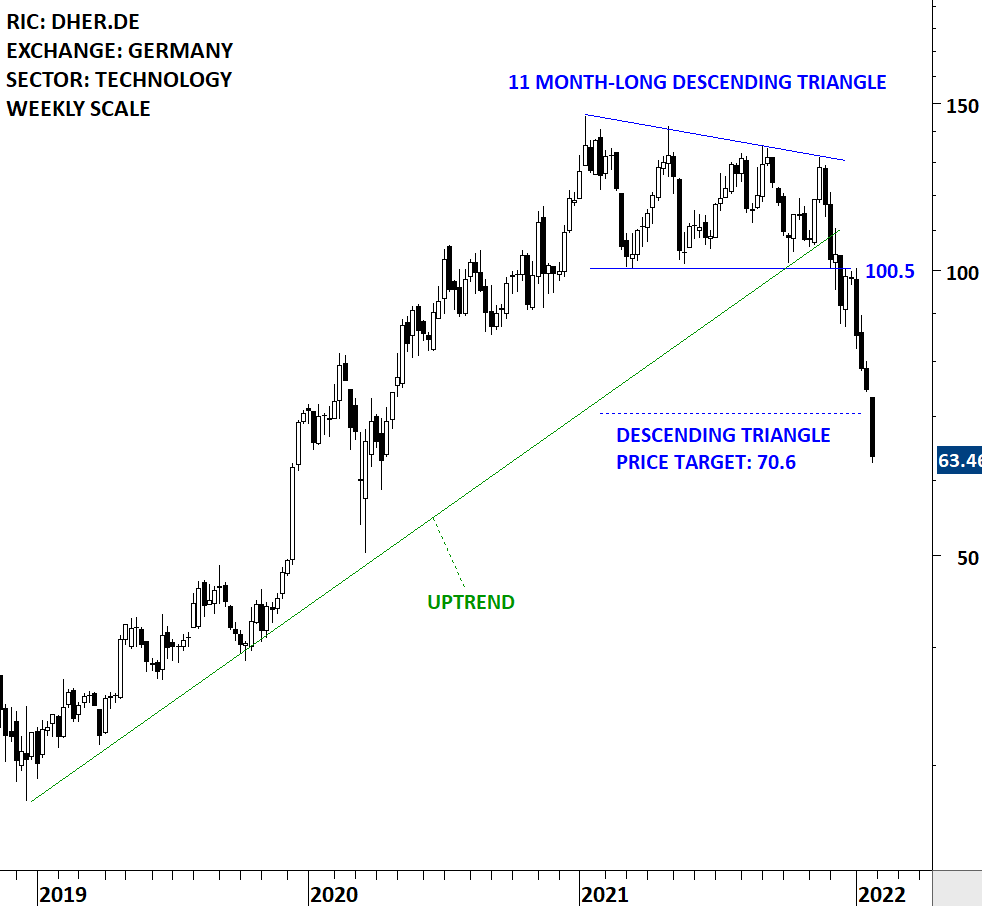
Descending triangle is a bearish chart pattern. Its downward sloping upper boundary gives the pattern the bearish bias. Sellers are more impatient at every recovery, pushing the price to a lower level while buyers defend the same horizontal support. Over time the pattern shows the battle between buyers and sellers shifting in favor of sellers. The pattern is completed with a breakdown through the horizontal boundary.
This is how I would draw the descending triangle on the weekly scale price chart of YELP.K. Breakdown took place after the 3 test of the lower boundary.
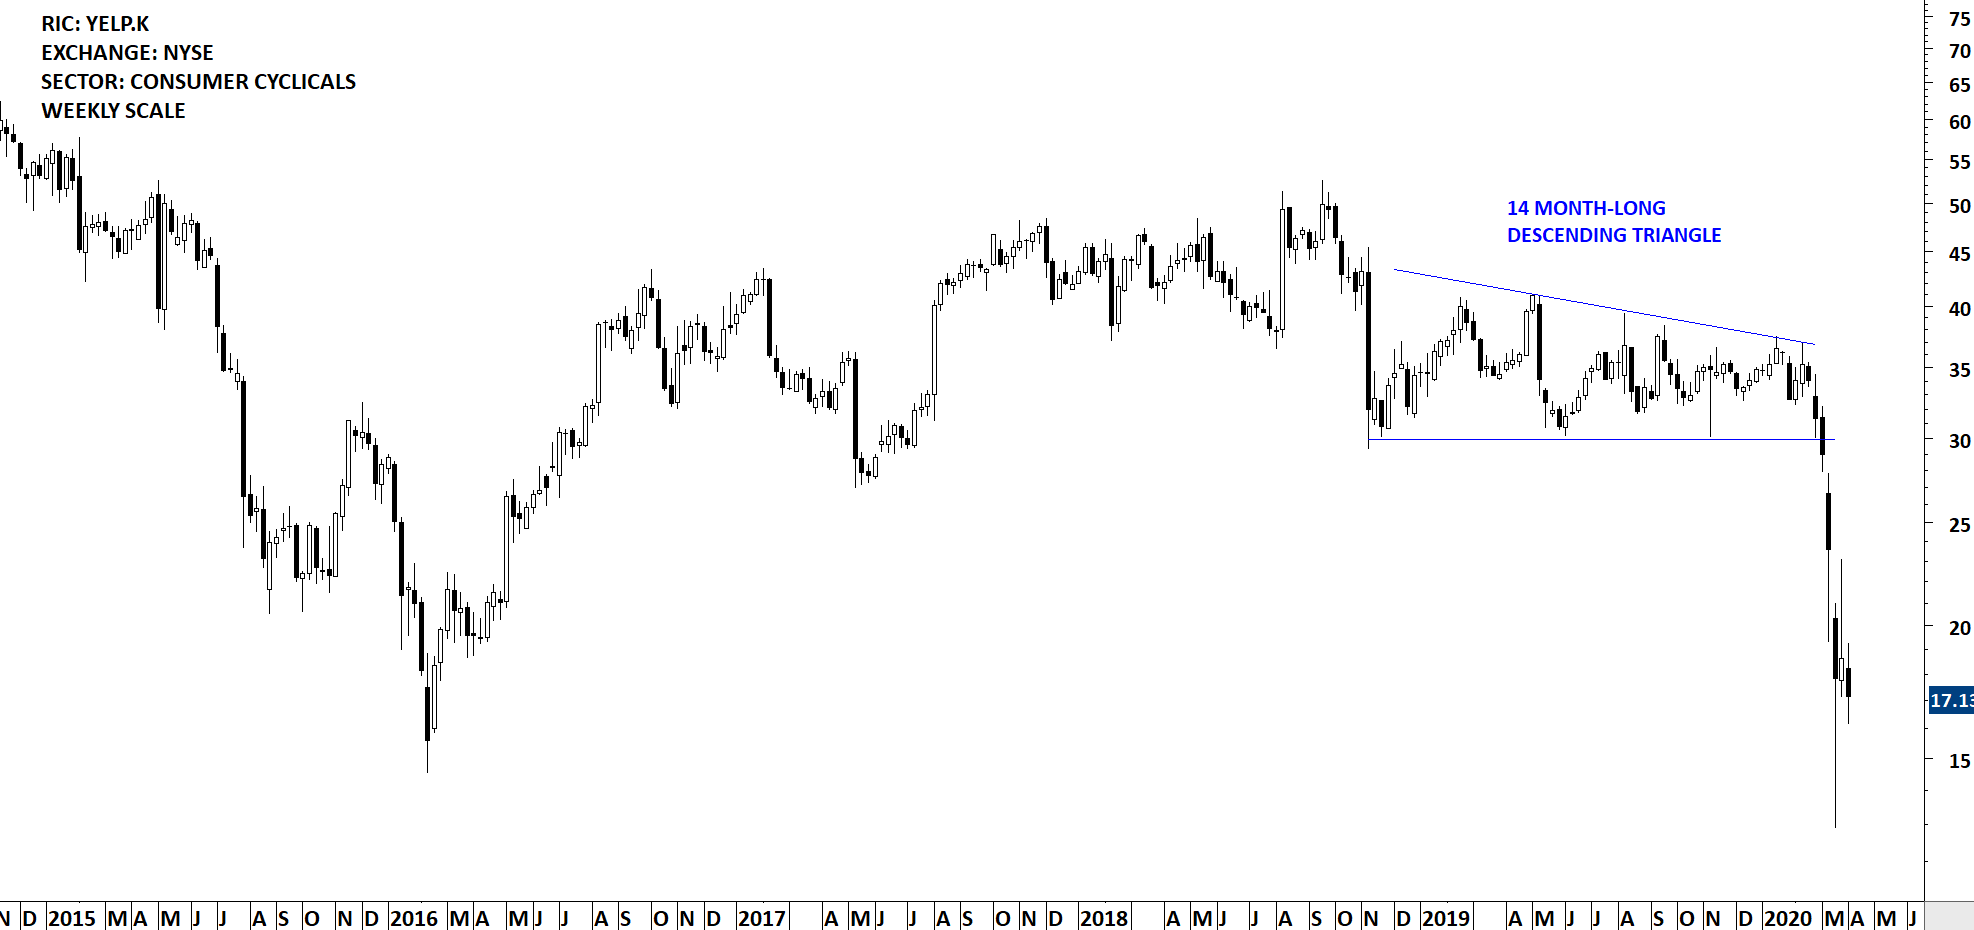
Given its bearish nature, descending triangle can form as a top reversal and the completion of it would forecast lower prices. High conviction setups are as always those with several tests of the horizontal boundary before a breakdown signal.
By becoming a Premium Member, you’ll be able to improve your knowledge of the principles of classical charting.
With this knowledge, you can merge them with your investing system. In fact, some investors use my analyses to modify their existing style to invest more efficiently and successfully.
You will receive:
For your convenience your membership auto renews each year.

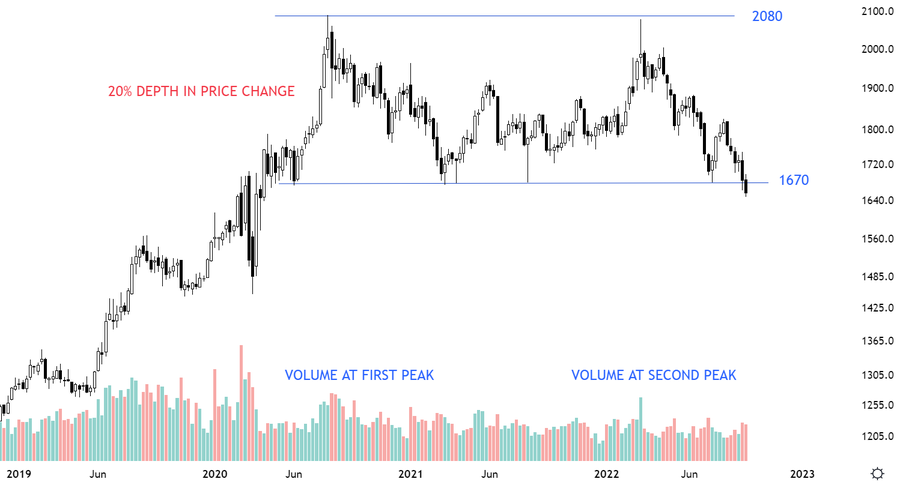
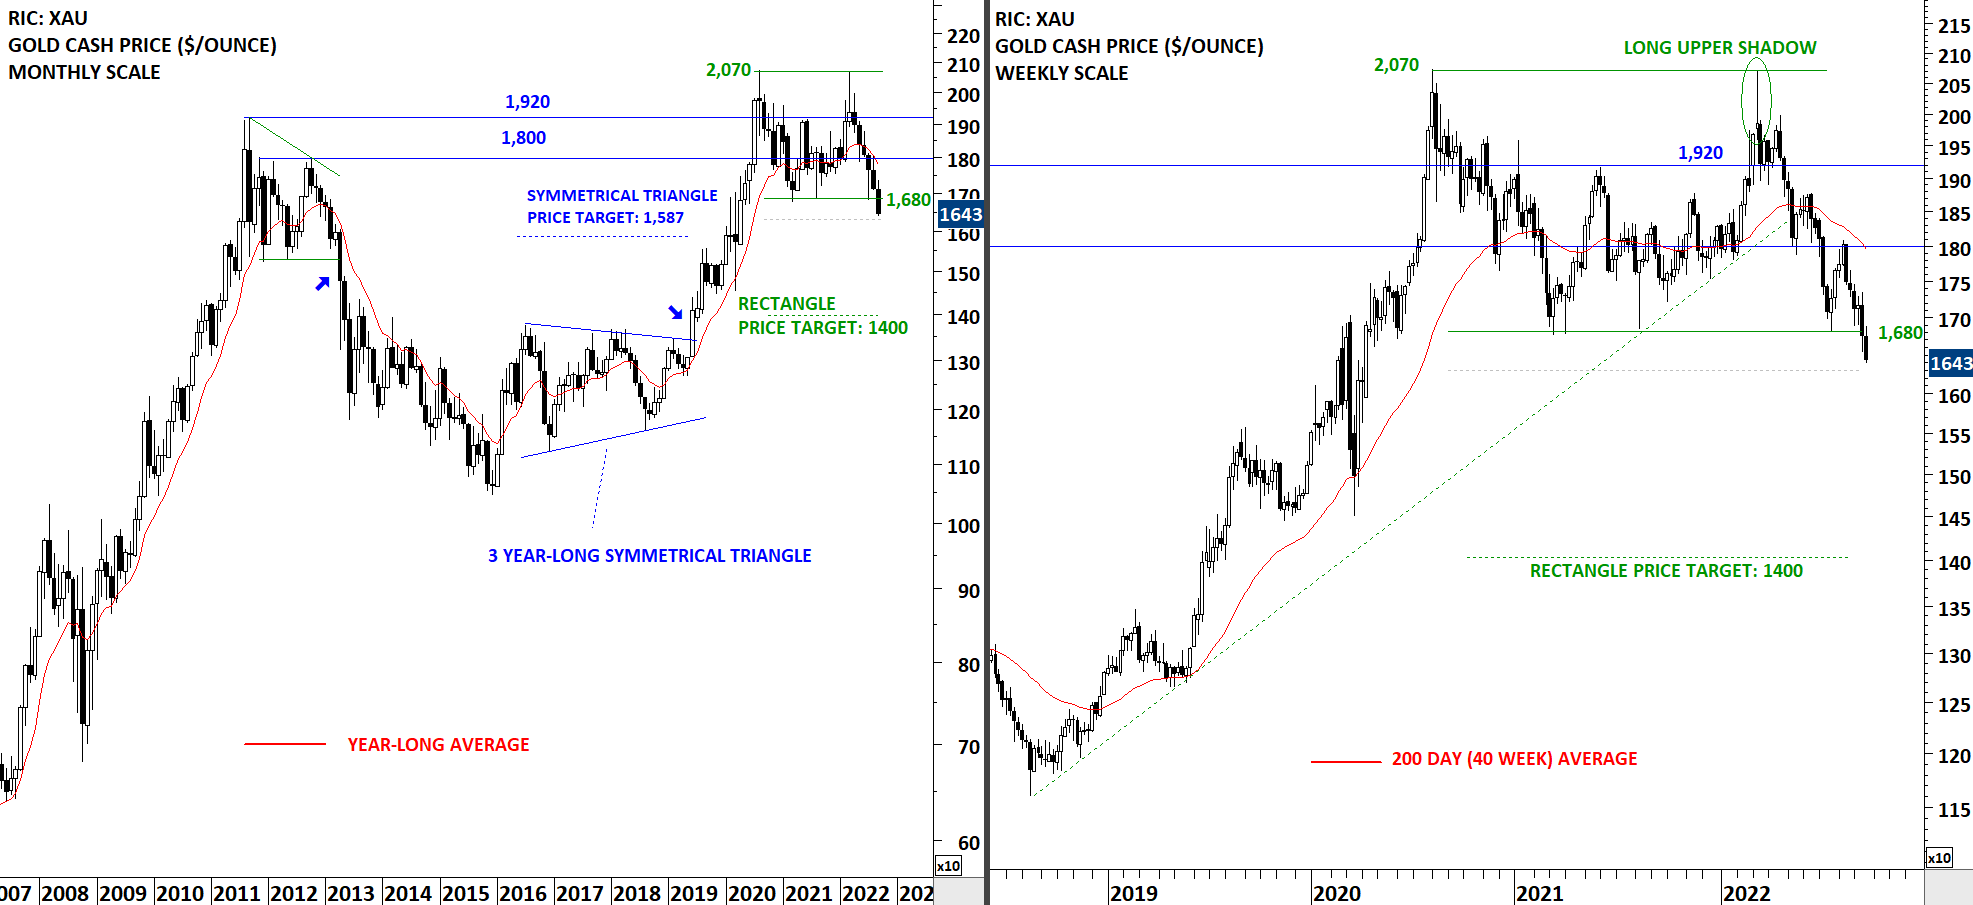
Every week Tech Charts Global Equity Markets report features some of the well-defined, mature classical chart patterns under a lengthy watchlist and the chart pattern breakout signals that took place during that week. Global Equity Markets report covers single stocks from developed, emerging and frontier markets, ETF’s, select commodities, cryptocurrencies and global equity indices. Below chart is from the review section of the weekly report. It is featuring a possible double top reversal on the weekly & monthly scale price charts of GOLD.
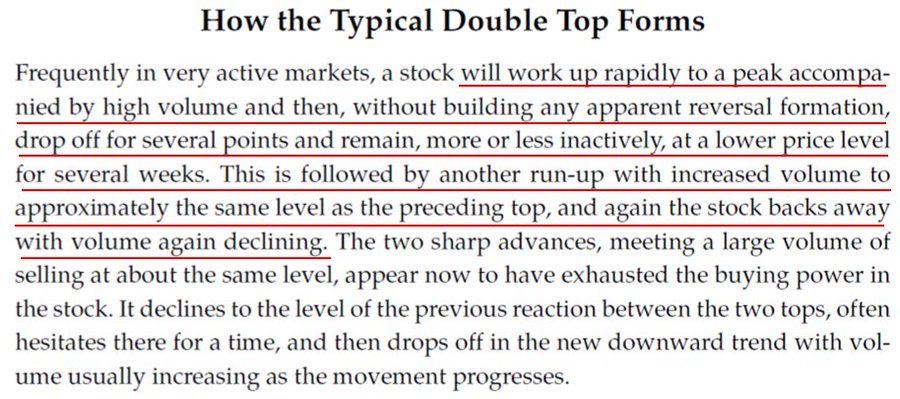
I have been categorizing Double Top and Double Bottom as rectangle. This is to reduce the confusion on terminology. Today I look at the Double Top description of Richard W. Schabacker in his book Technical Analysis and Stock Market Profits.
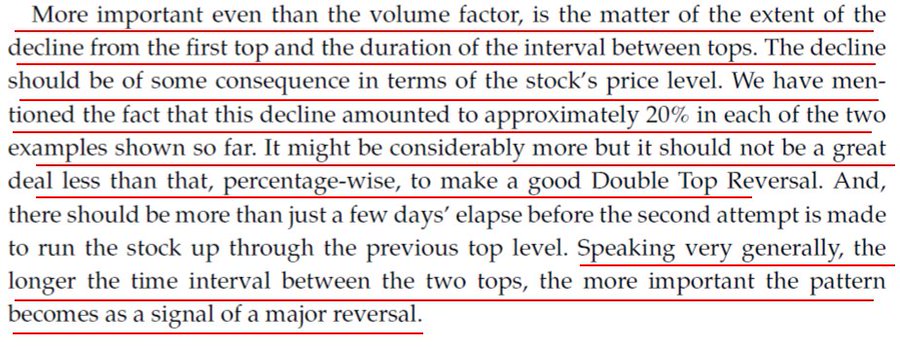
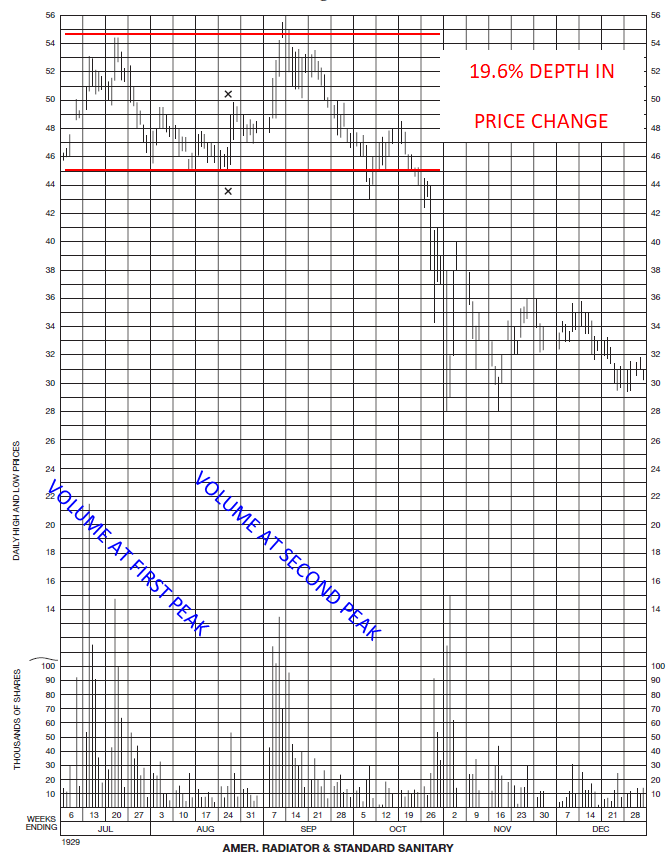
According to Schabacker a Double Top should have these qualities for correct labelling:
Gold might be completing a rectangle/double top on the monthly scale price charts. Daily close below 1,630 levels will confirm the breakdown and suggest lower levels in the coming months. Low volatility condition on monthly scale price chart is similar to 2013 and 2019 consolidations. Each one of those was followed by strong directional movement. If the pattern completes on the downside with a long monthly candle, I will expect the directional move continue towards 1,400 levels. 1,680 levels becomes the new resistance. A sharp reversal above 1,680 levels can change the negative outlook to neutral.
By becoming a Premium Member, you’ll be able to improve your knowledge of the principles of classical charting.
With this knowledge, you can merge them with your investing system. In fact, some investors use my analyses to modify their existing style to invest more efficiently and successfully.
You will receive:
For your convenience your membership auto renews each year.
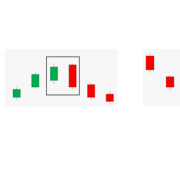
Are you familiar with those candlestick patterns? Candlestick patterns at well-defined support & resistance areas can offer great insight and can become part of a successful trading strategy. Formation of those reversal candlesticks can offer good levels to measure risk/reward and act on a possible swing trade opportunity.
I continue to add new features to Tech Charts membership service. This latest educational video has interactive components where you can pause, answer questions and make sure that the learning experience becomes memorable and fun.
I hope you enjoy it.
By becoming a Premium Member, you’ll be able to improve your knowledge of the principles of classical charting.
With this knowledge, you can merge them with your investing system. In fact, some investors use my analyses to modify their existing style to invest more efficiently and successfully.
You will receive:
For your convenience your membership auto renews each year.
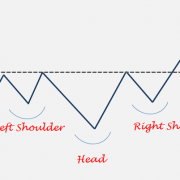
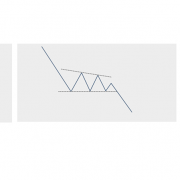
One of the common discussions start with the validity of such pattern... There is a common misconception regarding the continuation type H&S pattern.
Yes, it exists and it is a reliable chart pattern.
Let's dive into this frequently identified chart pattern...
Read More
Every week Tech Charts Global Equity Markets report features some of the well-defined, mature classical chart patterns under a lengthy watchlist and the chart pattern breakout signals that took place during that week. Global Equity Markets report covers single stocks from developed, emerging and frontier markets, ETF’s, select commodities, cryptocurrencies and global equity indices. Below chart is from the watchlist section of the weekly report. It is featuring a H&S bottom reversal chart pattern on Aon PLC listed on the New York Stock Exchange.
Aon PLC is a global professional services company. The Company provides advice and solutions to clients focused on risk, retirement and health, delivering distinctive client value via risk management and workforce productivity solutions. The stock is listed on the New York Stock Exchange. Price chart formed a 3 month-long head and shoulder bottom with the horizontal boundary acting as strong resistance at 281.00 levels. The horizontal boundary was tested several times over the course of the chart pattern. A daily close above 286.60 levels will confirm the breakout from the 3 month-long head and shoulder bottom with the possible chart pattern price target of 313.00 levels.
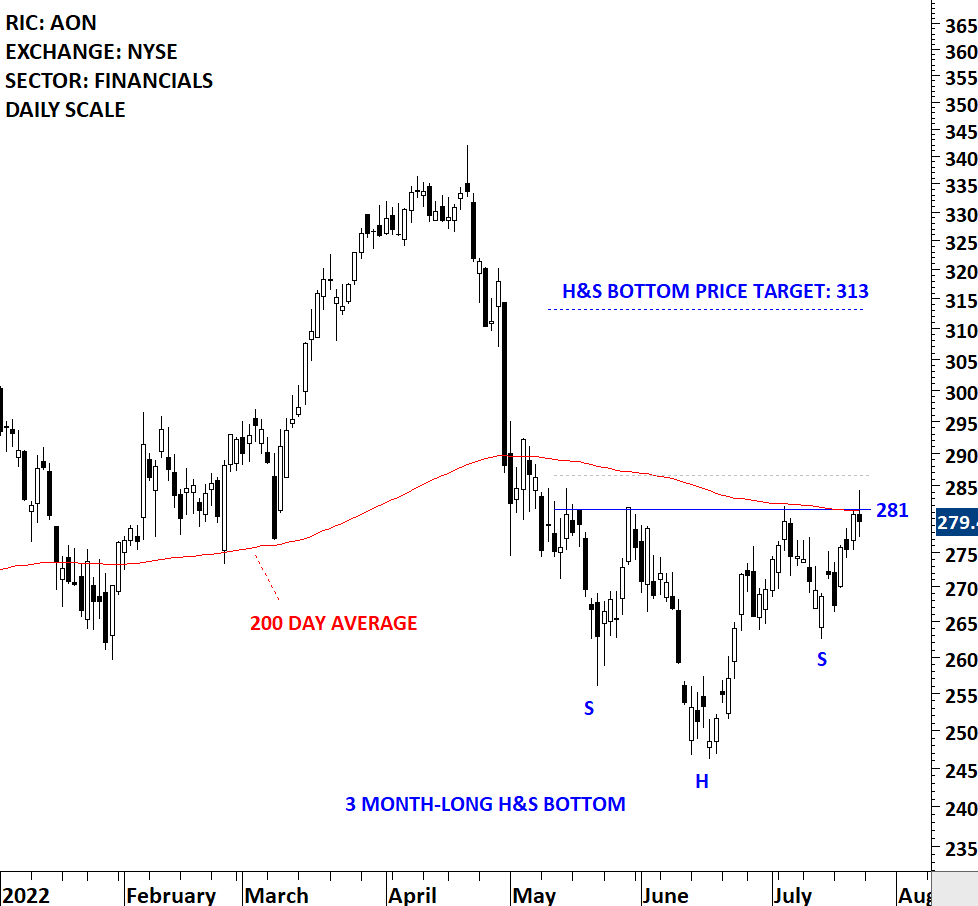
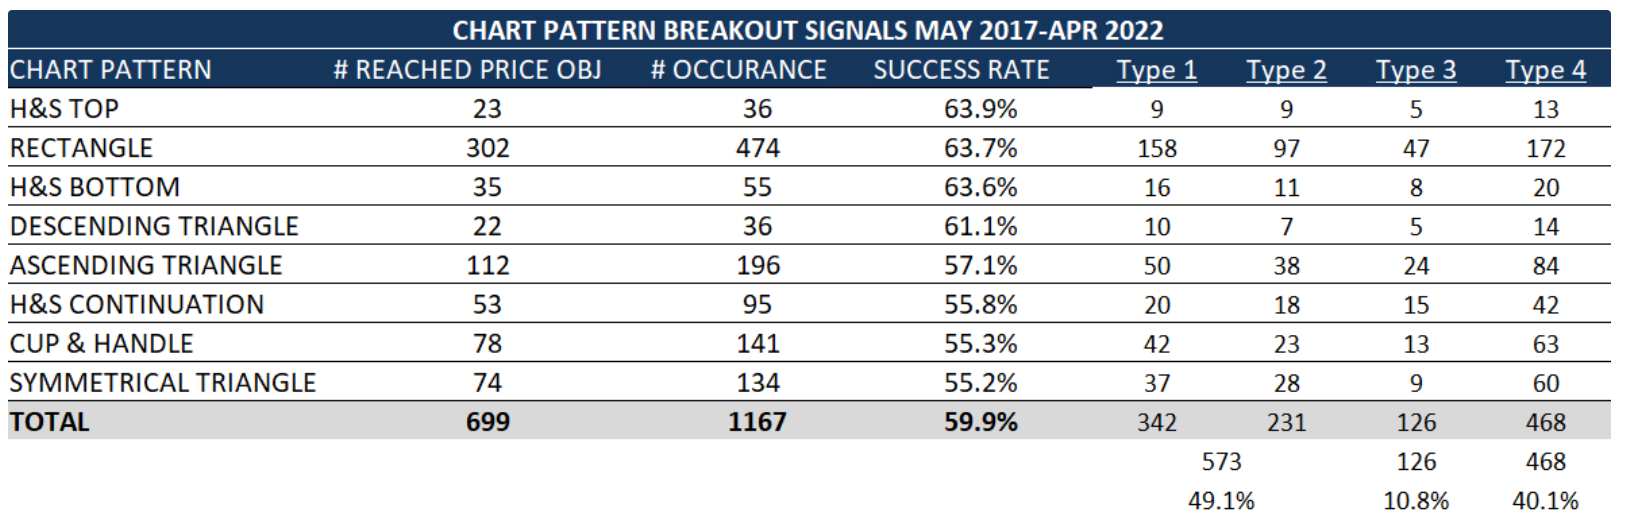
H&S top and bottom reversals have been reliable chart patterns over the past 5 years. While there hasn’t been many H&S reversals (as they only form at market turning points) those that have completed had good success rates. I’m monitoring the H&S bottom reversal on AON PLC closely as breakout can also clear the 200-day average at the same time as the neckline. Those are usually high conviction setups as they signal not only a reversal but a change in trend.
By becoming a Premium Member, you’ll be able to improve your knowledge of the principles of classical charting.
With this knowledge, you can merge them with your investing system. In fact, some investors use my analyses to modify their existing style to invest more efficiently and successfully.
You will receive:
For your convenience your membership auto renews each year.

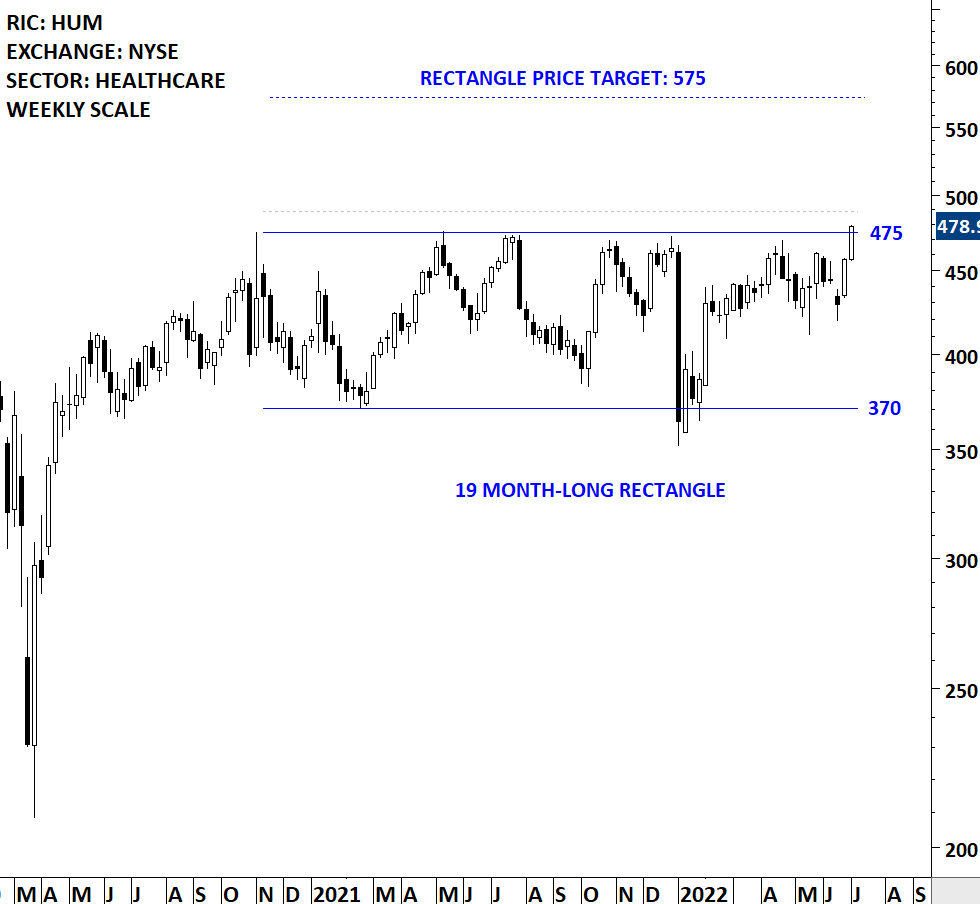
Every week Tech Charts Global Equity Markets report features some of the well-defined, mature classical chart patterns under a lengthy watchlist and the chart pattern breakout signals that took place during that week. Global Equity Markets report covers single stocks from developed, emerging and frontier markets, ETF’s, select commodities, cryptocurrencies and global equity indices. Below chart is from the watchlist section of the weekly report. It is featuring a rectangle chart pattern on Humana Inc. listed on the New York Stock Exchange.
Humana Inc. is a health and well-being company. The Company operates through three reportable segments: Retail, Group and Specialty, and Healthcare Services. The stock is listed on the New York Stock Exchange. Price chart formed a 19 month-long rectangle with the horizontal boundary acting as strong resistance at 475.00 levels. The horizontal boundary was tested several times over the course of the chart pattern. A daily close above 489.00 levels will confirm the breakout from the 19 month-long rectangle with the possible chart pattern price target of 575.00 levels.
By becoming a Premium Member, you’ll be able to improve your knowledge of the principles of classical charting.
With this knowledge, you can merge them with your investing system. In fact, some investors use my analyses to modify their existing style to invest more efficiently and successfully.
You will receive:
For your convenience your membership auto renews each year.

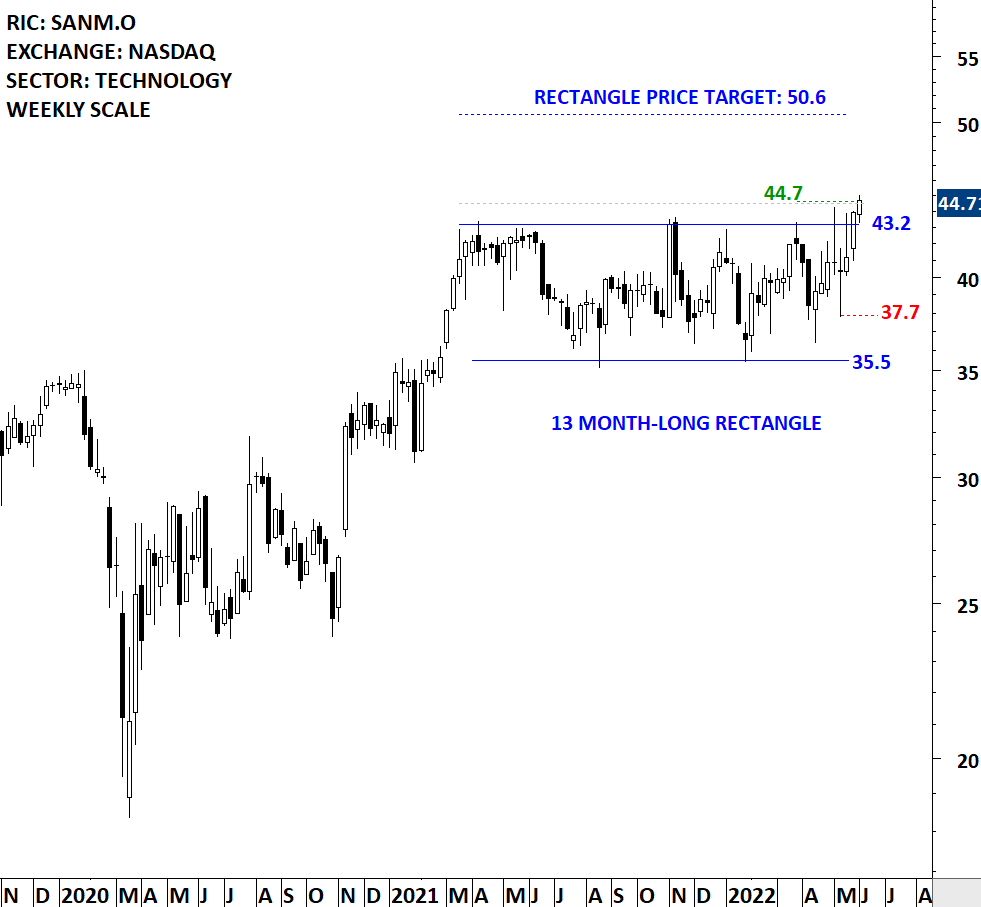
Every week Tech Charts Global Equity Markets report features some of the well-defined, mature classical chart patterns under a lengthy watchlist and the chart pattern breakout signals that took place during that week. Global Equity Markets report covers single stocks from developed, emerging and frontier markets, ETF’s, select commodities, cryptocurrencies and global equity indices. Below chart is from the breakout alerts section of the weekly report. It is featuring a rectangle continuation chart pattern completing on Sanmina Corporation listed on the Nasdaq Stock Exchange.
Sanmina Corporation is a provider of integrated manufacturing solutions, components, products and repair, logistics and after-market services. The Company provides these offerings to original equipment manufacturers (OEMs) that serves the industrial, medical, defense and aerospace, automotive, communications networks and cloud solutions industries. The stock is listed on the Nasdaq Stock Exchange. Price chart formed a 13 month-long rectangle with the horizontal boundary acting as strong resistance at 43.20 levels. The horizontal boundary was tested several times over the course of the chart pattern. The daily close above 44.50 levels confirmed the breakout from the 13 month-long rectangle with the possible chart pattern price target of 50.60 levels.
By becoming a Premium Member, you’ll be able to improve your knowledge of the principles of classical charting.
With this knowledge, you can merge them with your investing system. In fact, some investors use my analyses to modify their existing style to invest more efficiently and successfully.
You will receive:
For your convenience your membership auto renews each year.

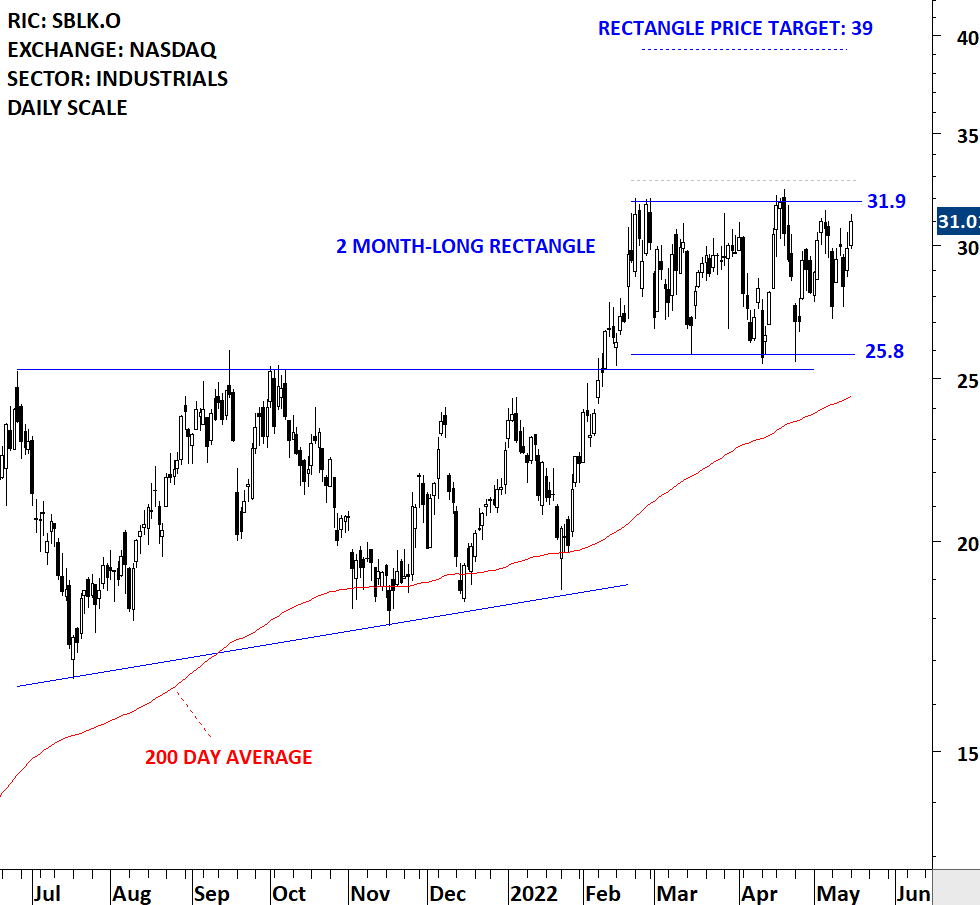
Every week Tech Charts Global Equity Markets report features some of the well-defined, mature classical chart patterns under a lengthy watchlist and the chart pattern breakout signals that took place during that week. Global Equity Markets report covers single stocks from developed, emerging and frontier markets, ETF’s, select commodities, cryptocurrencies and global equity indices. Below chart is from the watchlist section of the weekly report. It is featuring a rectangle continuation chart pattern on Star Bulk Carriers Corp listed on the Nasdaq Stock Exchange.
Star Bulk Carriers Corp is a Greece-based shipping company. It owns and operates a fleet of dry bulk carrier vessels. The Company’s vessels transport major bulks, which include iron ore, coal and grain, and minor bulks, which include bauxite, fertilizers and steel products. The stock is listed on the Nasdaq Stock Exchange. Price chart formed a 2 month-long rectangle with the horizontal boundary acting as resistance at 31.90 levels. The horizontal boundary was tested several times over the course of the chart pattern. A daily close above 32.80 levels will confirm the breakout from the 2 month-long rectangle with the possible chart pattern price target of 39.00 levels. Rectangle can act as a continuation chart pattern after the stock completed a larger scale ascending triangle. Data as of May 16, 2022.
By becoming a Premium Member, you’ll be able to improve your knowledge of the principles of classical charting.
With this knowledge, you can merge them with your investing system. In fact, some investors use my analyses to modify their existing style to invest more efficiently and successfully.
You will receive:
For your convenience your membership auto renews each year.