“Demystifying the world of Classical Charting”
– AKSEL KIBAR
Every week Tech Charts Global Equity Markets report features some of the well-defined, mature classical chart patterns under a lengthy watchlist and the chart pattern breakout signals that took place during that week. Global Equity Markets report covers single stocks from developed, emerging and frontier markets, ETF’s and global equity indices. The report starts with a review section that highlights the important chart developments on global equity benchmarks. This blog post features from the watchlist section BARRICK GOLD CORP, listed on the New York Stock Exchange.
Read More
Every week Tech Charts Global Equity Markets report features some of the well-defined, mature classical chart patterns under a lengthy watchlist and the chart pattern breakout signals that took place during that week. Global Equity Markets report covers single stocks from developed, emerging and frontier markets, ETF’s and global equity indices. The report starts with a review section that highlights the important chart developments on global equity benchmarks. This blog post features from the review section iShares MSCI Emerging Markets Index ETF (EEM) and iShares Frontier 100 Index ETF (FM), listed on the New York Stock Exchange.
Read More
Every week Tech Charts Global Equity Markets report features some of the well-defined, mature classical chart patterns under a lengthy watchlist and the chart pattern breakout signals that took place during that week. Global Equity Markets report covers single stocks from developed, emerging and frontier markets, ETF’s and global equity indices. The report starts with a review section that highlights the important chart developments on global equity benchmarks. This blog post features from the watchlist section SPAREBANK 1 SMN, listed on the Oslo Stock Exchange. Blog post is followed by a short educational video on Ascending Triangle that acts as a bullish continuation chart pattern.
Read More
Every week Tech Charts Global Equity Markets report features some of the well-defined, mature classical chart patterns under a lengthy watchlist and the chart pattern breakout signals that took place during that week. Global Equity Markets report covers single stocks from developed, emerging and frontier markets, ETF’s and global equity indices. The report starts with a review section that highlights the important chart developments on global equity benchmarks. This blog post features from the watchlist section CEZ Group, listed on the Prague Stock Exchange. Blog post is followed by a short educational video on Symmetrical Triangle that acts as a bullish continuation chart pattern.
Read More
Every week Tech Charts Global Equity Markets report features some of the well-defined, mature classical chart patterns under a lengthy watchlist and the chart pattern breakout signals that took place during that week. Global Equity Markets report covers single stocks from developed, emerging and frontier markets, ETF’s and global equity indices. The report starts with a review section that highlights the important chart developments on global equity benchmarks. This blog post features from the watchlist section Sodexo SA, listed on the Paris Stock Exchange.
Read More
Every week Tech Charts Global Equity Markets report features some of the well-defined, mature classical chart patterns under a lengthy watchlist and the chart pattern breakout signals that took place during that week. Global Equity Markets report covers single stocks from developed, emerging and frontier markets, ETF’s and global equity indices. The report starts with a review section that highlights the important chart developments on global equity benchmarks. This blog post features from the watchlist section ERICSSON, listed on the Stockholm Stock Exchange.
Read More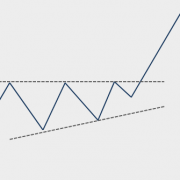
Every week Tech Charts Global Equity Markets report features some of the well-defined, mature classical chart patterns under a lengthy watchlist and the chart pattern breakout signals that took place during that week. Global Equity Markets report covers single stocks from developed, emerging and frontier markets, ETF’s and global equity indices. The report starts with a review section that highlights the important chart developments on global equity benchmarks. This blog post features from the watchlist section ENTRA ASA, listed on the Oslo Stock Exchange.
Read MoreEvery week Tech Charts Global Equity Markets report features some of the well-defined, mature classical chart patterns under a lengthy watchlist and the chart pattern breakout signals that took place during that week. Global Equity Markets report covers single stocks from developed, emerging and frontier markets, ETF’s and global equity indices. The report starts with a review section that highlights the important chart developments on global equity benchmarks. This blog post features from the watchlist section Sodexo SA, listed on the Paris Stock Exchange.
Read More
Every week Tech Charts Global Equity Markets report features some of the well-defined, mature classical chart patterns under a lengthy watchlist and the chart pattern breakout signals that took place during that week. Global Equity Markets report covers single stocks from developed, emerging and frontier markets, ETF’s and global equity indices. The report starts with a review section that highlights the important chart developments on global equity benchmarks. This blog post features from the review section the iShares MSCI Emerging Markets Index ETF (EEM)
Read More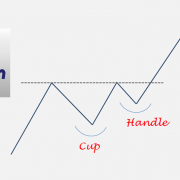
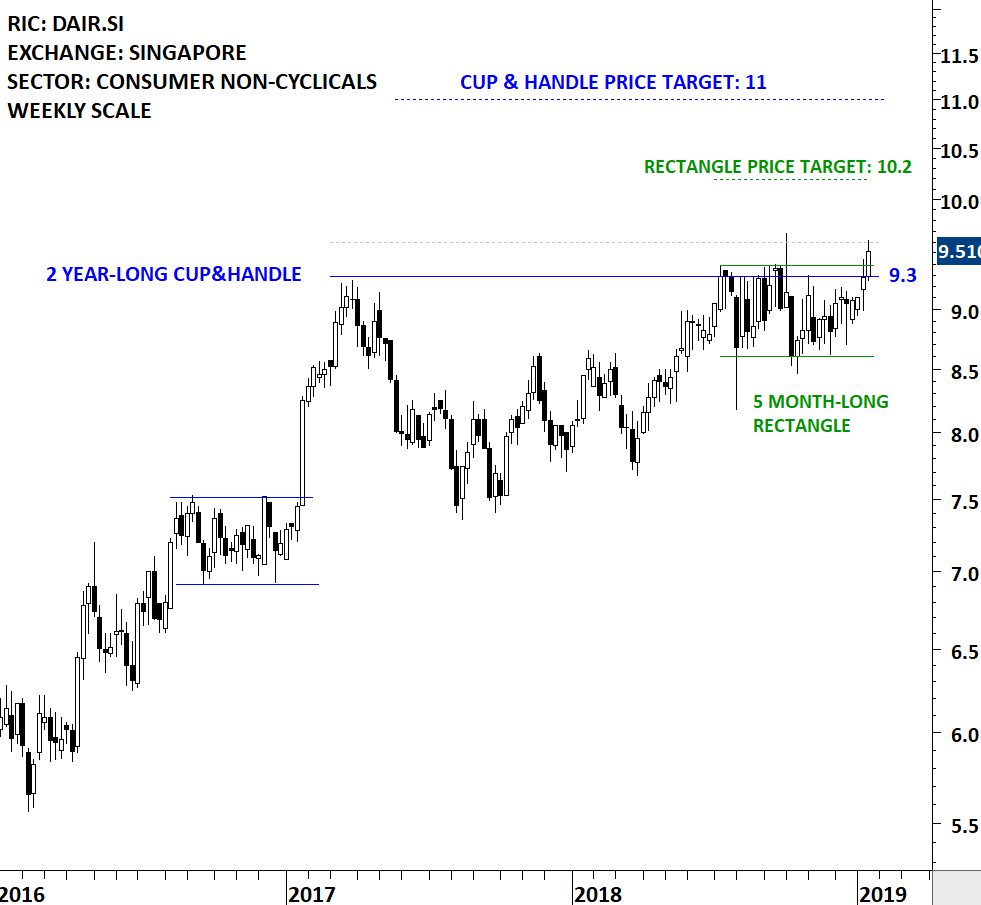
Every week Tech Charts Global Equity Markets report features some of the well-defined, mature classical chart patterns under a lengthy watchlist and the chart pattern breakout signals that took place during that week. Global Equity Markets report covers single stocks from developed, emerging and frontier markets, ETF’s and global equity indices. The report starts with a review section that highlights the important chart developments on global equity benchmarks. This blog post features from the watchlist section a bullish cup & handle continuation chart pattern on Singapore’s Dairy Farm International Holdings (DAIR.SI)
Dairy Farm International Holdings Limited is a Hong Kong-based Asian retailer. The Company operates in four segments: Food, Health and Beauty, Home Furnishings, and Restaurants. The stock is listed on the Singapore Stock Exchange. Price chart formed a 2 year-long cup & handle continuation with the horizontal boundary acting as strong resistance at 9.3 levels. The horizontal boundary was tested several times over the course of the chart pattern. A daily close above 9.6 levels will confirm the breakout from the 2 year-long cup & handle continuation with the possible chart pattern price target of 11 levels. The handle part of the multi year-long consolidation can be identified as a possible rectangle that can act as a launching pattern. Price data is as of January 15, 2019 CET 7:00 AM.

By becoming a Premium Member, you’ll be able to improve your knowledge of the principles of classical charting.
With this knowledge, you can merge them with your investing system. In fact, some investors use my analyses to modify their existing style to invest more efficiently and successfully.
You will receive:
For your convenience your membership auto renews each year.


