“Demystifying the world of Classical Charting”
– AKSEL KIBAR


Every week Tech Charts Global Equity Markets report features some of the well-defined, mature classical chart patterns under a lengthy watchlist and the chart pattern breakout signals that took place during that week. Global Equity Markets report covers single stocks from developed, emerging and frontier markets, ETF’s and global equity indices. The report starts with a review section that highlights the important chart developments on global equity benchmarks. This blog post features from the watchlist section ADVANCE AUTO PARTS, listed on the New York Stock Exchange.
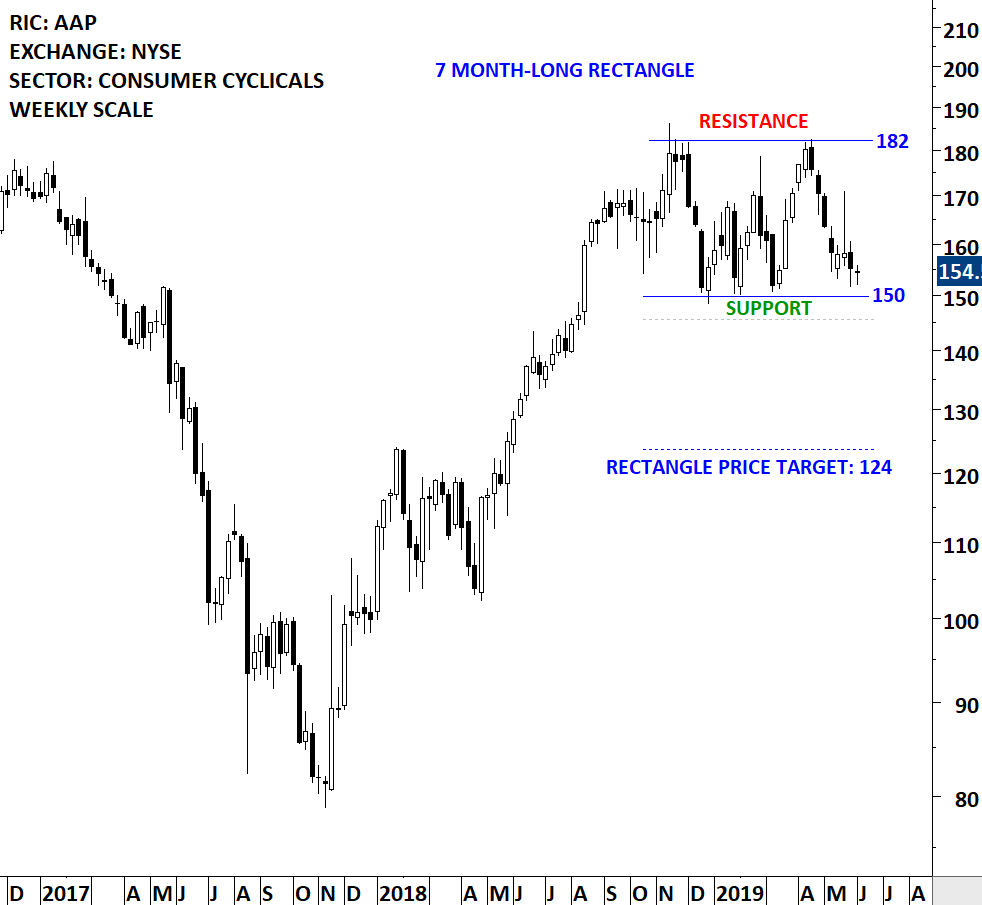
Advance Auto Parts, Inc. provides automotive aftermarket parts in North America, serving do-it-for-me (Professional) and do-it-yourself (DIY), customers. The Company’s stores and branches offer a selection of brand name, original equipment manufacturer (OEM) and private label automotive replacement parts, accessories, batteries and maintenance items for domestic and imported cars, vans, sport utility vehicles and light and heavy duty trucks. The stock is listed on the Nasdaq Stock Exchange. Price chart formed a 7 month-long rectangle with the upper boundary acting as resistance at 182 and the lower boundary as support at 150 levels. Both boundaries were tested several times over the course of the chart pattern. A daily close below 145.5 levels will confirm the breakdown from the 7 month-long rectangle with the possible chart pattern price target of 124 levels. Rectangle can act as a reversal as well as a continuation. Until there is a breakout above 182 levels or a breakdown below 150 levels the chart pattern offers a trading opportunity between the boundaries. (Data as of 04/06/2019 EST 12:30 pm)

By becoming a Premium Member, you’ll be able to improve your knowledge of the principles of classical charting.
With this knowledge, you can merge them with your investing system. In fact, some investors use my analyses to modify their existing style to invest more efficiently and successfully.
You will receive:
For your convenience your membership auto renews each year.
Every week Tech Charts Global Equity Markets report features some of the well-defined, mature classical chart patterns under a lengthy watchlist and the chart pattern breakout signals that took place during that week. Global Equity Markets report covers single stocks from developed, emerging and frontier markets, ETF’s and global equity indices. The report starts with a review section that highlights the important chart developments on global equity benchmarks. This blog post features from the watchlist section KINDEN CORP., listed on the Nikkei Stock Exchange.
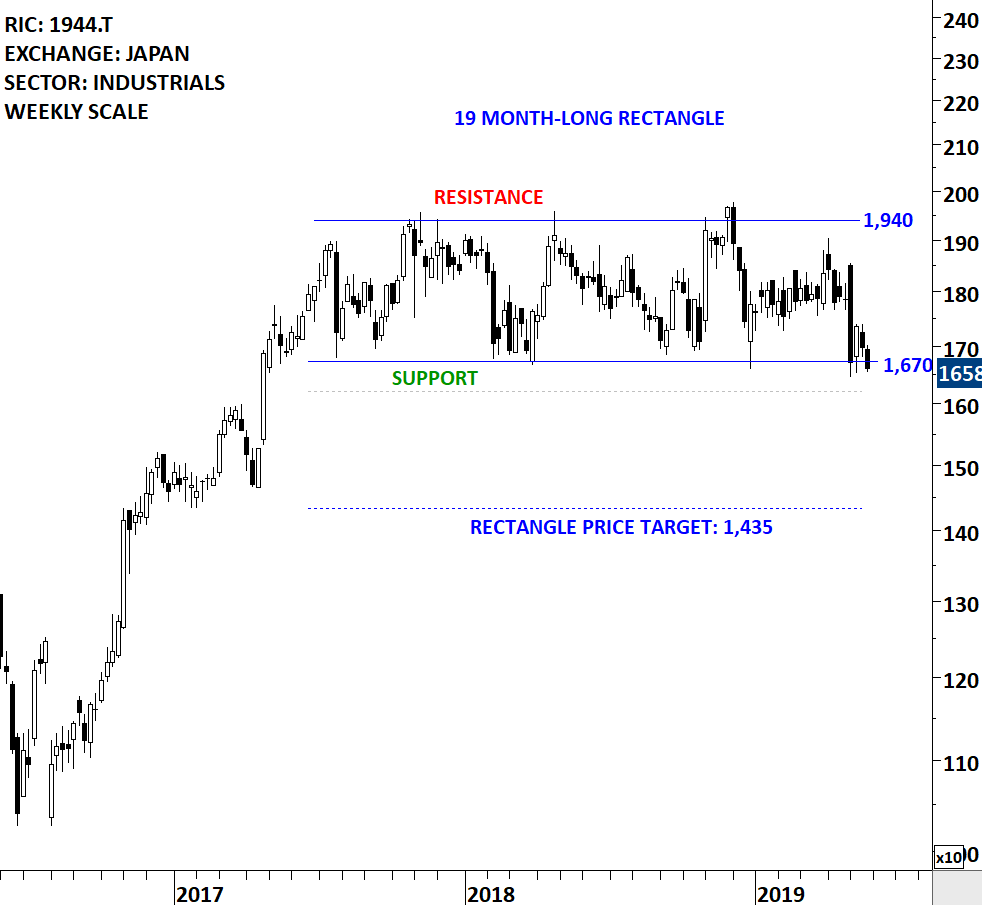
KINDEN CORPORATION is a Japan-based construction company. The stock is listed on the Tokyo Stock Exchange. Price chart formed a 19 month-long rectangle with the lower boundary acting as strong support at 1,670 levels and the upper boundary as resistance at 1,940 levels. KINDEN CORPORATION is trading between well-defined chart pattern boundaries. Multi-month long rectangle chart pattern with well-defined horizontal boundaries is offering good trading opportunity. A daily close below 1,620 levels can confirm the rectangle chart pattern as a top reversal with the possible chart pattern price target of 1,435 levels. Breakdown after several tests of chart pattern boundary can be followed by a strong directional move. Data as of 28/05/2019
By becoming a Premium Member, you’ll be able to improve your knowledge of the principles of classical charting.
With this knowledge, you can merge them with your investing system. In fact, some investors use my analyses to modify their existing style to invest more efficiently and successfully.
You will receive:
For your convenience your membership auto renews each year.
Every week Tech Charts Global Equity Markets report features some of the well-defined, mature classical chart patterns under a lengthy watchlist and the chart pattern breakout signals that took place during that week. Global Equity Markets report covers single stocks from developed, emerging and frontier markets, ETF’s and global equity indices. The report starts with a review section that highlights the important chart developments on global equity benchmarks. This blog post features from the watchlist section SYSTEMAX INC., listed on the New York Stock Exchange.
Read More
Every week Tech Charts Global Equity Markets report features some of the well-defined, mature classical chart patterns under a lengthy watchlist and the chart pattern breakout signals that took place during that week. Global Equity Markets report covers single stocks from developed, emerging and frontier markets, ETF’s and global equity indices. The report starts with a review section that highlights the important chart developments on global equity benchmarks. This blog post features from the watchlist section CITRIX SYSTEMS INC., listed on the Nasdaq Stock Exchange.
Read More
Around this time last year, I was one of the presenters at the Dubai Trader’s Summit organized by MetaStock. I discussed several classical chart patterns. The even was not recorded. I created several educational videos to share with Tech Charts members and followers who didn’t have the chance to attend the event. Below is one of those parts on my favorite classical chart pattern setup. It is hosted on Tech Charts You Tube page. If you haven’t subscribed to our free You Tube page, I suggest you do so, as we will be uploading more free resources.
By becoming a Premium Member, you’ll be able to improve your knowledge of the principles of classical charting.
With this knowledge, you can merge them with your investing system. In fact, some investors use my analyses to modify their existing style to invest more efficiently and successfully.
You will receive:
For your convenience your membership auto renews each year.

Every week Tech Charts Global Equity Markets report features some of the well-defined, mature classical chart patterns under a lengthy watchlist and the chart pattern breakout signals that took place during that week. Global Equity Markets report covers single stocks from developed, emerging and frontier markets, ETF’s and global equity indices. The report starts with a review section that highlights the important chart developments on global equity benchmarks. This blog post features from the watchlist section HSBC HOLDINGS PLC, listed on the Hong Kong Stock Exchange.
Read More
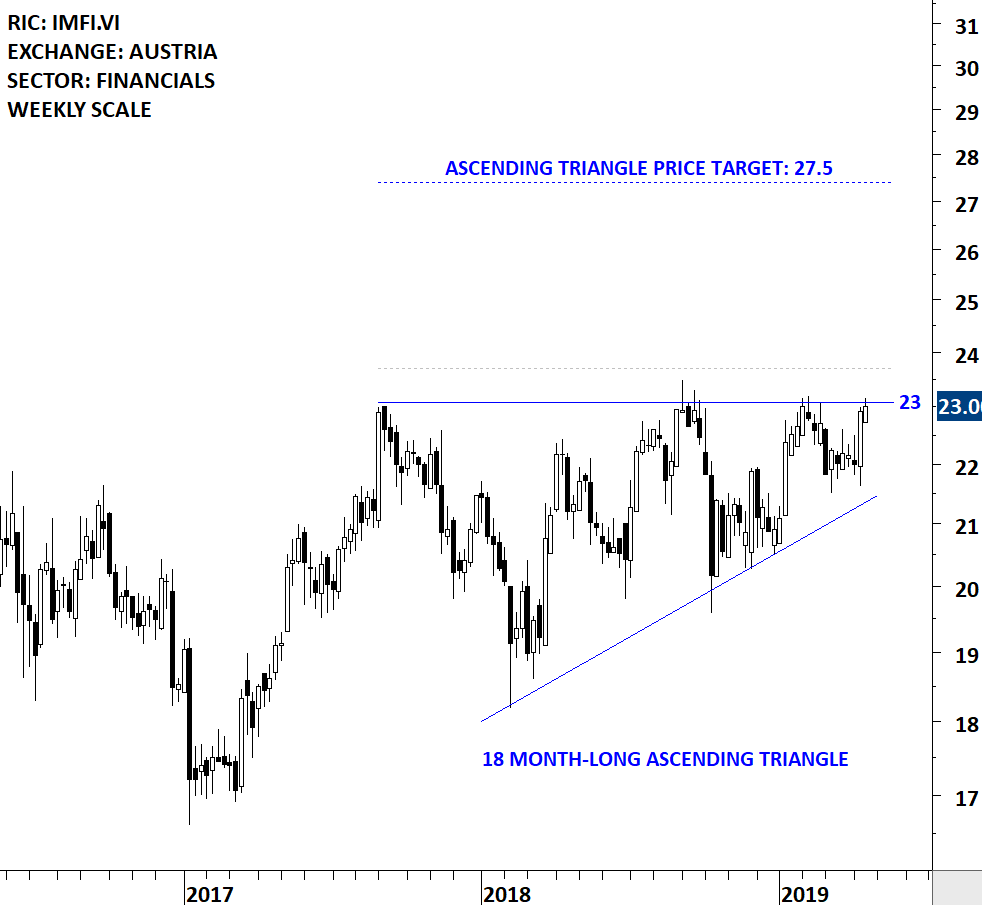
Every week Tech Charts Global Equity Markets report features some of the well-defined, mature classical chart patterns under a lengthy watchlist and the chart pattern breakout signals that took place during that week. Global Equity Markets report covers single stocks from developed, emerging and frontier markets, ETF’s and global equity indices. The report starts with a review section that highlights the important chart developments on global equity benchmarks. This blog post features from the watchlist section IMMOFINANZ AG, listed on the Vienna Stock Exchange.
Immofinanz AG is an Austria-based real estate company that invests in commercial properties. The Company’s core activities are the management and development of retail and office properties in selected Central and Eastern European countries. The stock is listed on the Vienna Stock Exchange. Price chart formed an 18 month-long ascending triangle with the horizontal boundary acting as strong resistance at 23.0 levels. The horizontal boundary was tested several times over the course of the chart pattern. A daily close above 23.7 levels will confirm the breakout from the 18 month-long ascending triangle with the possible chart pattern price target of 27.5 levels.
By becoming a Premium Member, you’ll be able to improve your knowledge of the principles of classical charting.
With this knowledge, you can merge them with your investing system. In fact, some investors use my analyses to modify their existing style to invest more efficiently and successfully.
You will receive:
For your convenience your membership auto renews each year.

I discussed some of the important charts I've been following in India equity, FX and bond markets. India has been outperforming the Emerging Markets. With the index pushing to all-time highs, we can expect similar strength to continue. Below you can find my interview on ET Now and also the charts I discussed during the interview.
Read More
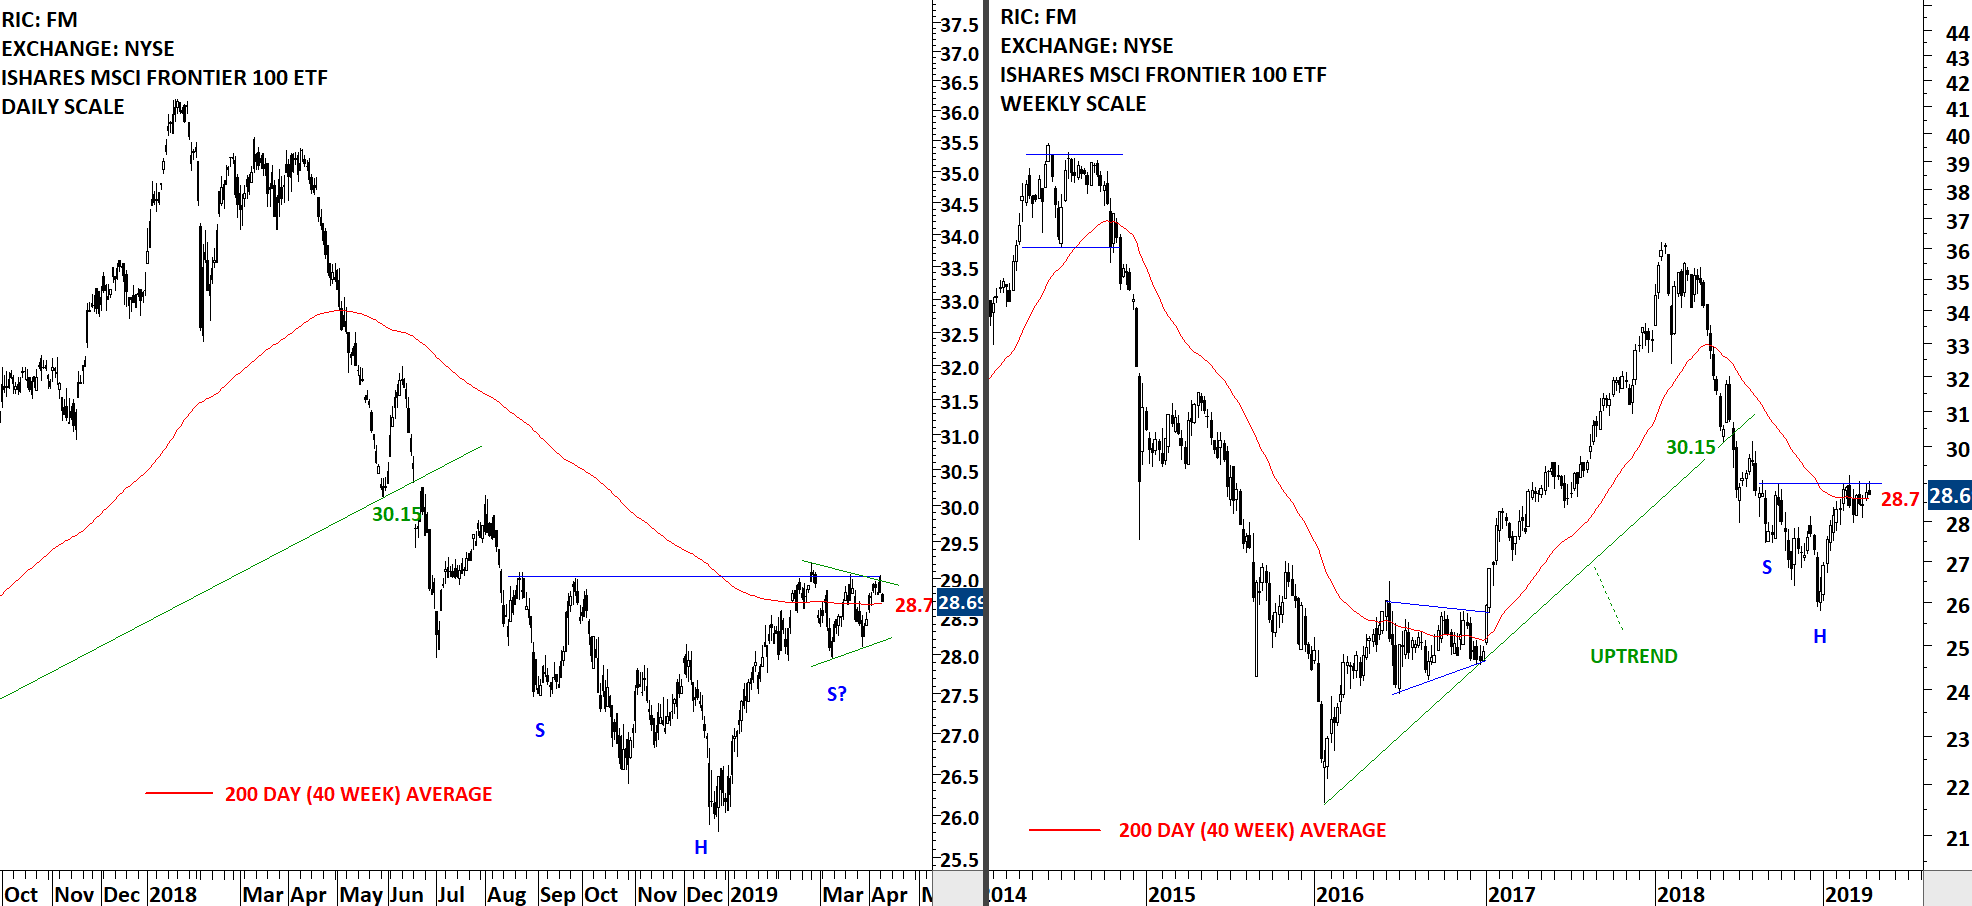
Every week Tech Charts Global Equity Markets report features some of the well-defined, mature classical chart patterns under a lengthy watchlist and the chart pattern breakout signals that took place during that week. Global Equity Markets report covers single stocks from developed, emerging and frontier markets, ETF’s and global equity indices. The report starts with a review section that highlights the important chart developments on global equity benchmarks. This blog post features from the review section iShares MSCI Frontier 100 Index ETF (FM).
The benchmark for the Frontier markets, the iShares MSCI Frontier 100 ETF (FM) is possibly forming a symmetrical triangle that will act as a launching pattern for the H&S bottom reversal. The symmetrical triangle is forming around the 200-day moving average, a setup that I usually look for. Completion of the month-long symmetrical triangle will push the price above the long-term average and also clear the horizontal resistance (neckline for H&S bottom) at 29 levels. (Data as of 6:00 pm CET /April 9, 2019)
By becoming a Premium Member, you’ll be able to improve your knowledge of the principles of classical charting.
With this knowledge, you can merge them with your investing system. In fact, some investors use my analyses to modify their existing style to invest more efficiently and successfully.
You will receive:
For your convenience your membership auto renews each year.

Every week Tech Charts Global Equity Markets report features some of the well-defined, mature classical chart patterns under a lengthy watchlist and the chart pattern breakout signals that took place during that week. Global Equity Markets report covers single stocks from developed, emerging and frontier markets, ETF’s and global equity indices. The report starts with a review section that highlights the important chart developments on global equity benchmarks. This blog post features from the review section iShares MSCI Emerging Markets Index ETF (EEM).
Read More