GLOBAL EQUITY MARKETS – May 24, 2025
REVIEW
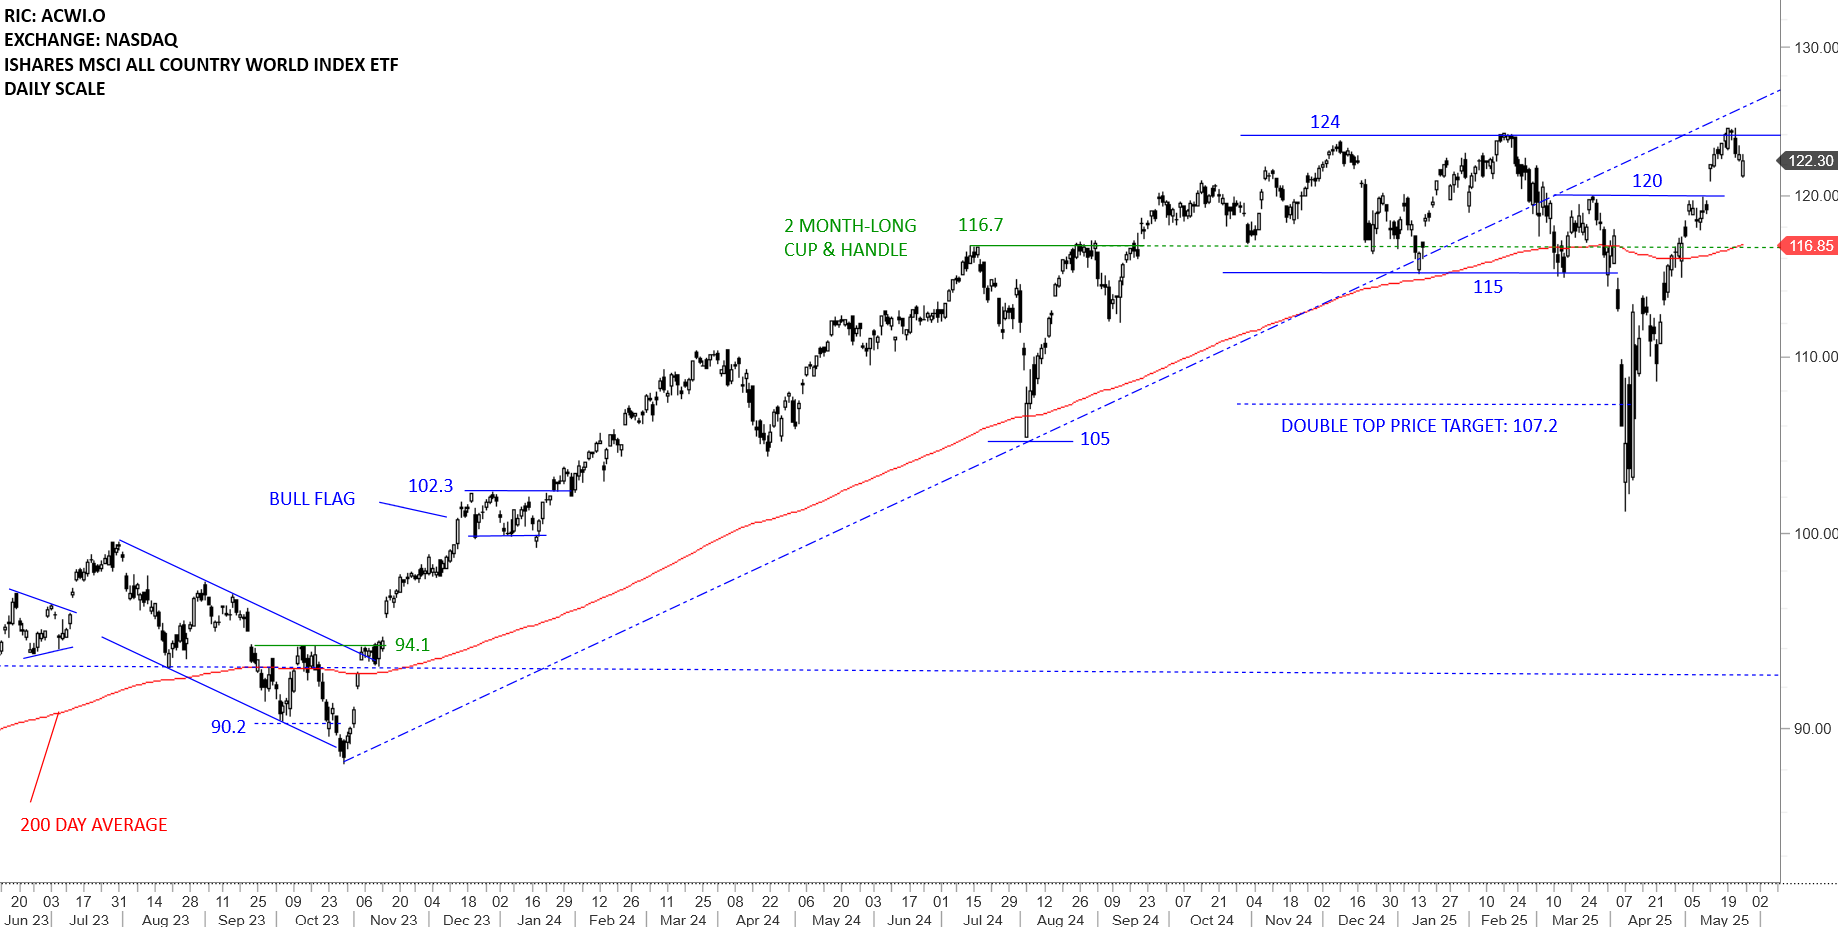
The benchmark for the Global equity markets performance, the iShares MSCI All Country World Index ETF (ACWI.O) did a round trip after the sharp sell-off and reached its all-time highs around 124 levels. The fact that the ETF cleared its 200-day average and moved significantly above it can be analyzed long-term positive as pullbacks and consolidations are likely to find support above the 200-day. I will monitor the ETF to see if it will stabilize above the long-term average in preparation of resuming higher. This can be the short breather after the ETF had a strong rebound. The breather if it forms a higher low above the long-term average in the form of a tight consolidation will increase the conviction on bullish setup, a possible H&S pattern with the neckline at 124 levels. 116.85-120 area will act as support during pullback. Outlook is positive for Global Equities.

GLOBAL EQUITY MARKETS – MAY 24, 2025 – PART I
GLOBAL EQUITY MARKETS – MAY 24, 2025 – PART II

TECH CHARTS WATCHLIST – SUMMARY OF RICS & PATTERNS IN FOCUS
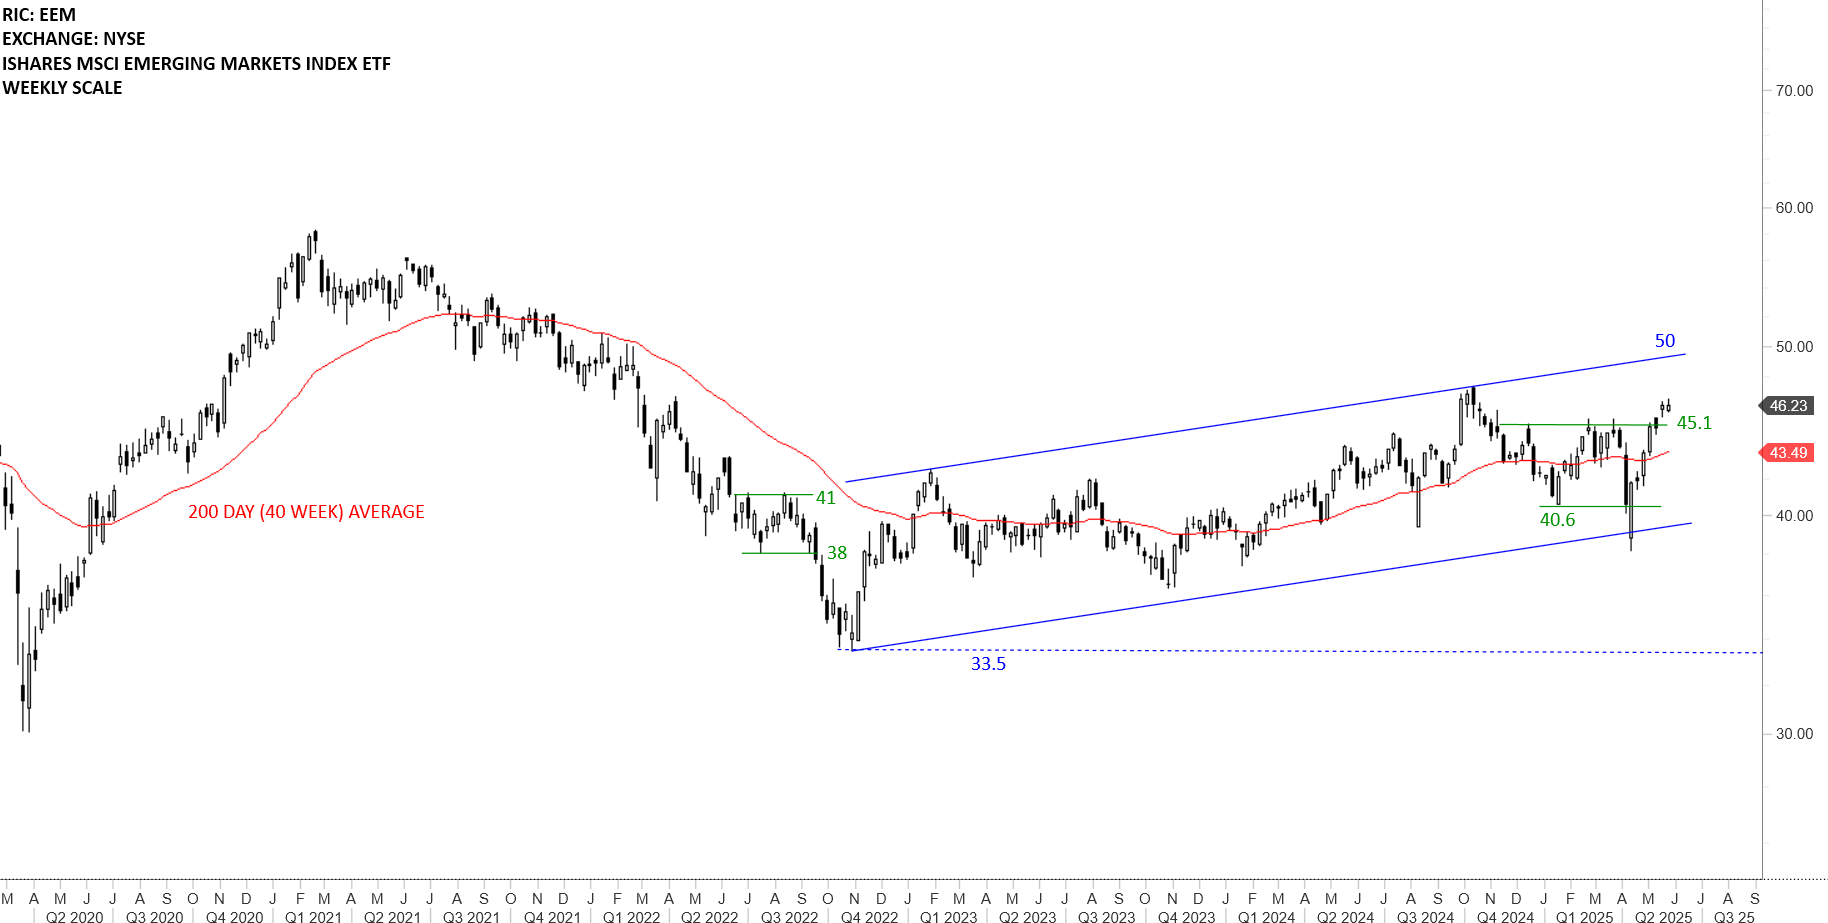
The iShares MSCI Emerging Markets Index ETF (EEM) recovered above its lower boundary of a possible trend channel. Price recovered above its year-long average. Strong short-term resistance was cleared at 45.1 levels. Previous resistance at 45.1 becomes the new short-term support. The ETF can test the upper boundary of the trend channel at 50 levels.
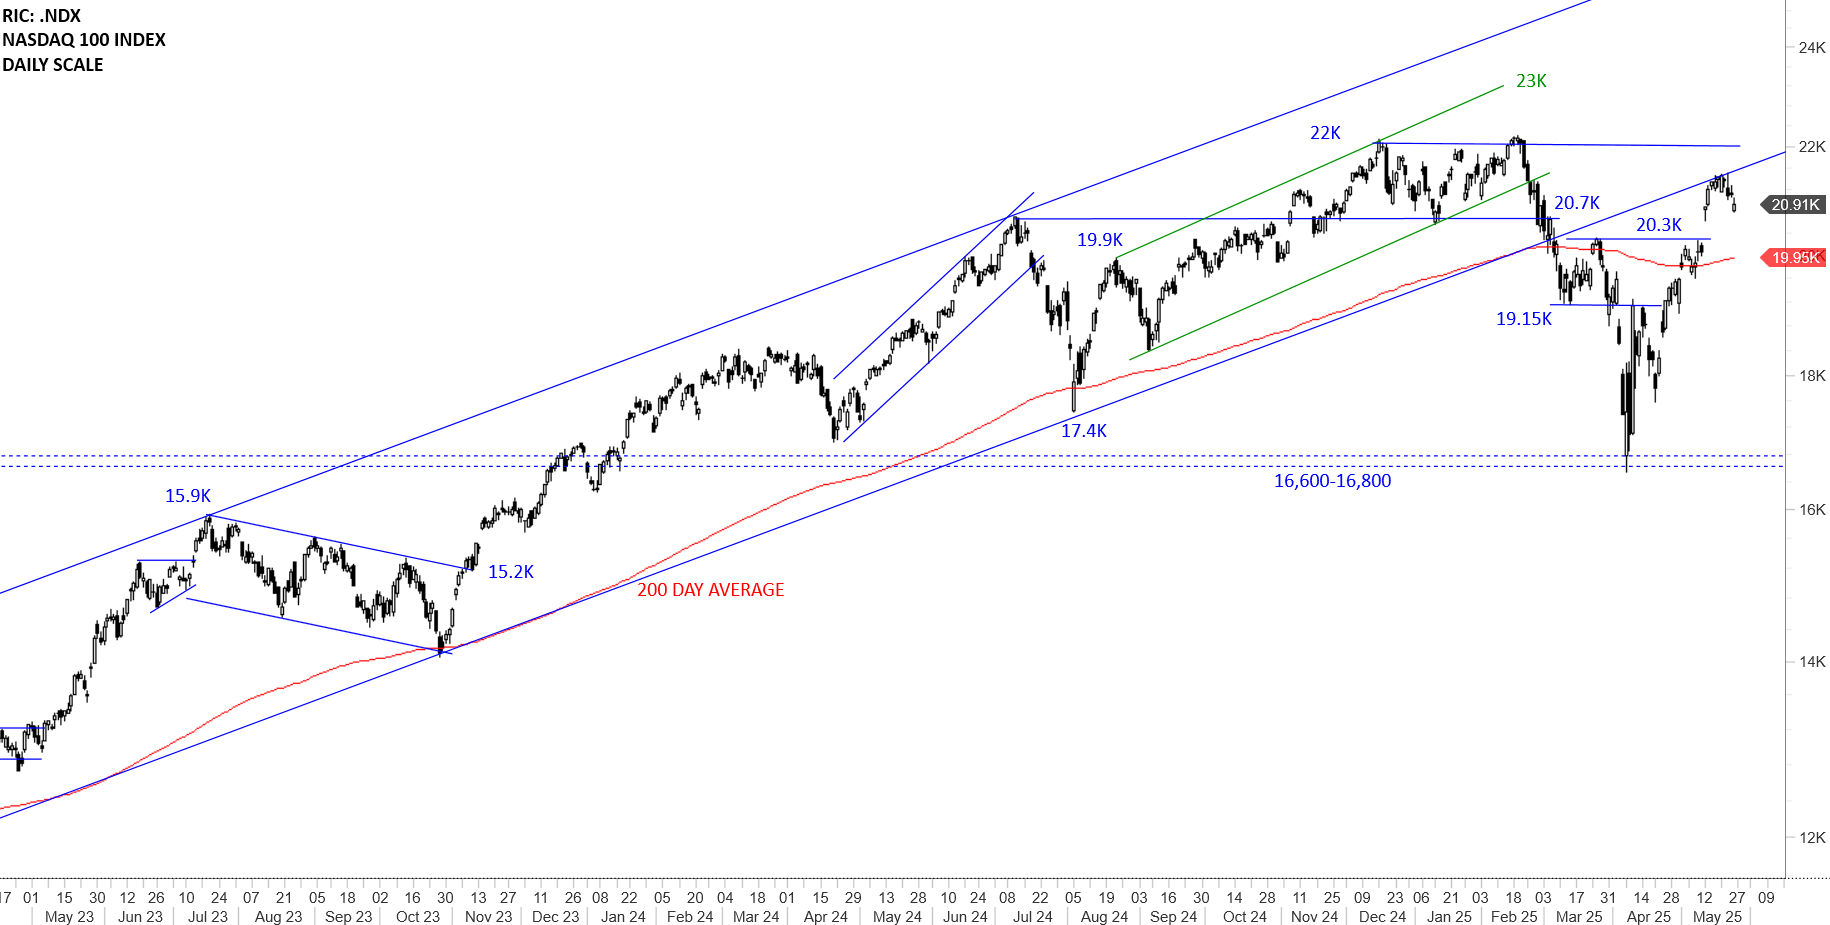
Nasdaq 100 broke down its 200-day average that was acting as support at 20.1K. Earlier, the horizontal support at 20.7K was breached. Sharp sell-off was followed by a similar rebound that took the index back to where it started. Recovery above the long-term average is pushing the index to its all-time highs at 22K. Horizontal resistance is at 22K. I will monitor the price action around the horizontal resistance. With price being well above the year-log average, the outlook is positive for Nasdaq. A short-term consolidation that fills the gap around 20.3K and stabilizes above the 200-day average can give us more insight on the possible direction of the trend.
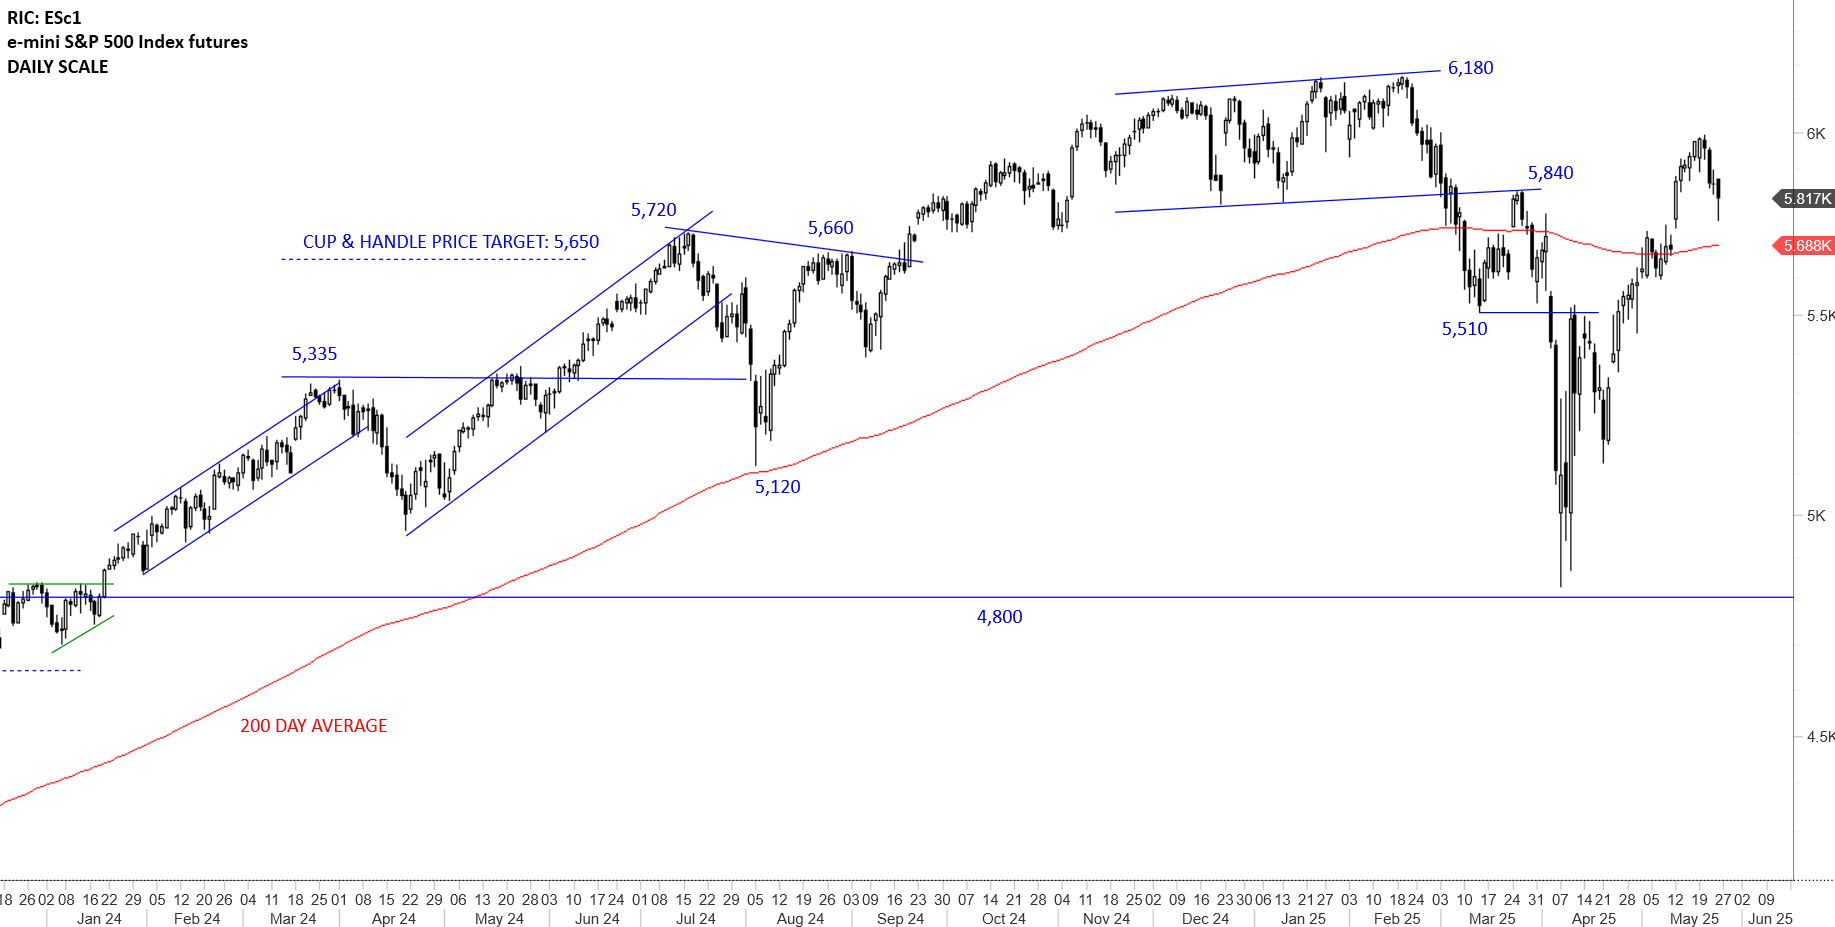
S&P 500 Index formed a well-defined sideways consolidation between 5,840 and 6,180 levels. Failure to hold above the lower boundary and the 200-day average put the uptrend in question. Last few week’s recovery above the year-long average turns the outlook to positive. 5,840-6,180 area can act as resistance in the coming weeks. Monitoring price action for bullish consolidations above the year-long average. It will be important for the price to stabilize above the 200-day average.
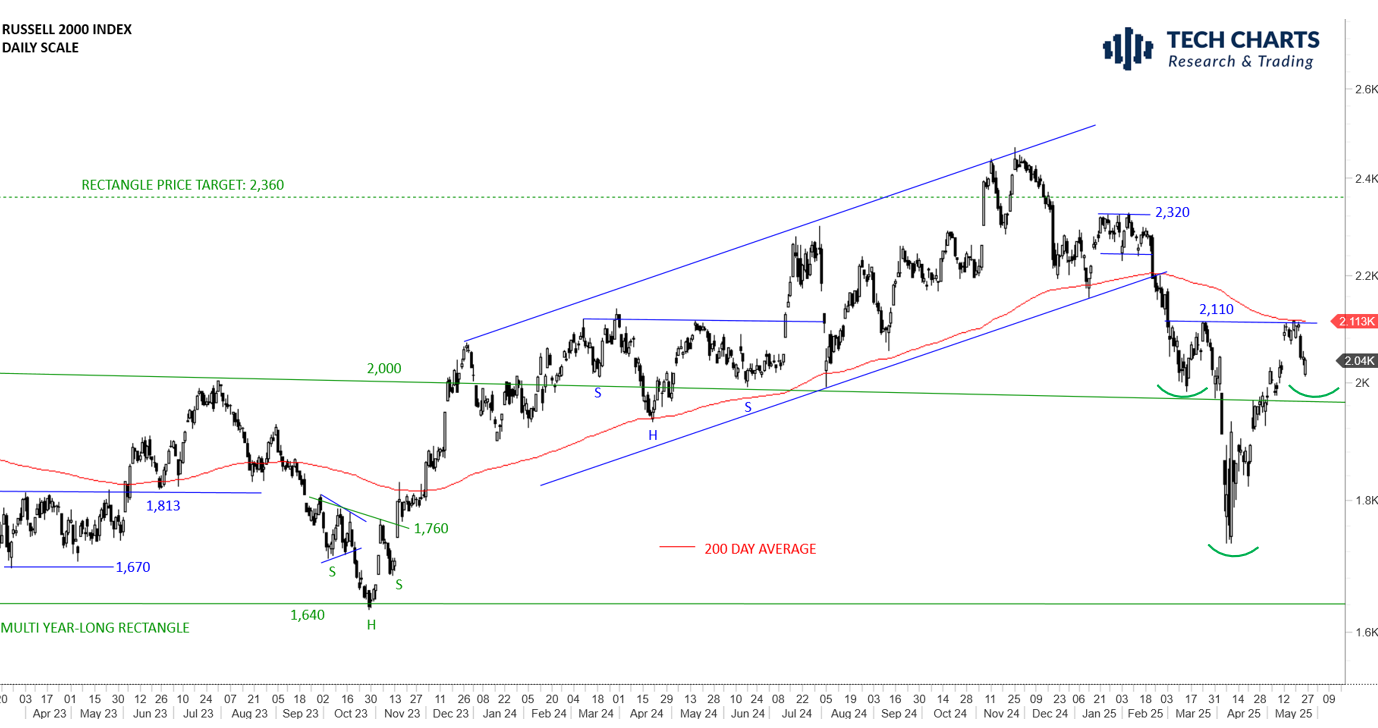
Russell 2000 Index has been a laggard when compared with Tech stocks and Blue chips. After a sharp sell-off and a similar sharp rebound price tested the 200-day average as resistance at 2,116 levels. The minor high is also overlapping as resistance with the long-term average. Still early to call for a change of trend from down to up. I think we will see more back and forth and base building if the index is trying to form a bottom. Another test of the 2,110 horizontal resistance can form the right shoulder of a possible H&S bottom reversal. I’m monitoring the price action for symmetry between both shoulders.
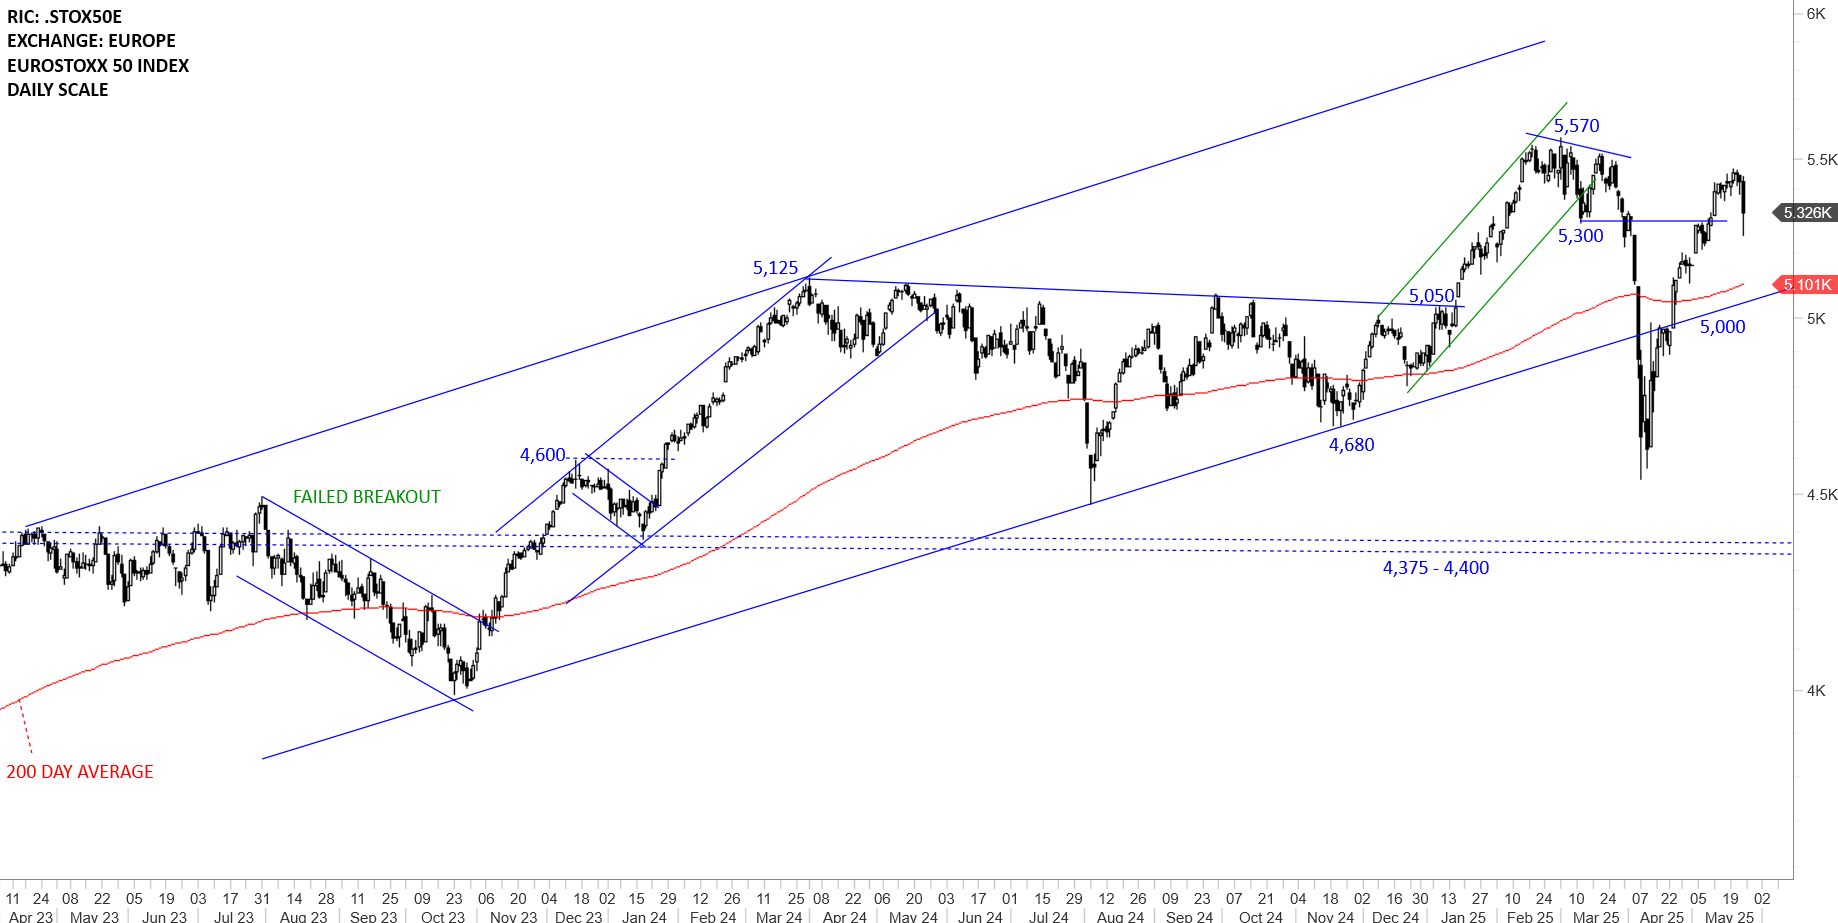
EuroStoxx 50 index recovery above 5,000-5,100 resistance area changed the outlook to positive once again. It will be important for the Euro Stoxx 50 to hold above 5,100 in the following weeks. Pullbacks can stabilize above the year-long average. Next strong resistance is the previous high at 5,570 levels.
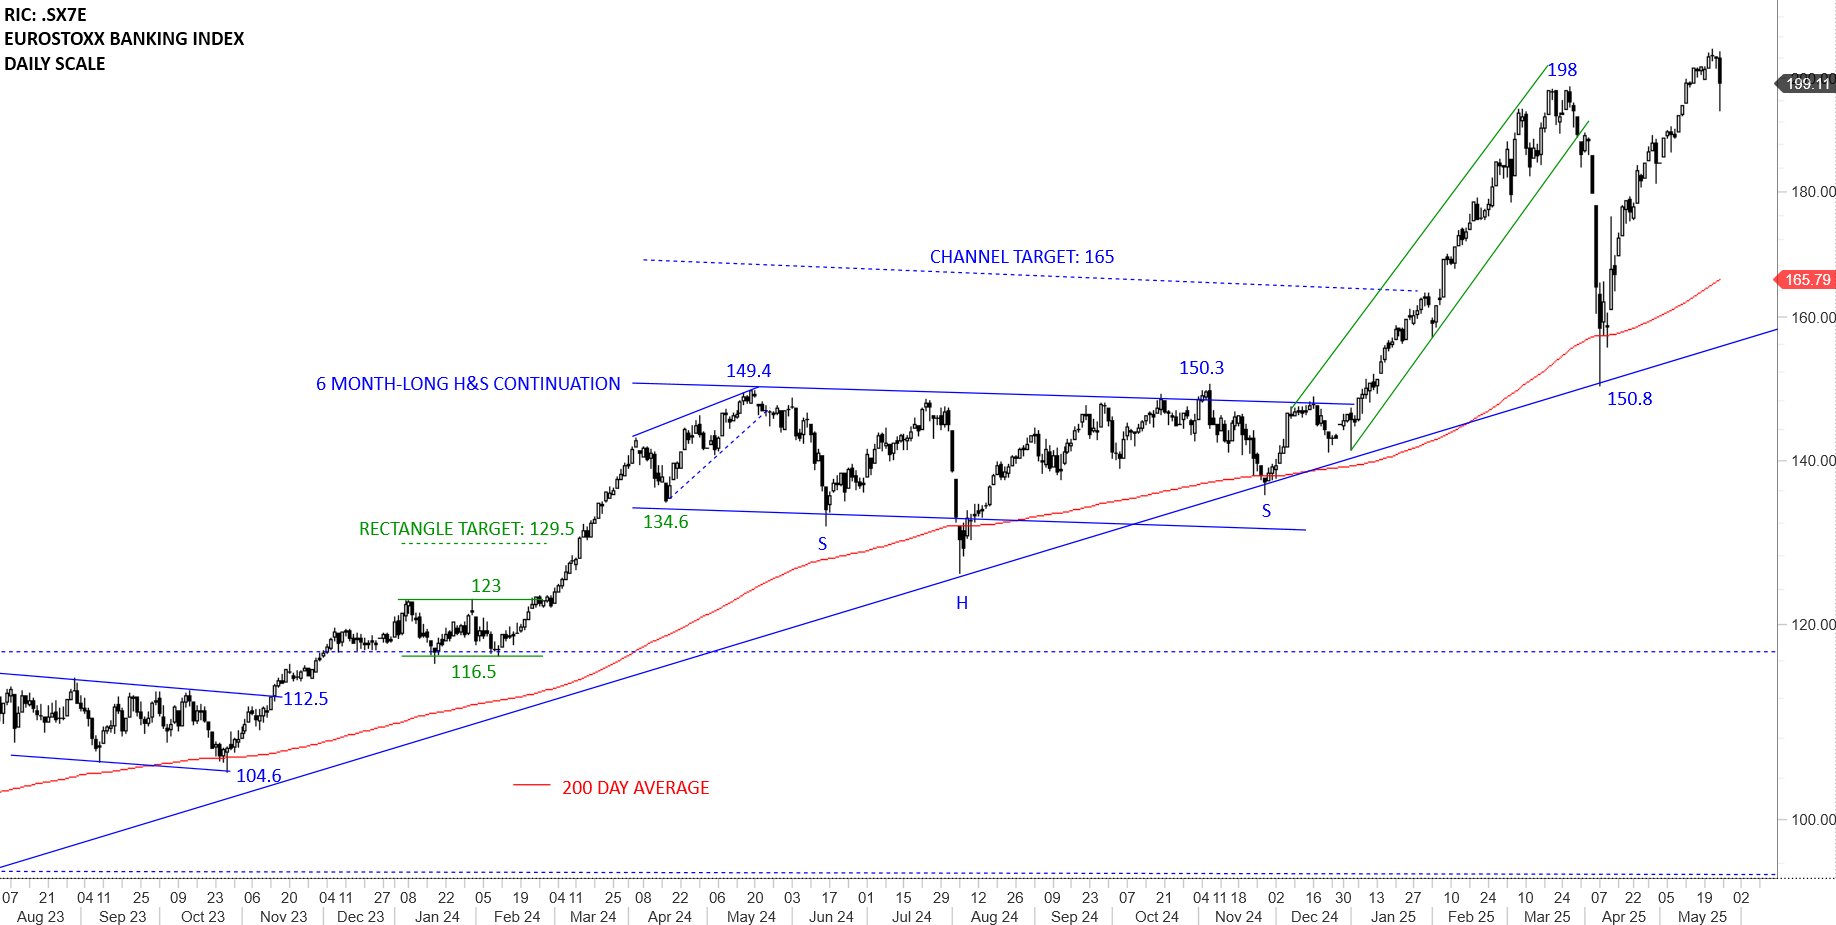
Euro Stoxx Banking Index had a strong rebound from its long-term average. The uninterrupted rally can take a breather close to the resistance at 198 levels. Strong support area is between 150.8 and 166. Uptrend is intact. It is early to call the breach above 198 levels a breakout at this point. The price action is extended relative to its long-term average.
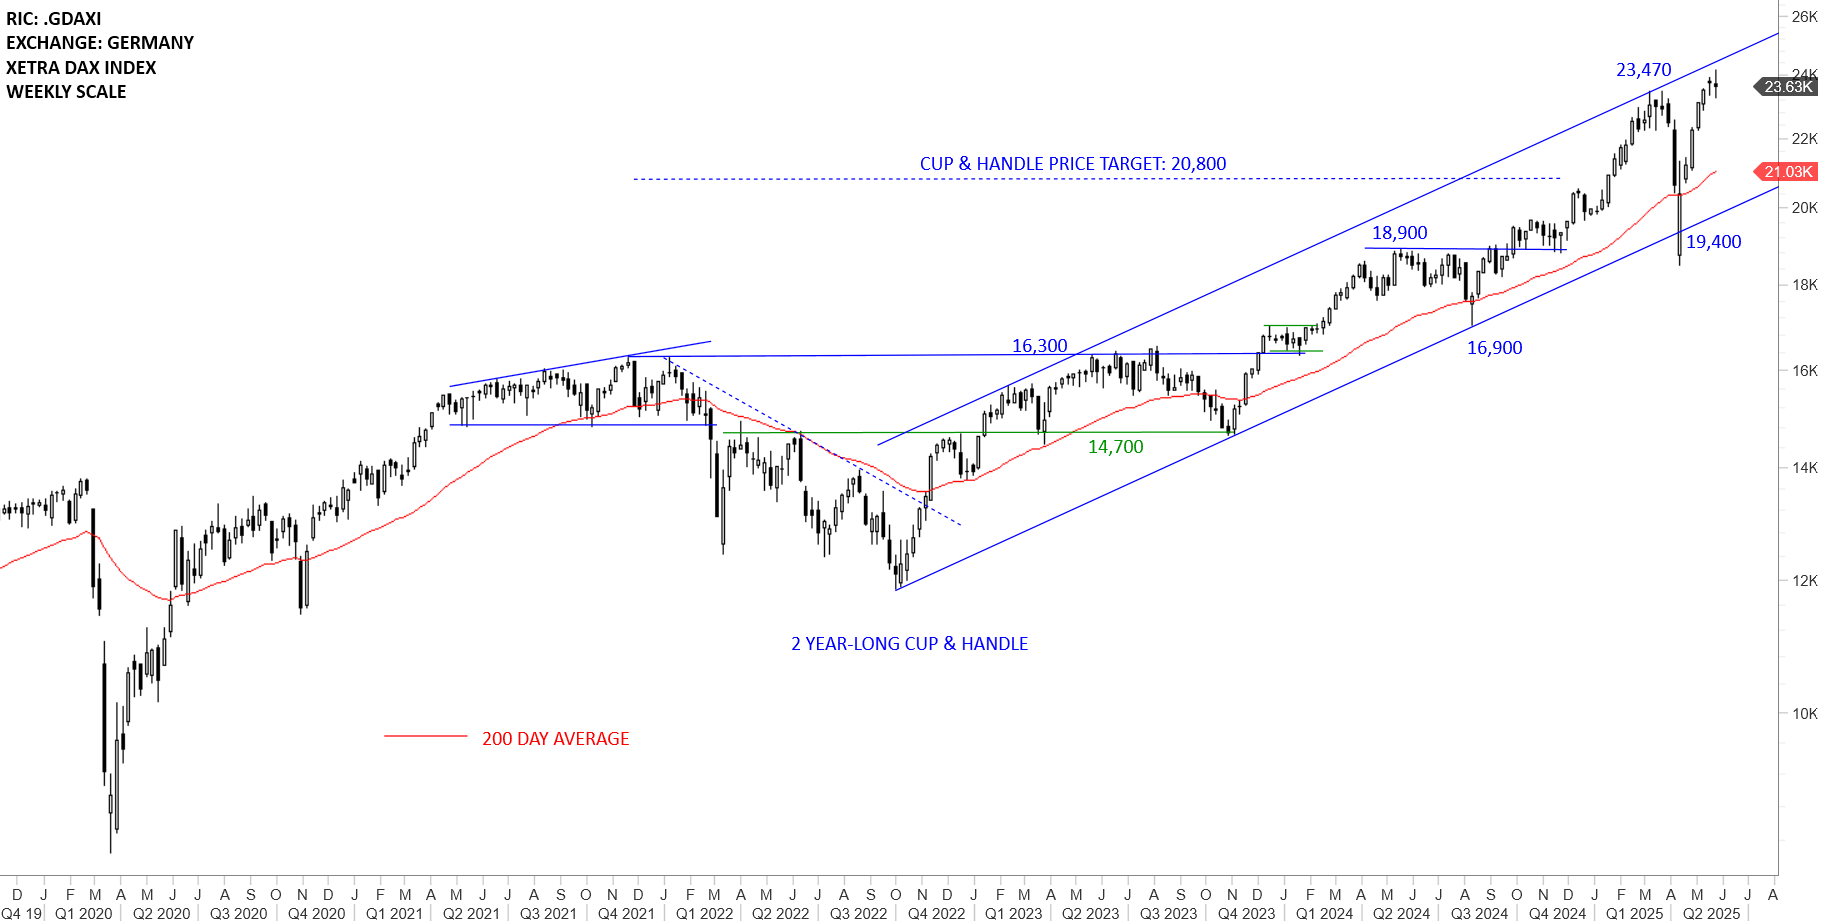
Germany’s XETRA Dax Index completed a 2 year-long cup & handle continuation that broke out to new all-time highs. Long-term cup & handle continuation price target was met at 20,800 levels. Strong support is between 19.4K and 21K levels. The index remains in an uptrend above its long-term average and inside the trend channel. The upper boundary of the channel and the previous high can act as resistance.
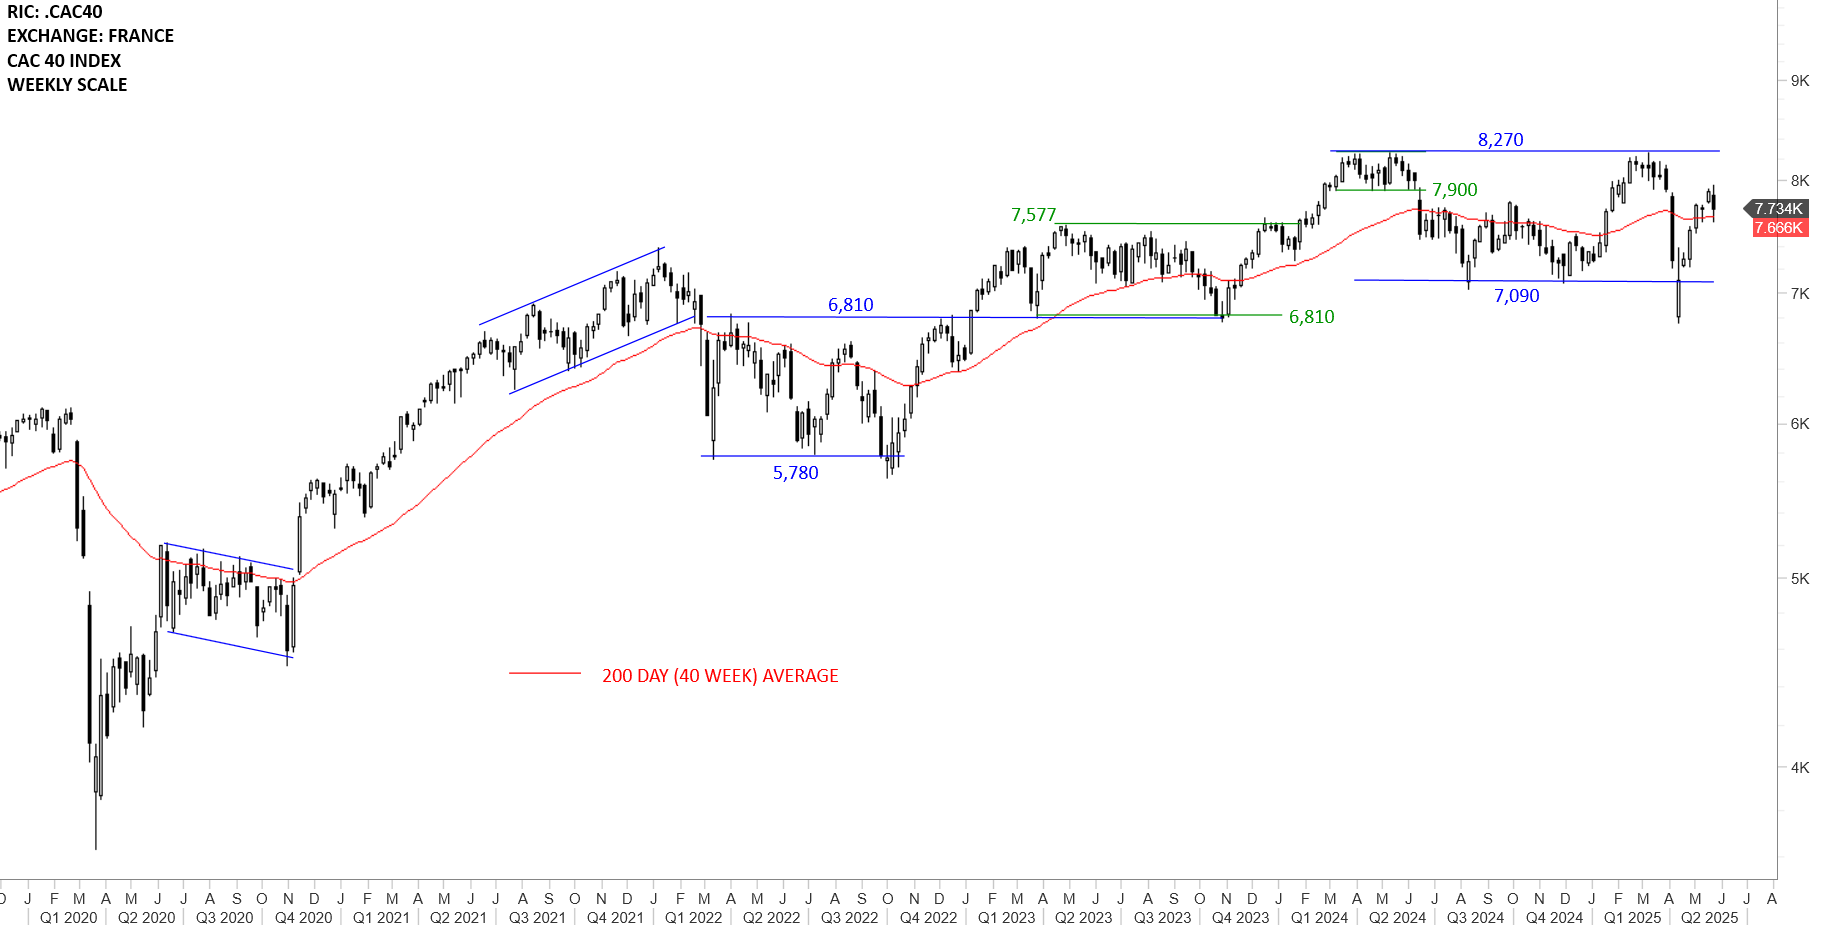
France CAC 40 Index recovered above 7,090 levels. Price action can be analyzed as a trading range between 7,090 and 8,270 levels for the time being. Continued strength that breached the 200-day average can target the upper boundary at 8,270 levels. A weekly close below 7,090 levels can confirm the top reversal with a price target of 6,150 levels. It will be important for the index to stabilize above its year-long average for the bullish outlook to remain intact.
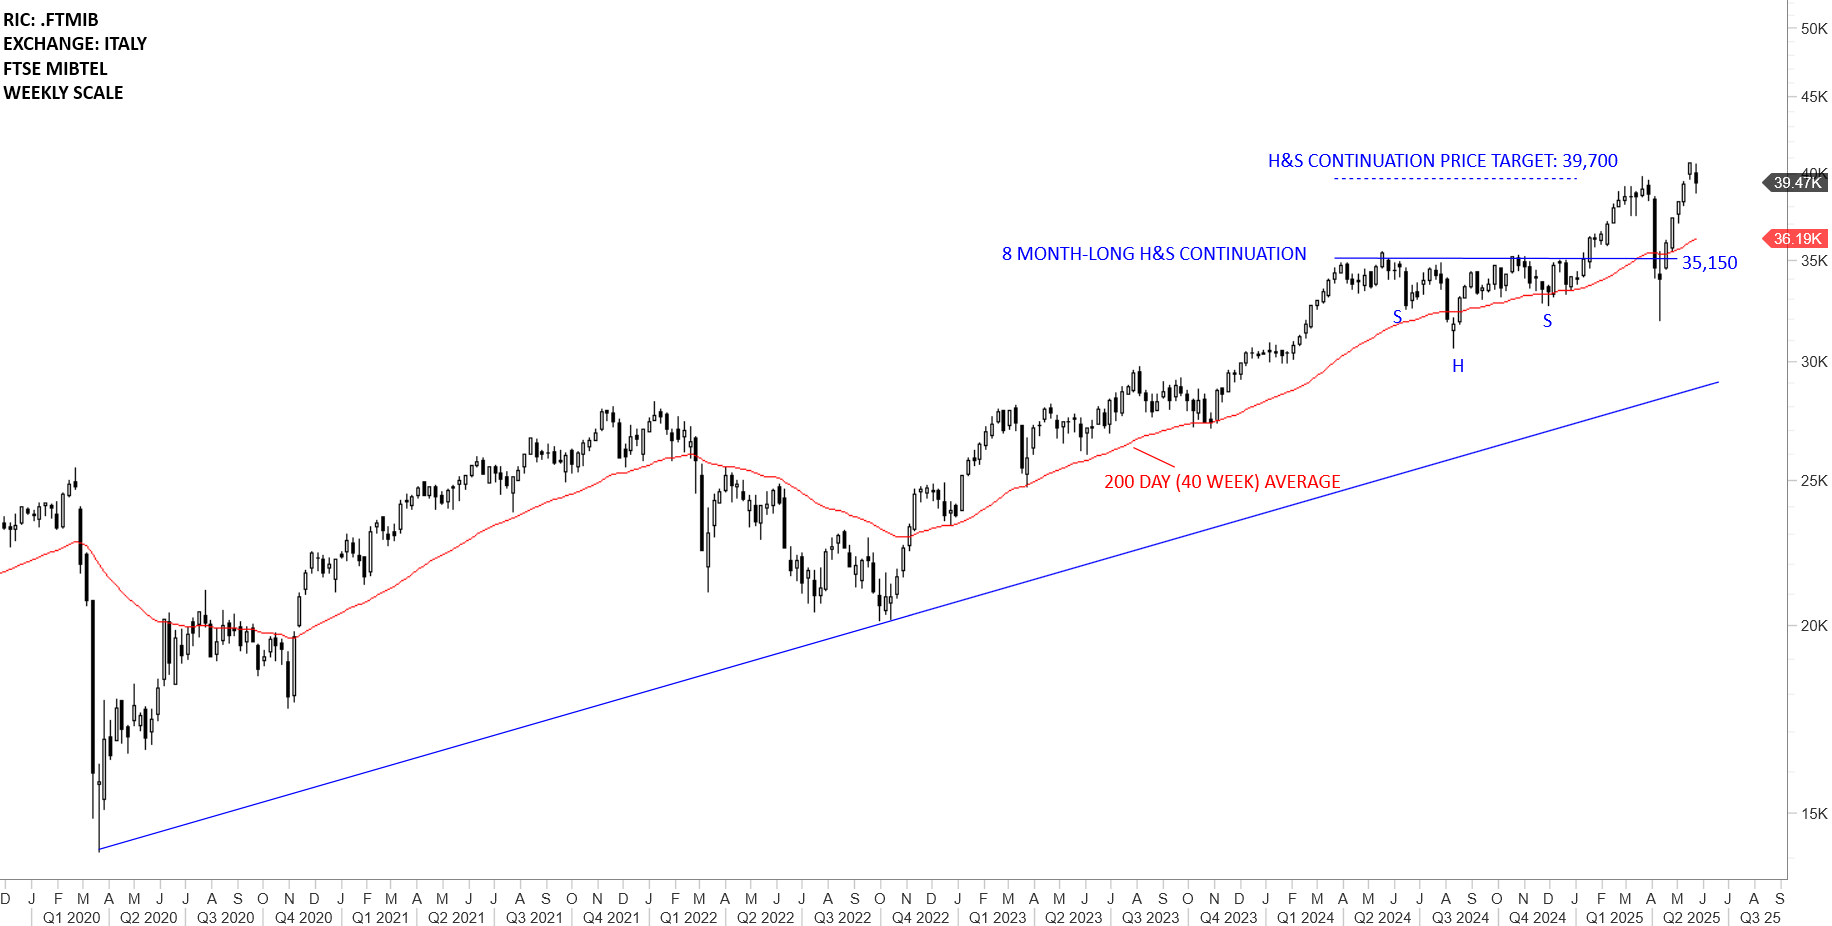
One of the better looking European equity benchmark after Germany’s DAX index is Italy’s FTSE MIBTEL. The benchmark completed an 8 month-long H&S continuation chart pattern with the neckline at 35,150 levels. The 200-day (40 week) average has been an important support since the beginning of 2023. Breakout above 35,150 levels pushed the index towards the target at 39,700 levels. Uptrend is intact. Given the magnitude of the recent rebound, the index can take a breather around the previous high either as a short pullback or sideways consolidation.
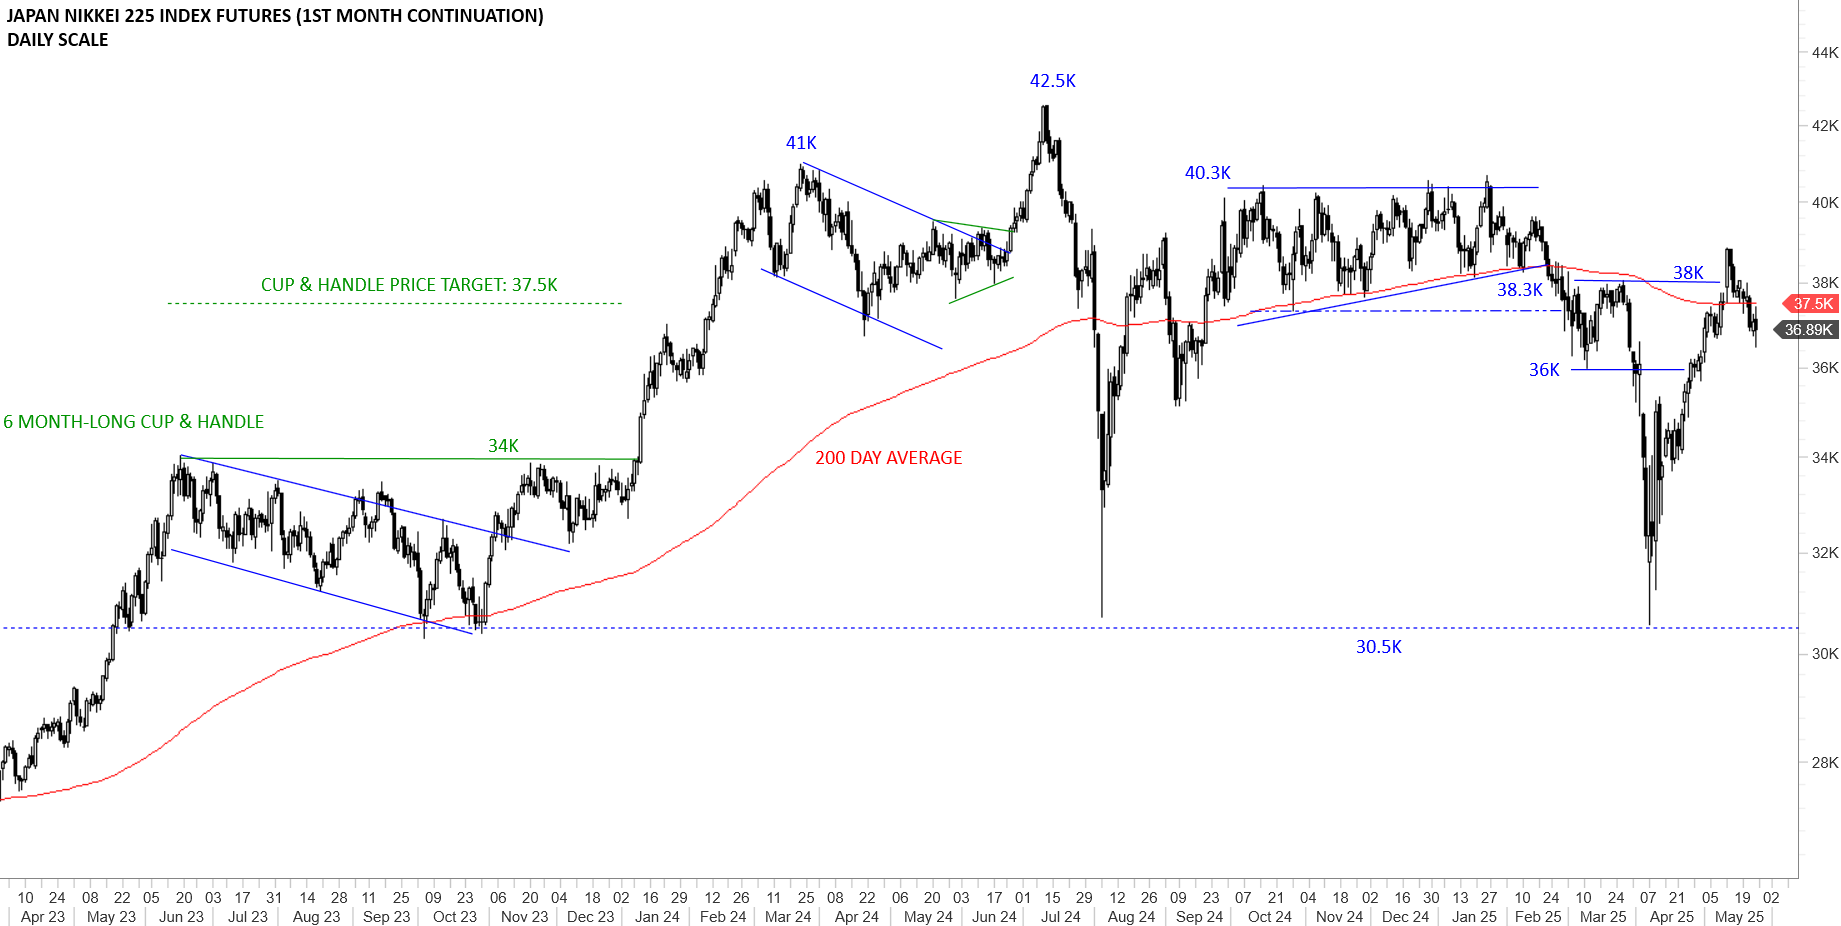
Japan’s NIKKEI 225 index breached the 200-day average and resulted in a sell-off towards support around 30.5K. Sharp rebound cleared the March low at 36K and reached 37.5K, the 200-day average resistance. The 200-day average at 37.5K can act as support and result in a short pause after the strong rebound. We will start discussing the bullish outlook for the Japanese index as the price stabilizes above the year-long average. I’m monitoring the chart for a possible higher low and a tight consolidation around the 200-day average as part of a bullish setup.
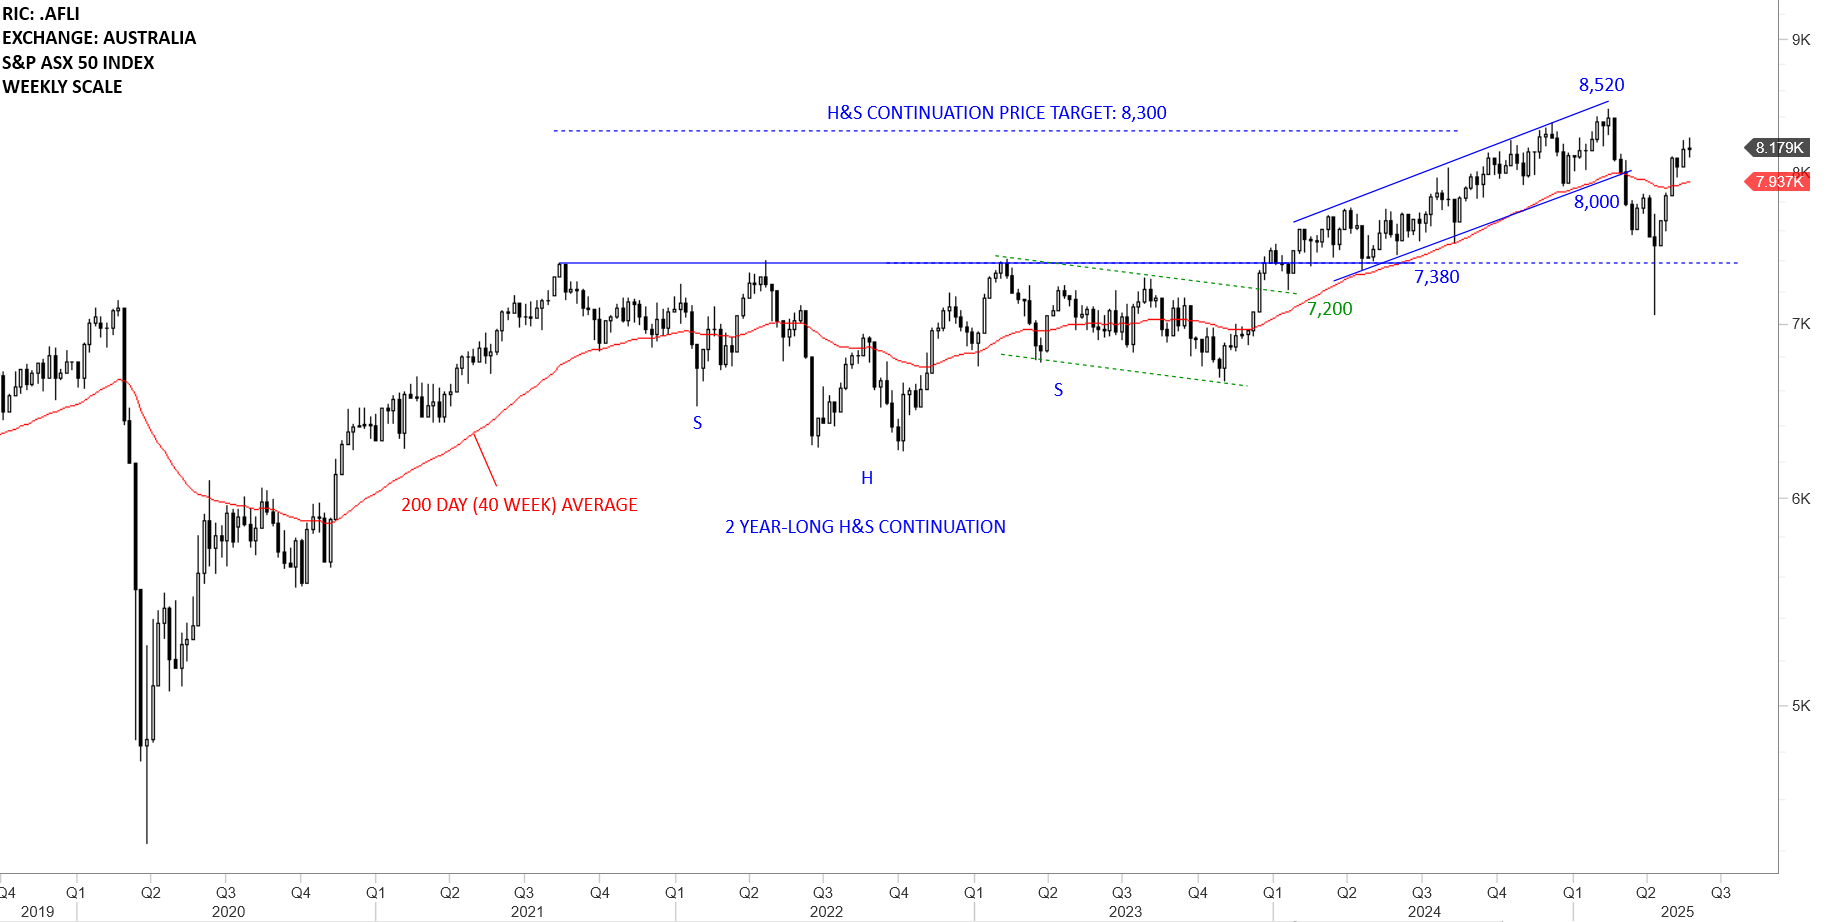
Australia S&P ASX 50 Index reached the H&S continuation price target at 8,300 levels. Following the sharp sell-off and the re-test of 7,380 levels the index recovered above its 200-day average with a strong weekly candle and put the ASX into bullish territory. It will be important for the index to stabilize above its year-long average at 7,937 for the bullish outlook to remain intact.
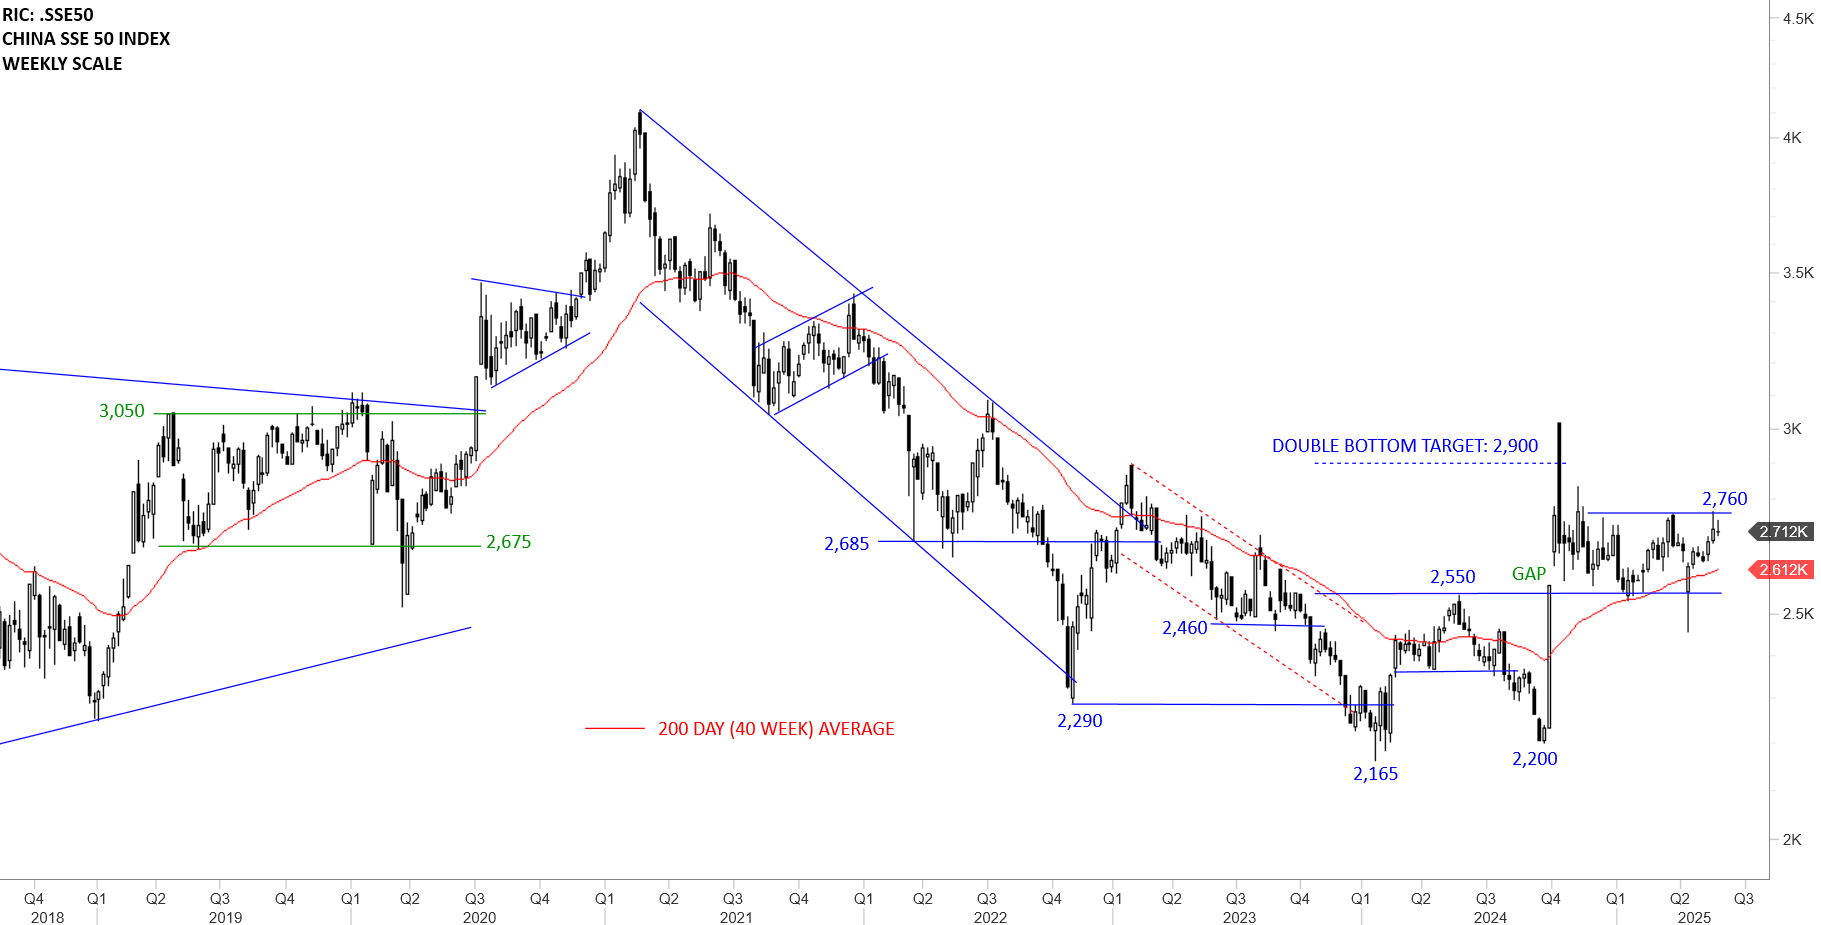
China SSE 50 Index has been in a steady downtrend over the past several years. The index completed a double bottom with the neckline at 2,550 levels. Double bottom price target was met at 2,900 levels. Previous resistance at 2,550 is acting as the new support. Rebound from current levels is offering buying opportunity for China equities. 200-day average and the horizontal support are overlapping around the same level forming an inflection point. It will be important for the index to hold above 2,550 levels. Failure to hold above 2,550 levels can push price lower towards the next support at 2,200 levels. Breakout above the horizontal resistance at 2,760 levels can accelerate the upward price action.
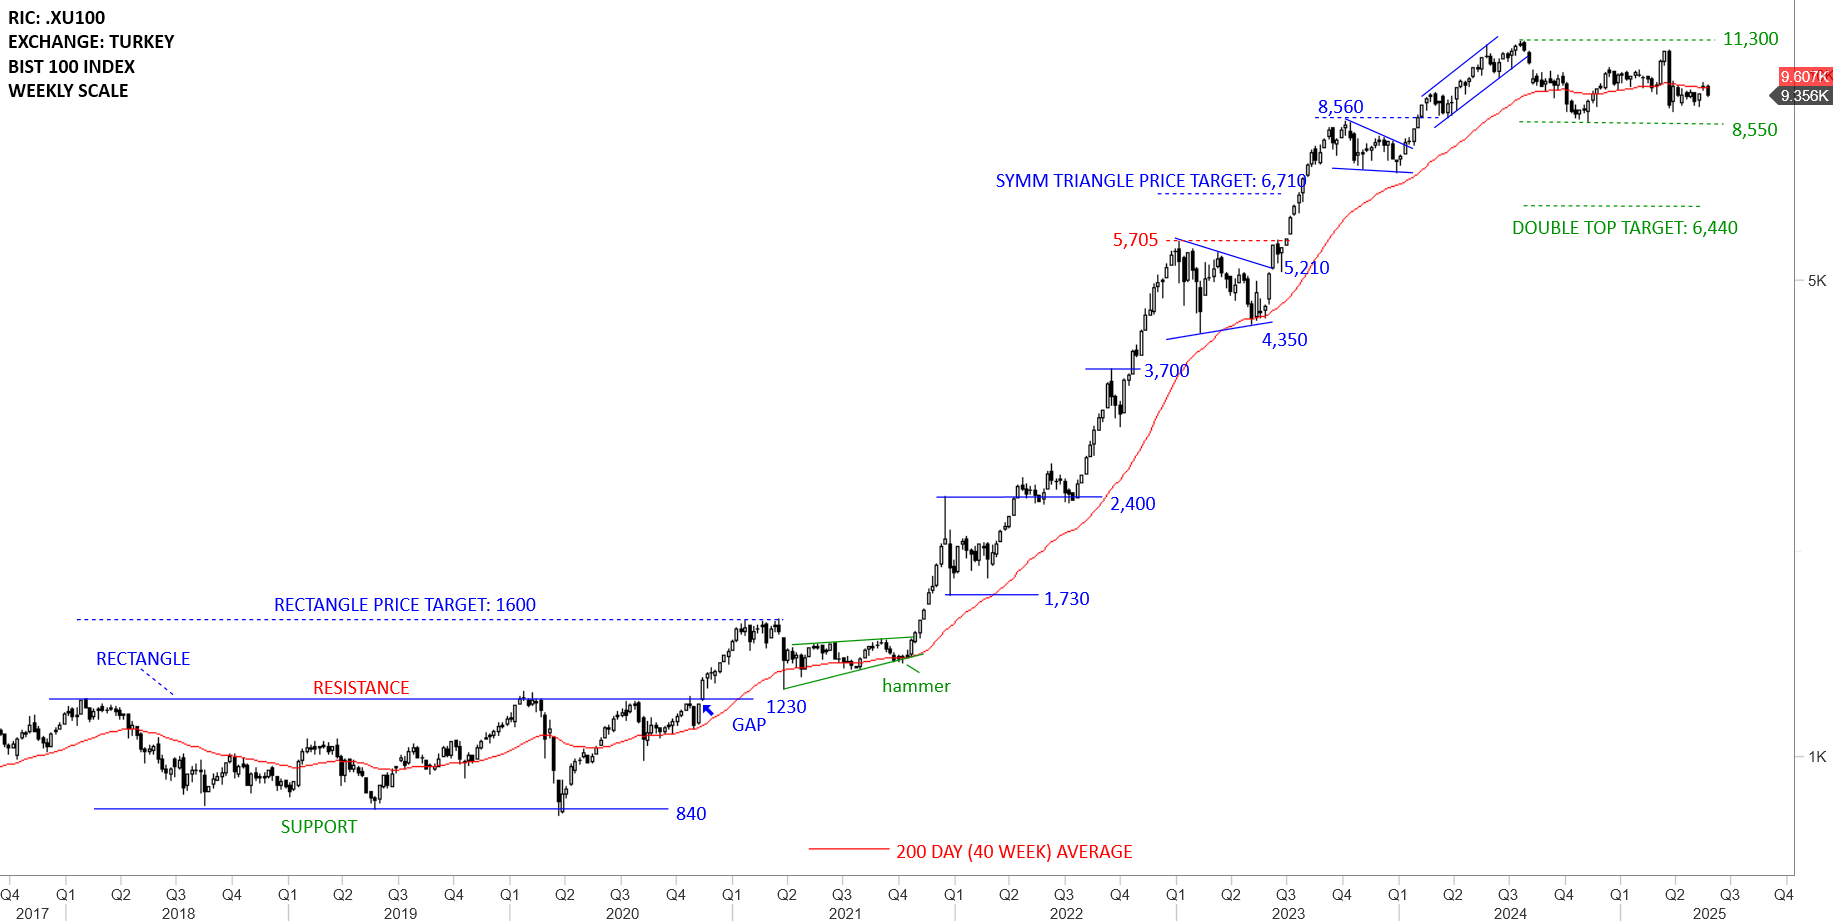
BIST 100 is possibly forming a wide consolidation between 8,550 and 11,300. A long-term bearish signal will take place if the index breaks down the support at 8,550 levels. Breakdown below 8,550 levels can complete the rectangle as a double top with the price target of 6,440 levels. For now the index is consolidating in a wide trading range between 8,550 and 11,300 levels. Recovery above the year-long average can push the index towards the upper boundary at 11,300 levels.
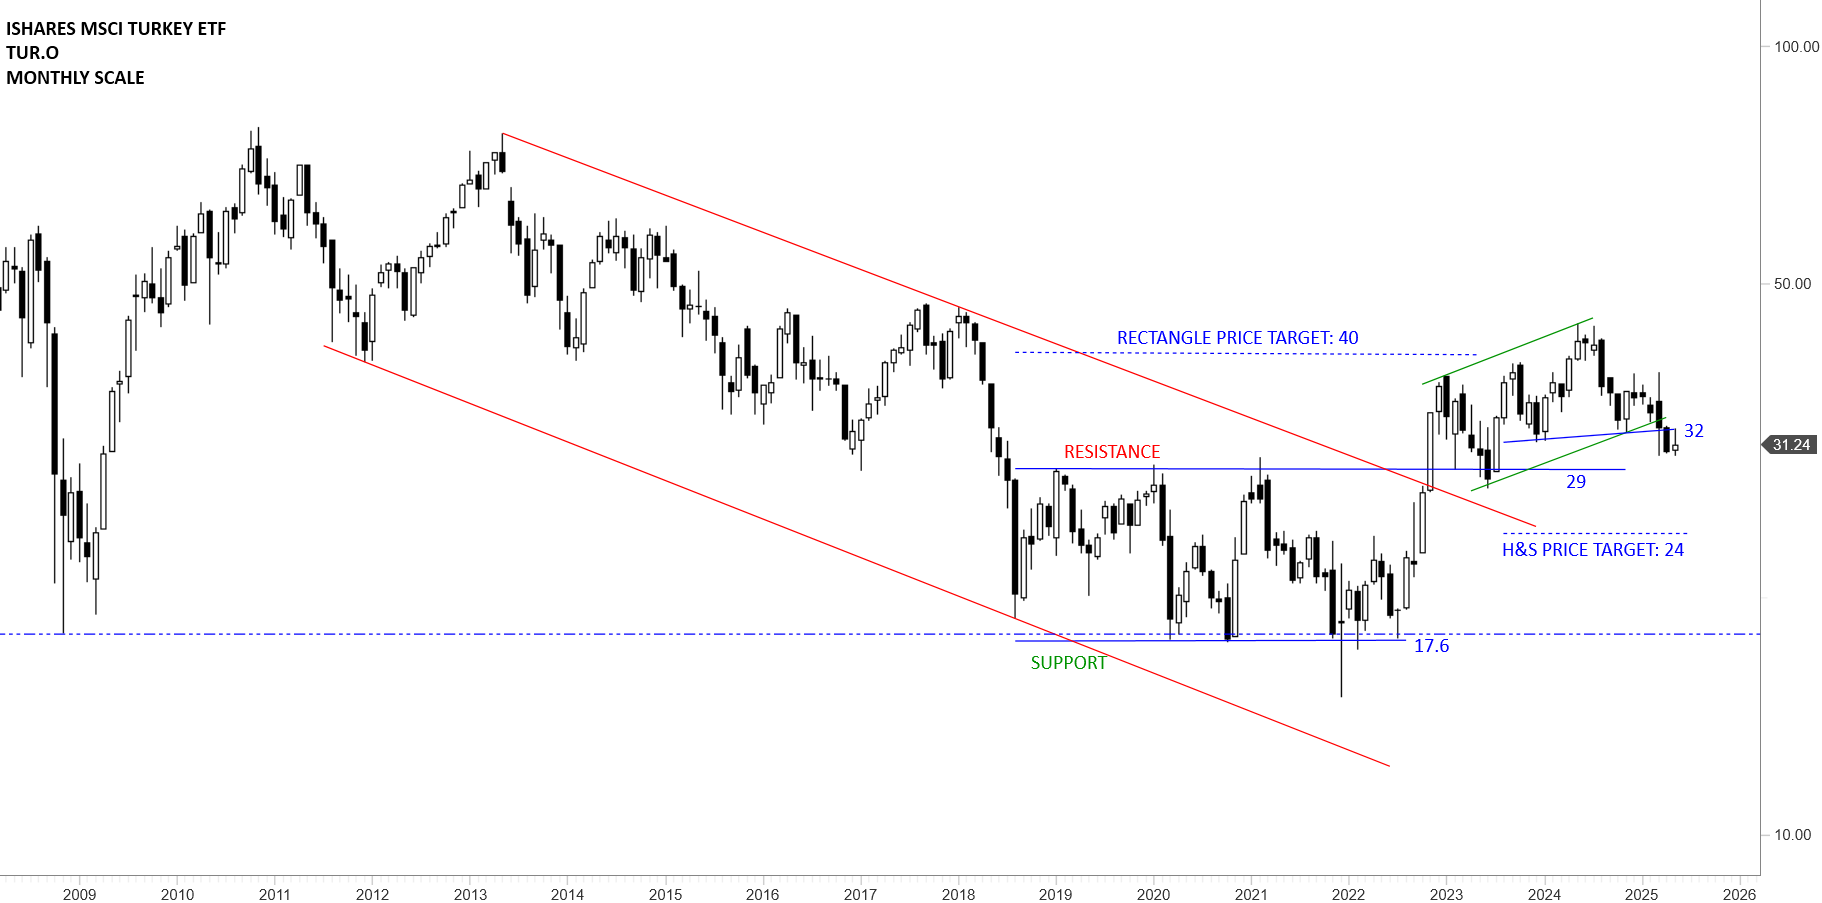
The Ishares MSCI Turkey ETF’s monthly close below 32 levels completed a H&S top reversal with the price target of 24 levels. The ETF had several opportunities to remain in an upward trend channel and resume higher. Instead, weakness continued to challenge the lower boundary and now with the completion of a possible top reversal neckline at 32 levels becomes the new resistance. The ETF needs to recover back inside the green trend channel to change the outlook to positive.
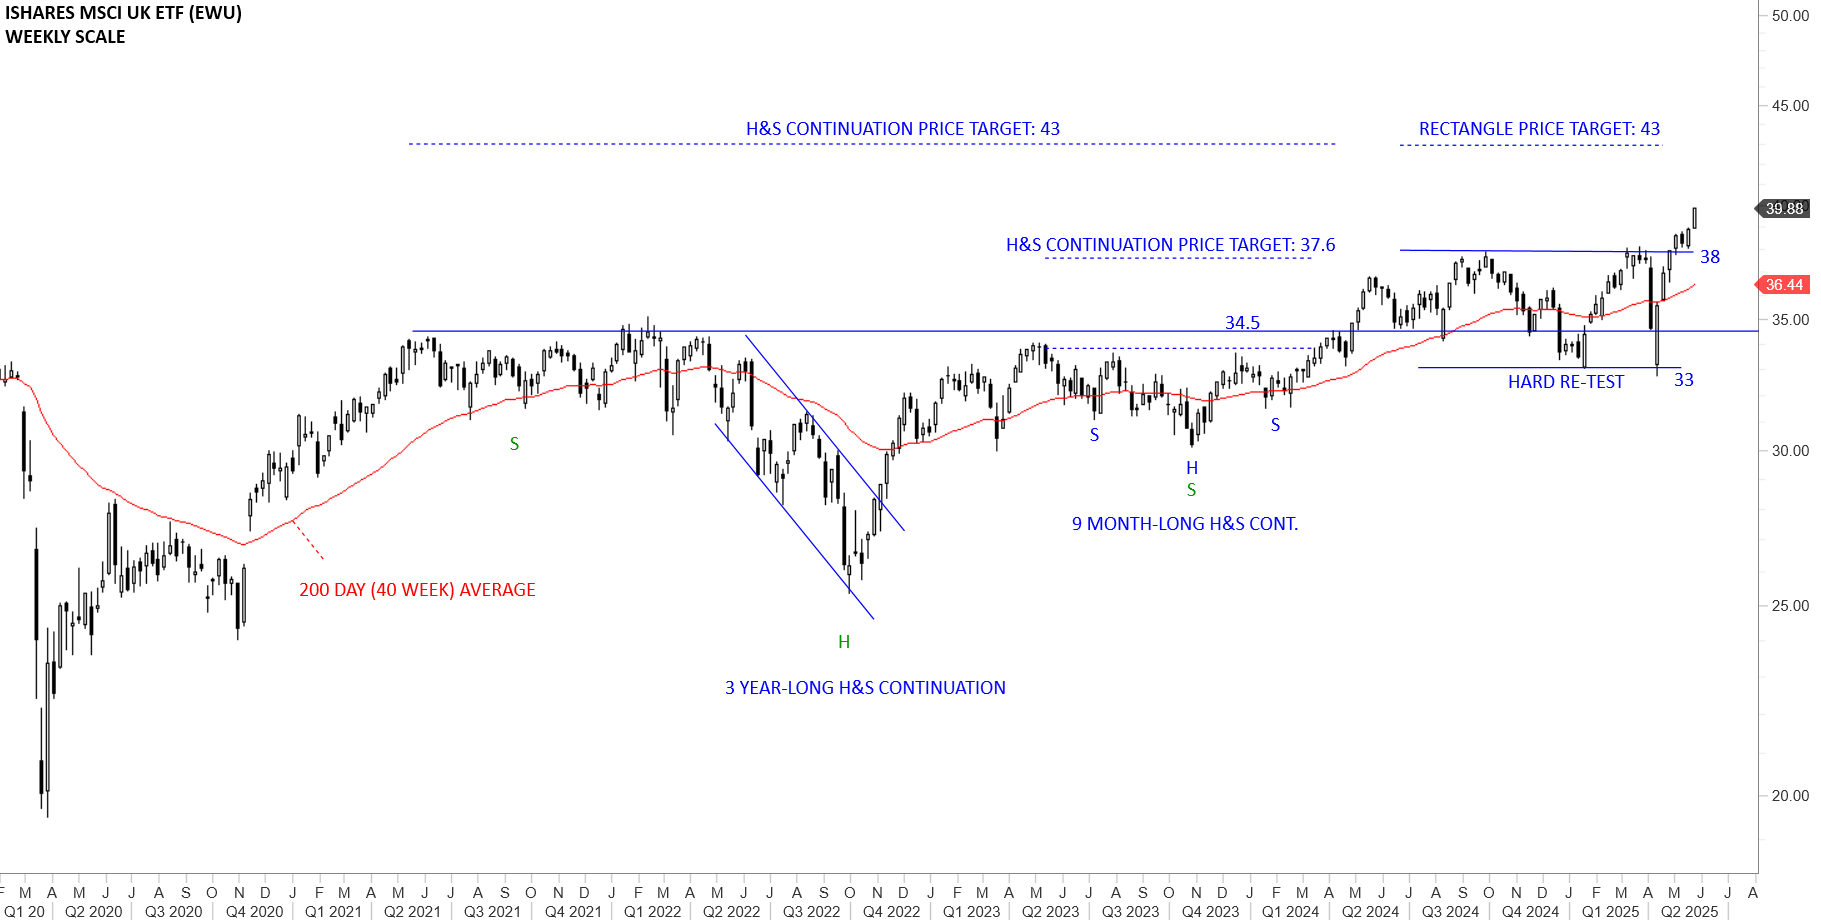
The correction towards 34.5 levels in the beginning of the year was a hard re-test for the 3 year-long H&S continuation. With April’s sharp correction price once again tested and rebounded from the strong horizontal support. The ETF completed a sideways consolidation between 33 and 38 levels. Price target for the rectangle stands at 43 levels. Previous resistance at 38 becomes the new support.
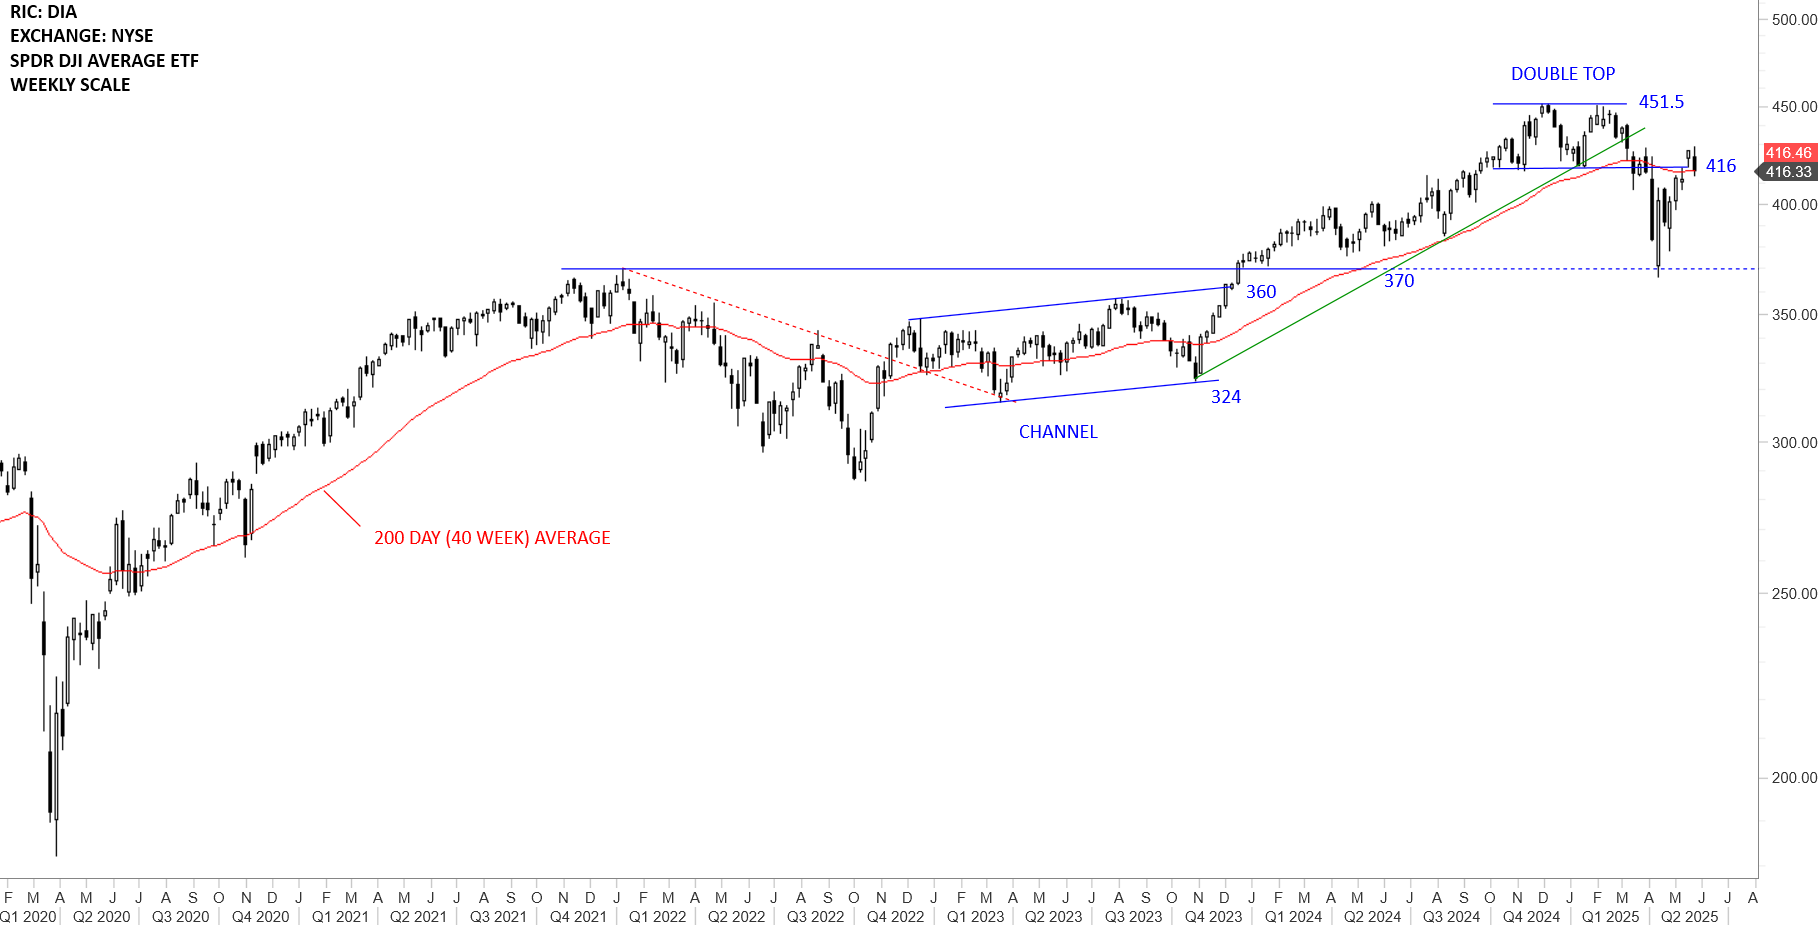
DIA rebounded from the strong support at 370 levels. 416 levels acted as the resistance. Outlook turns bullish with last week’s recovery above the year-long average. Both the year-long average and the horizontal resistance are forming inflection point at 416 levels. 416 levels becomes the short-term support. Continued strength can target the next resistance at 451.5 levels. Consolidation around the 200-day average can form a short-term chart pattern that can offer insight for the direction of the developing trend.
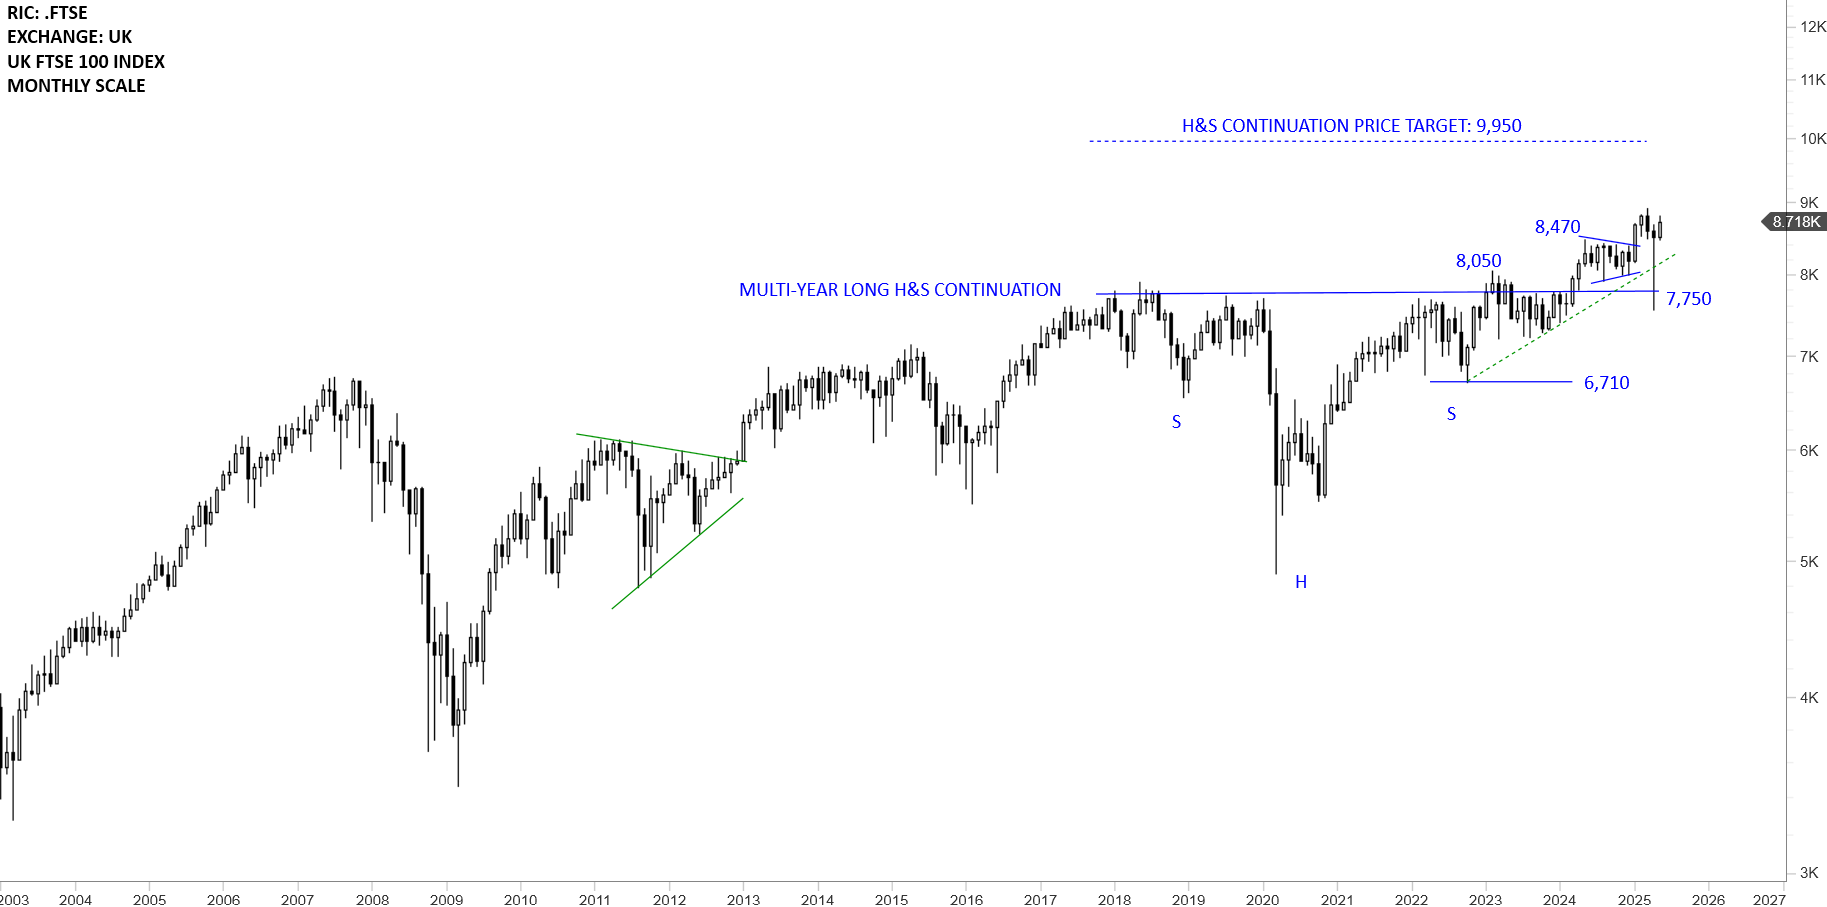
The long-term price chart of UK FTSE 100 Index is completing the multi-month long H&S continuation chart pattern. The horizontal resistance was the neckline at 7,750 levels. This is a monthly scale price chart. Outlook is still positive for UK equities. 7,750 levels continue to be an important support. Sharp rebound keeps the uptrend intact.
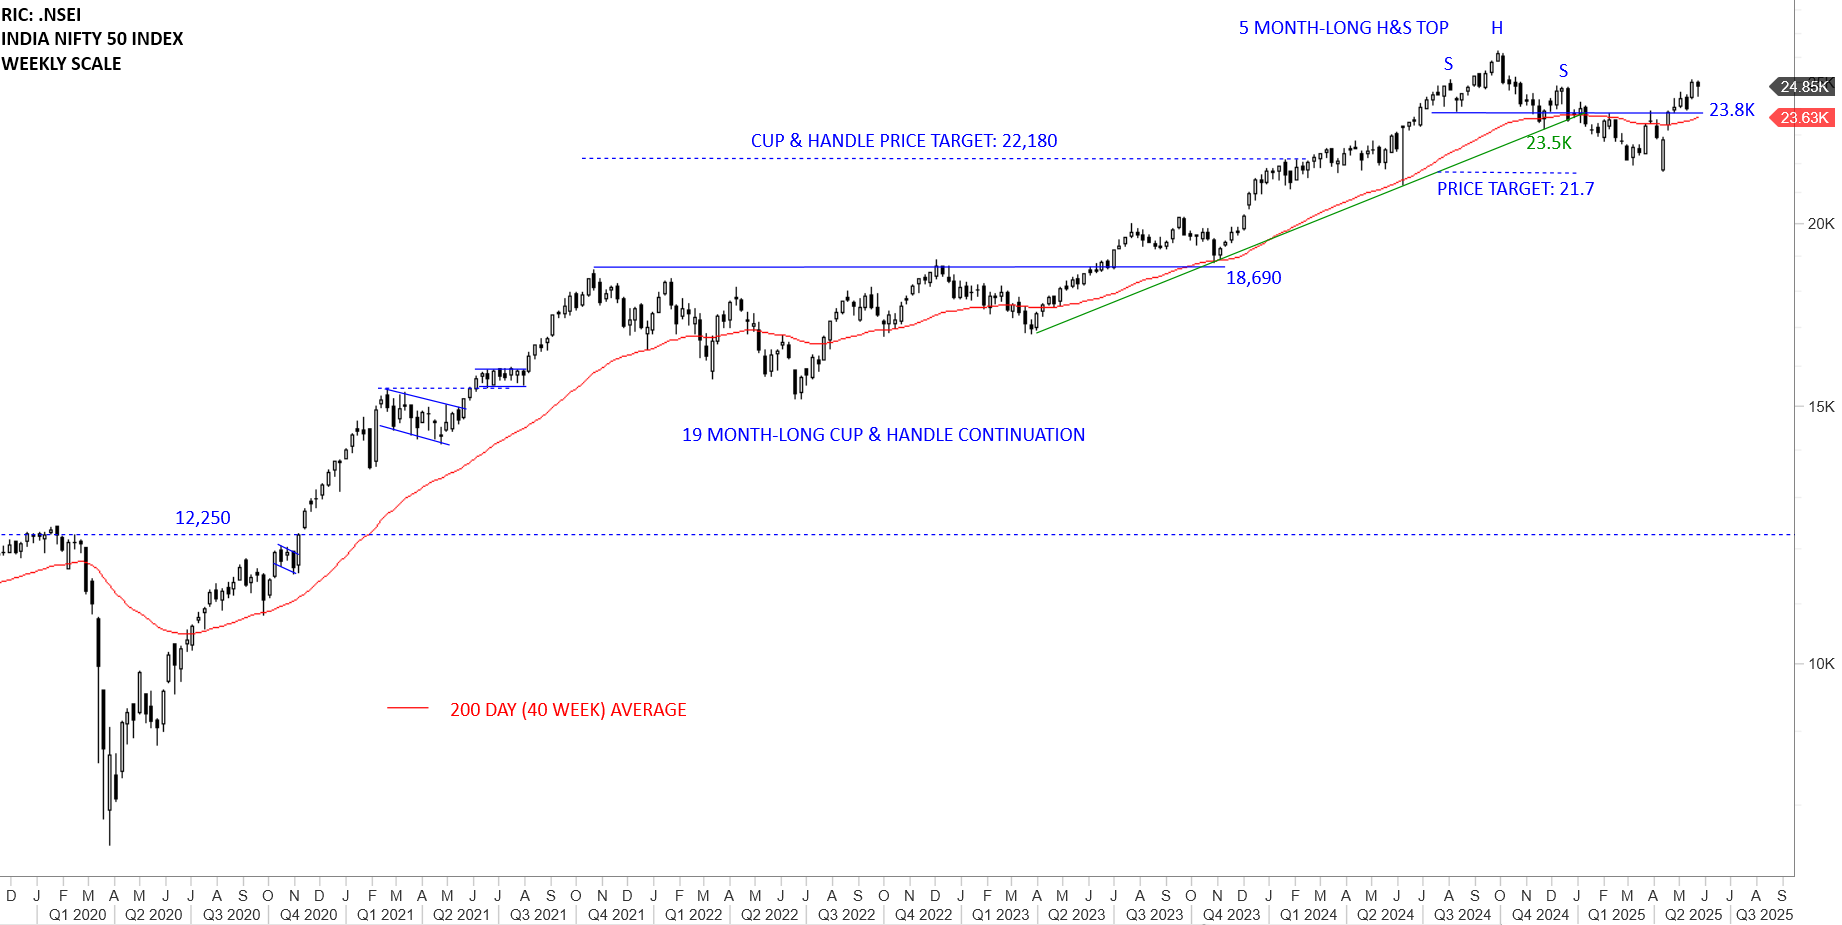
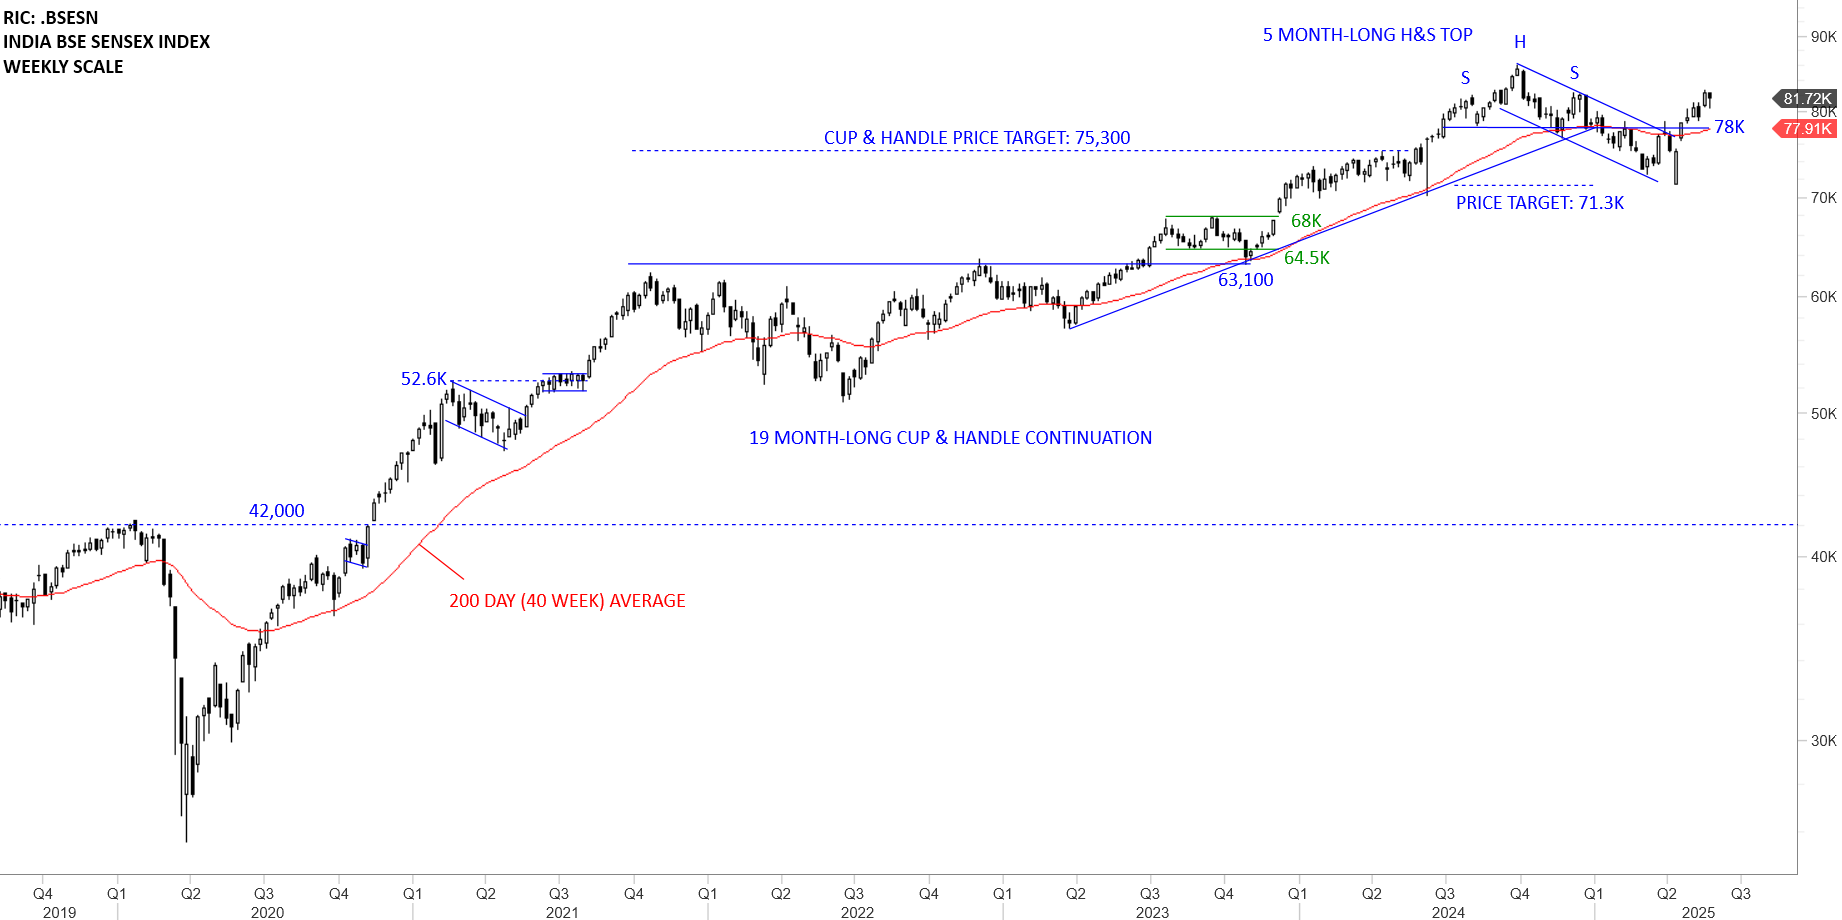
Breakdown of the neckline at 78K for SENSEX resulted in a downtrend towards 71.3K. For Nifty 50 the H&S top price target stood at 21.7K. Both benchmarks came very close to their pattern objectives. A strong weekly close above 23.8K for Nifty 50 was bullish for the index as it recovered above the neckline and the year-long average. Likewise the weekly close above 78K is considered positive price action for Sensex. It will be important for both benchmarks to stabilize above their long-term averages for the bullish outlook to remain intact.
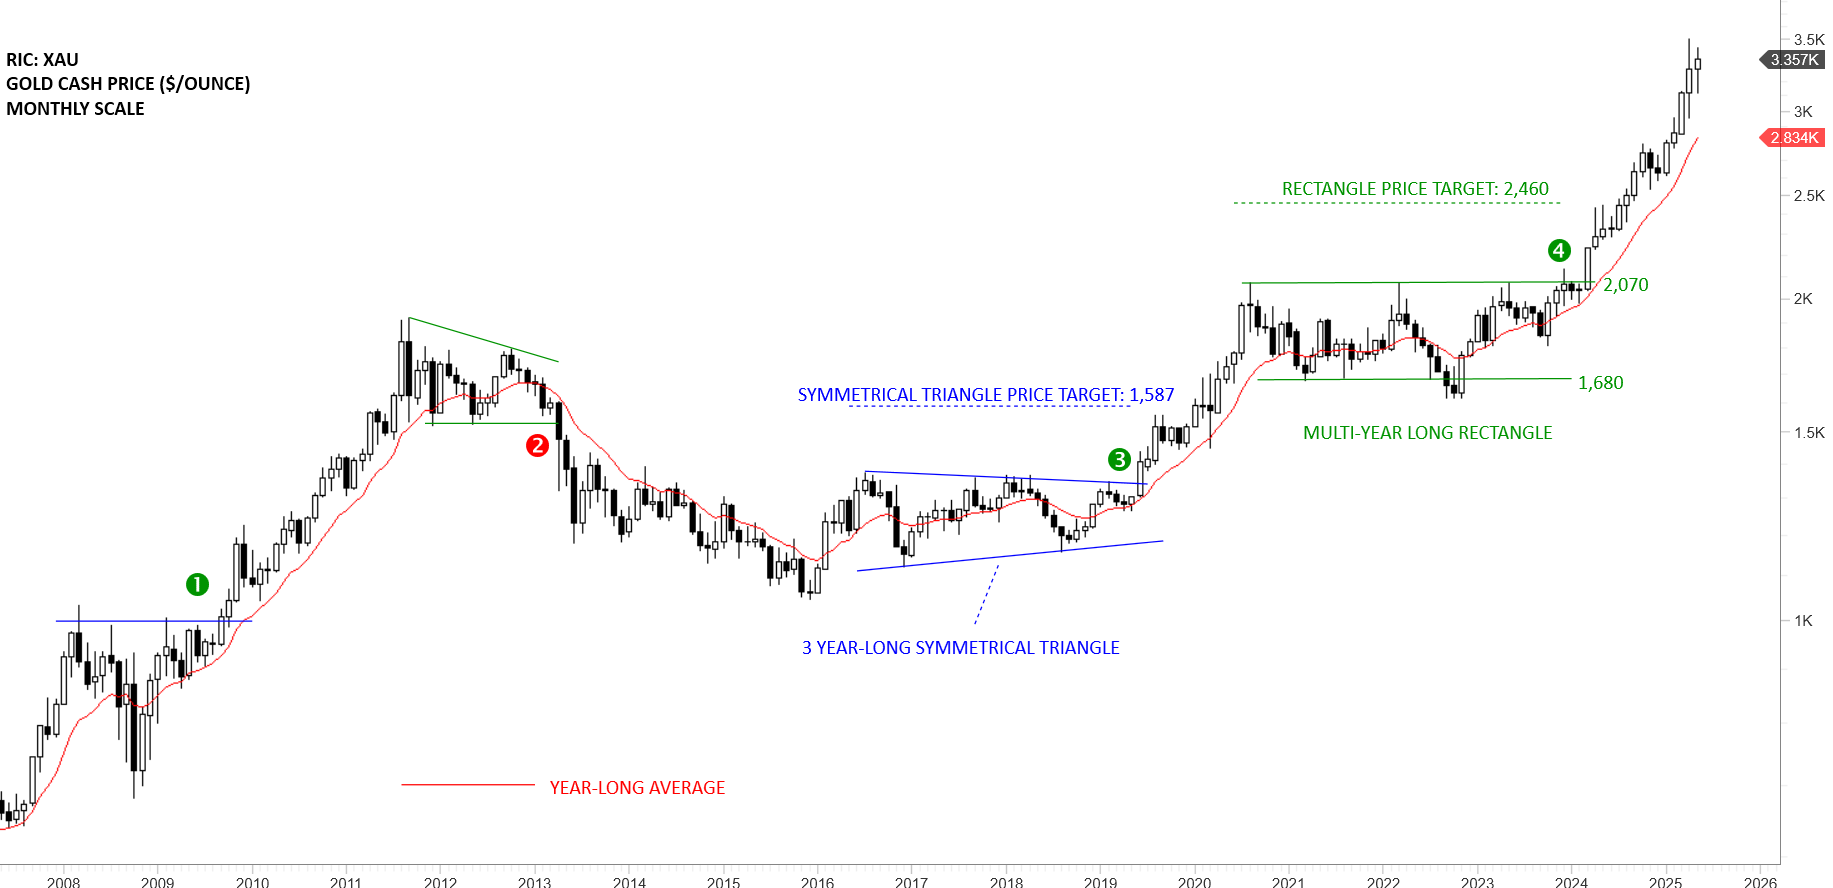
Breakout above 2,070 levels completed a multi-year long rectangle with the price target of 2,460 levels. Given that we are analyzing a monthly scale chart, March 2024 breakout was confirmed with a strong monthly close above the resistance. It is important to note that due to the length of the recent consolidation (multi-year long), breakout possibly started a multi-month long trend. Previous resistance at 2,070 levels becomes the new support. This is considered to be a Type 1 breakout on monthly scale. Type 1 breakouts rally to price objective without any pullback. They usually extend beyond price objective. Price action has become parabolic (steep advance) and the recent weakness/pause comes after the strong advance.
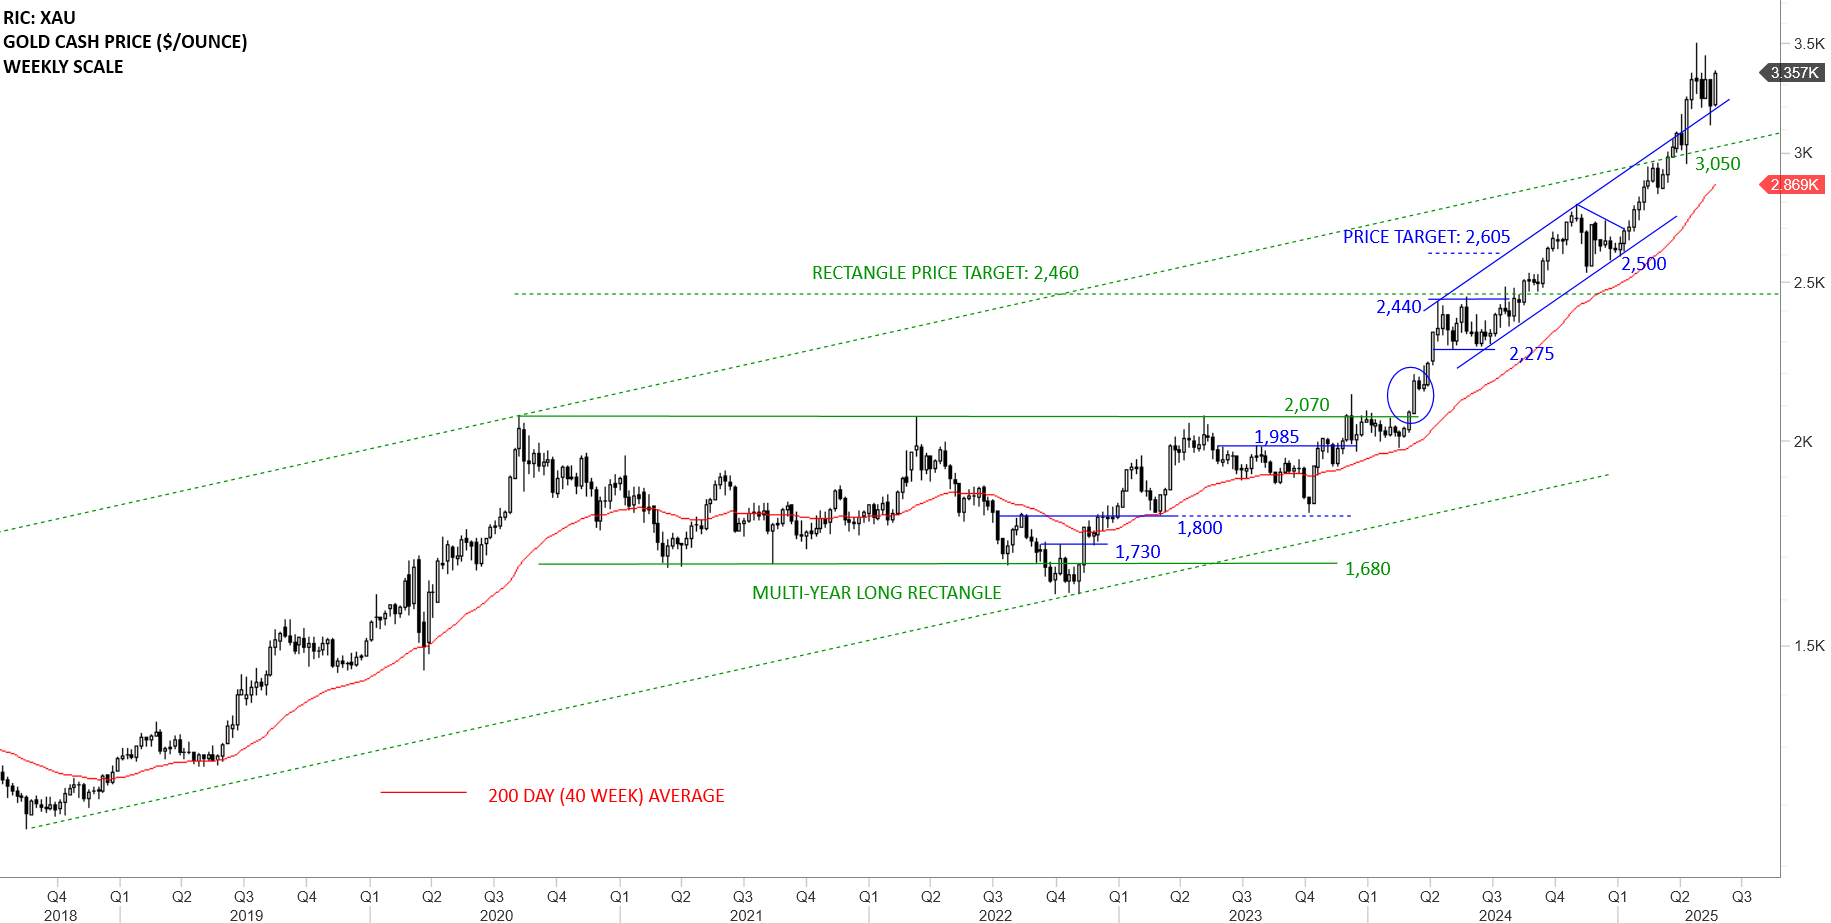
Since the beginning of 2023 Gold has been in a steady uptrend above its 200-day average. Long-term trading range between 1,680 and 2,070 completed with the strong breakout. Rectangle price target was met at 2,460 levels. The 200-day moving average is acting as support at 2,869 levels. Upper boundary of the long-term channel at 3,060 levels was breached with last few week’s strength. Breakout above the upper boundary of a rising channel (3,060 levels) accelerated the uptrend. Price action became parabolic with longer weekly candles. The Doji candlestick signaled a balance between buyers and sellers. Possible “pause in uptrend”. The pullback found support above the upper boundary of the rising trend channel. Uptrend is intact. The best way to stay in the existing trend and still protect profits in case of a reversal is to utilize trend following tools such as moving averages or trailing ATR. The weekly scale chart formed a doji candlestick as it reached 3,500 levels. (Here you can find discussion on ATR trailing stops)
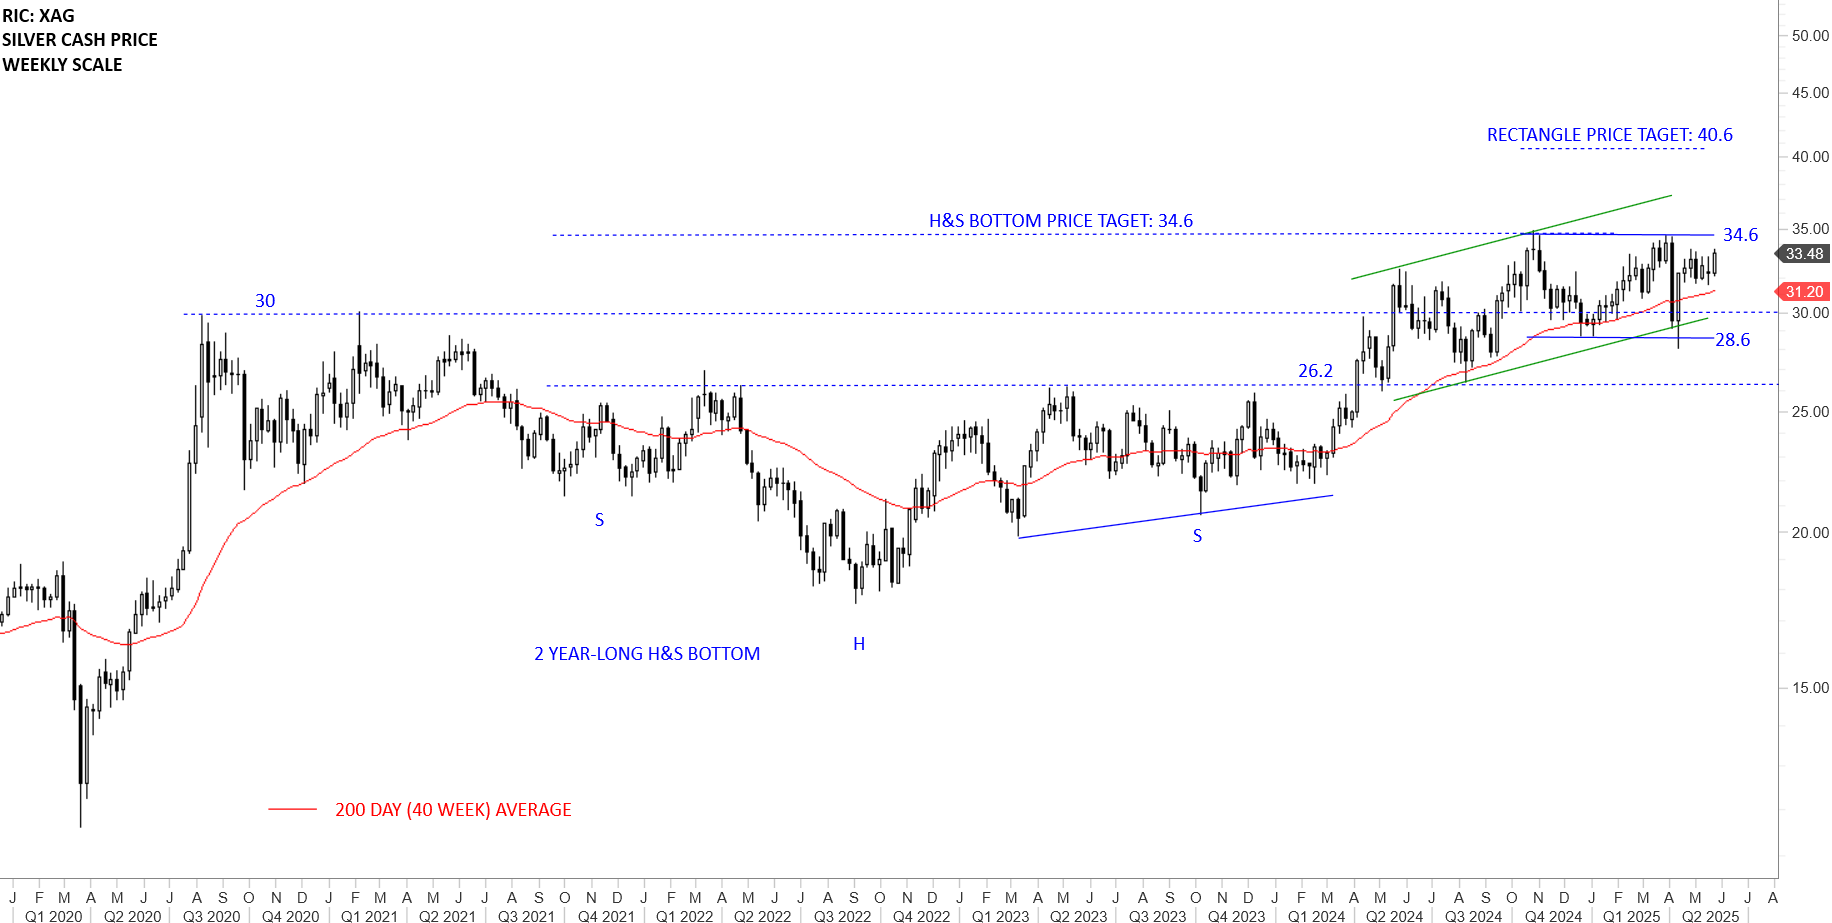
Silver has been the most volatile and with the most frequent false signals between the metals that were discussed in the report. Previous resistance at 26.2 levels and the 200-day average at 31.20 levels are forming an area of support. Price target for the H&S bottom was met at 34.6 levels. Uptrend is intact. It will be important for the price to hold inside the green channel for the uptrend to remain intact. A possible rectangle might be forming between 28.6 and 34.6 levels. Breakout above 34.6 levels can target 40.6.
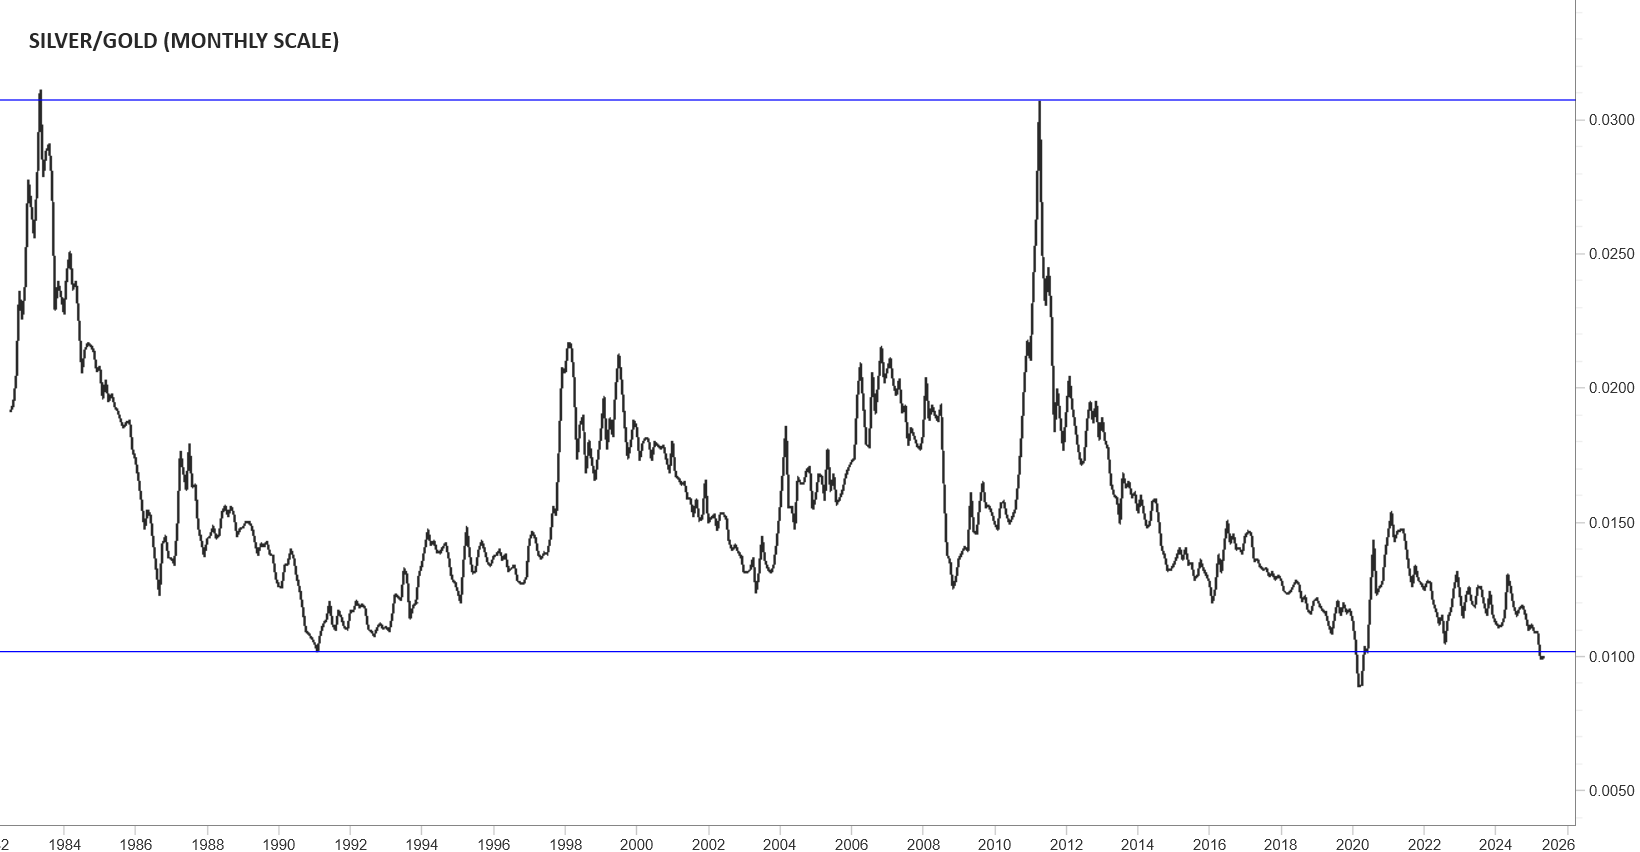
The chart below shows the historical SILVER/GOLD ratio. The ratio after reaching its historical resistance in 2011, is now testing the long-term support. If any outperformance for Silver is going to take place, it is from current levels…
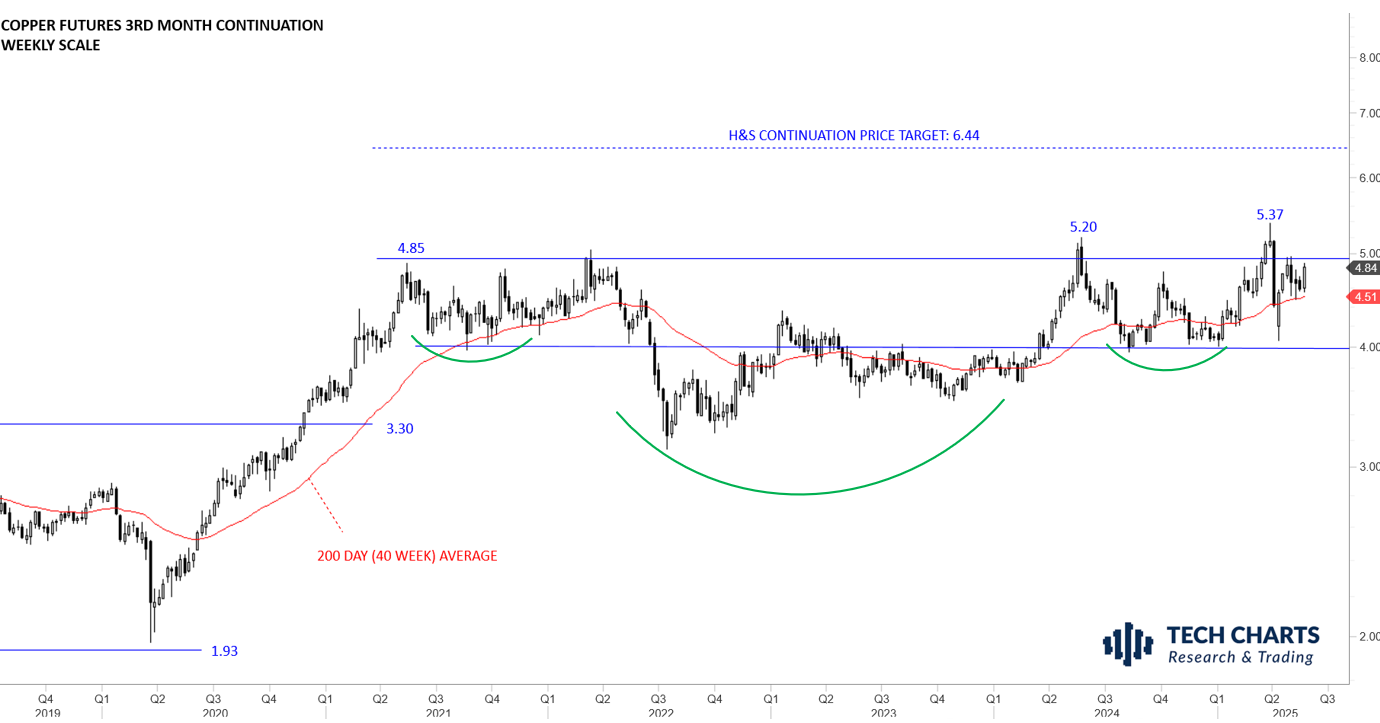
A possible long-term H&S continuation might be forming with the neckline at 4.85 levels. A weekly close above 5.20-5.37 resistance area can confirm the long-term H&S continuation breakout. Price failed to close above 5.20 on a weekly basis for a breakout confirmation, though the bullish chart pattern is still not negated. It will be important for the price to hold above the year-long average at 4.51 levels for continued strength.
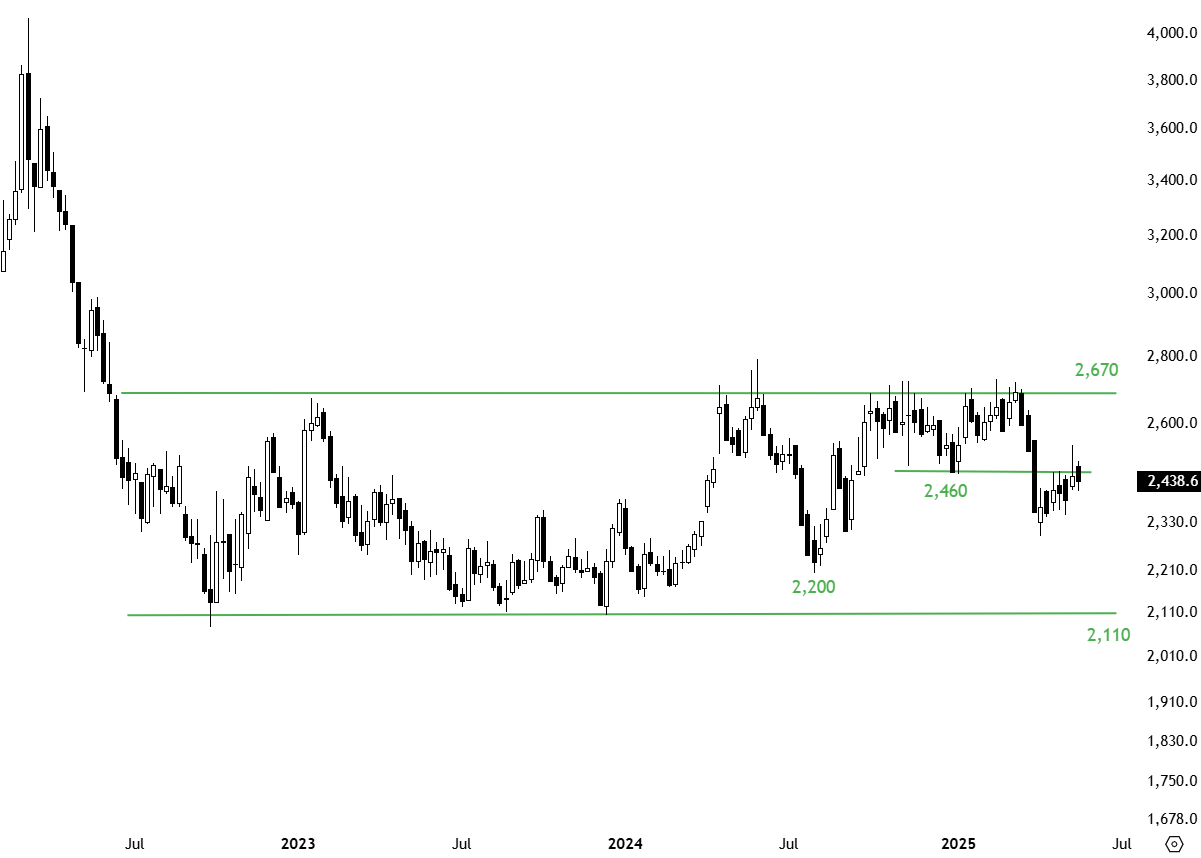
Aluminum futures are forming a multi-year long rectangle. The upper boundary was tested several times around 2,670 levels. Breakdown below 2,460 levels puts the bullish interpretation in question and results in weakness inside the wide rectangle between 2,110 and 2,670 levels. Failure to recover above 2,460 levels can result in a correction towards 2,110-2,200 area. This week’s price action was an attempt to recover above 2,460 though the weekly close was below the horizontal resistance.
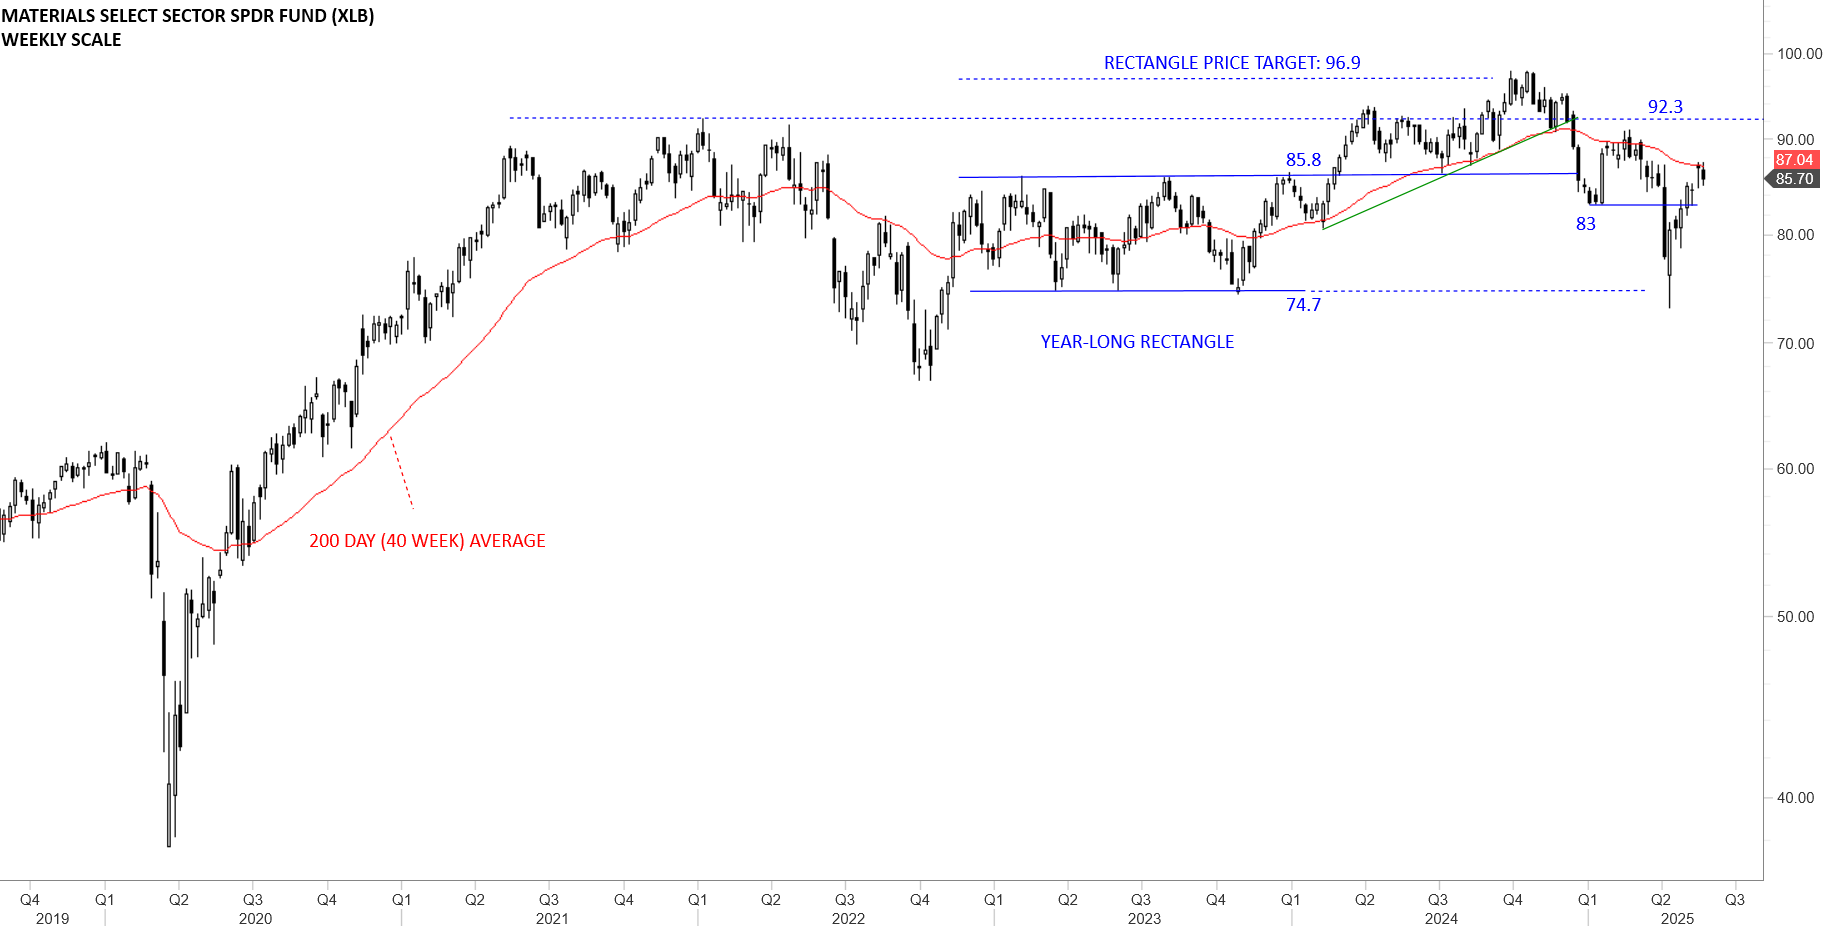
SPDR Materials Select Sector ETF (XLB) broke down the 200-day average and the trend line support. The uptrend is being challenged. 92.3- 87.04 area turns into resistance. Breakdown below 83 levels accelerated the downtrend. Strong support stands at 74.7 levels. Latest rebound started from the support at 74.7 and reached the 200-day average at 87.04 levels. Recovery above the long-term average can target 92.3 levels.
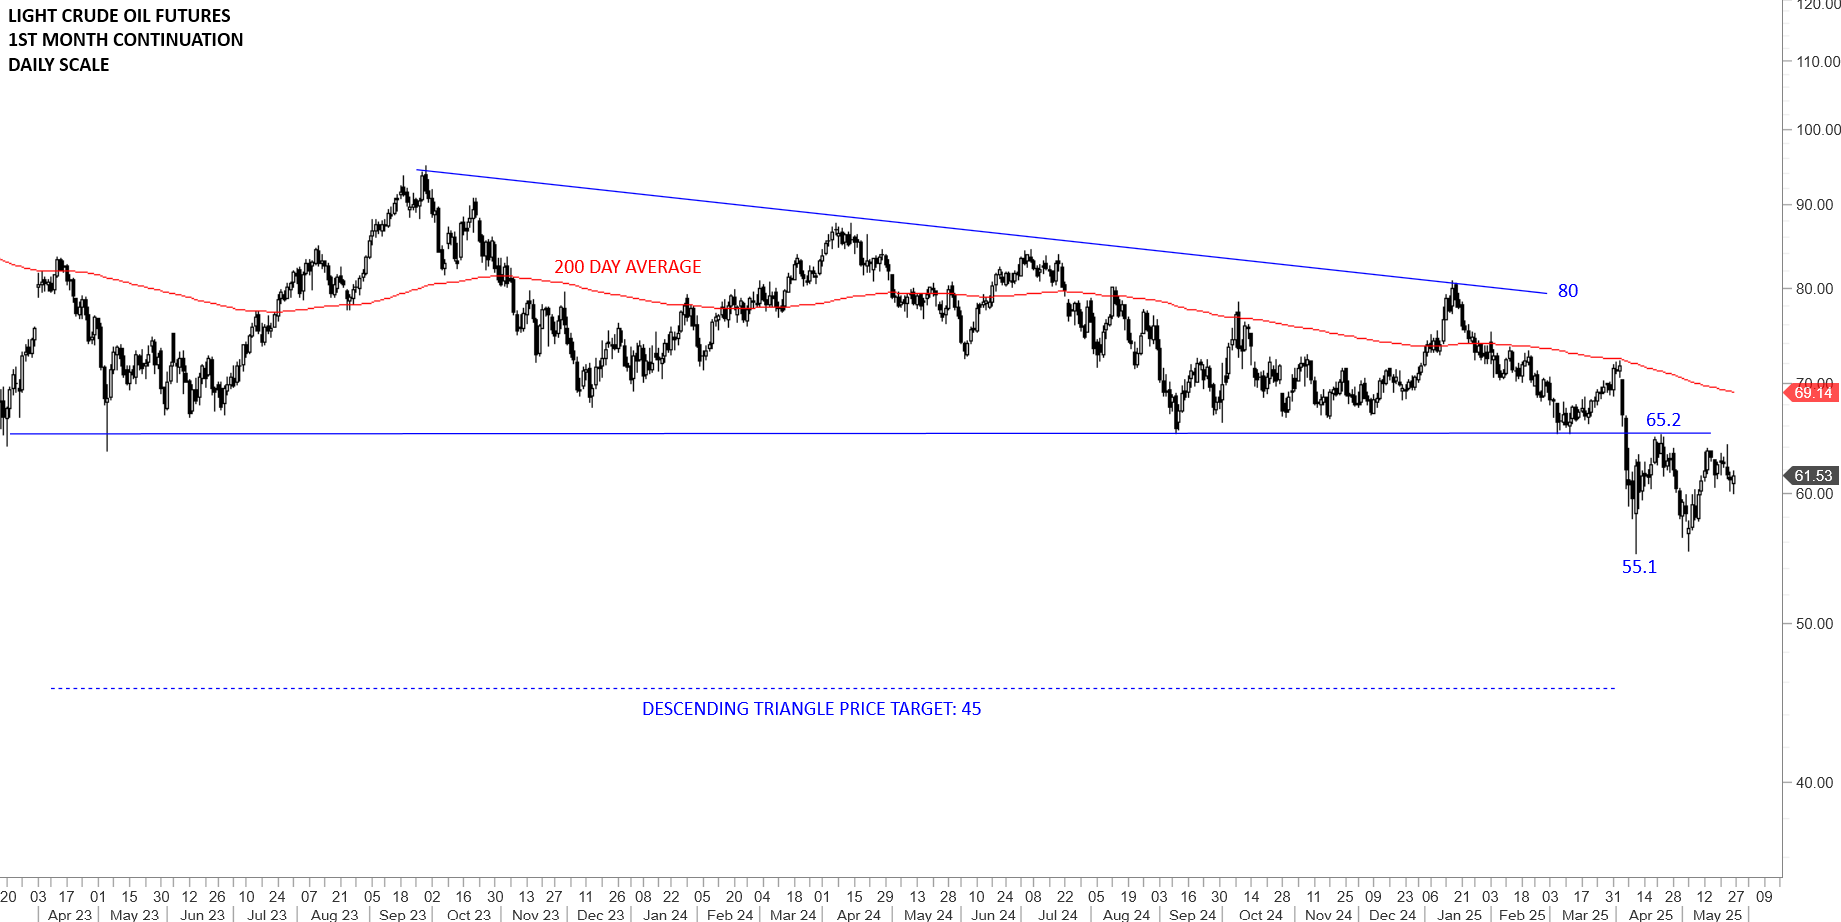
Crude Oil’s long-term pattern confirmed as a descending triangle (bearish chart pattern) with a breakdown below the horizontal support at 65.2 levels. Breakdown can target 45 levels. Horizontal support at 65.2 levels becomes the new resistance. A sharp recovery above 65.2-69.14 area can put the bearish interpretation in question. Breakdown below the minor low at 55.1 levels can accelerate the downtrend. I’m monitoring the strength of the recent rebound. Failure to challenge the resistance at 65.2 will be a weak rebound and suggest lower levels in the coming weeks.
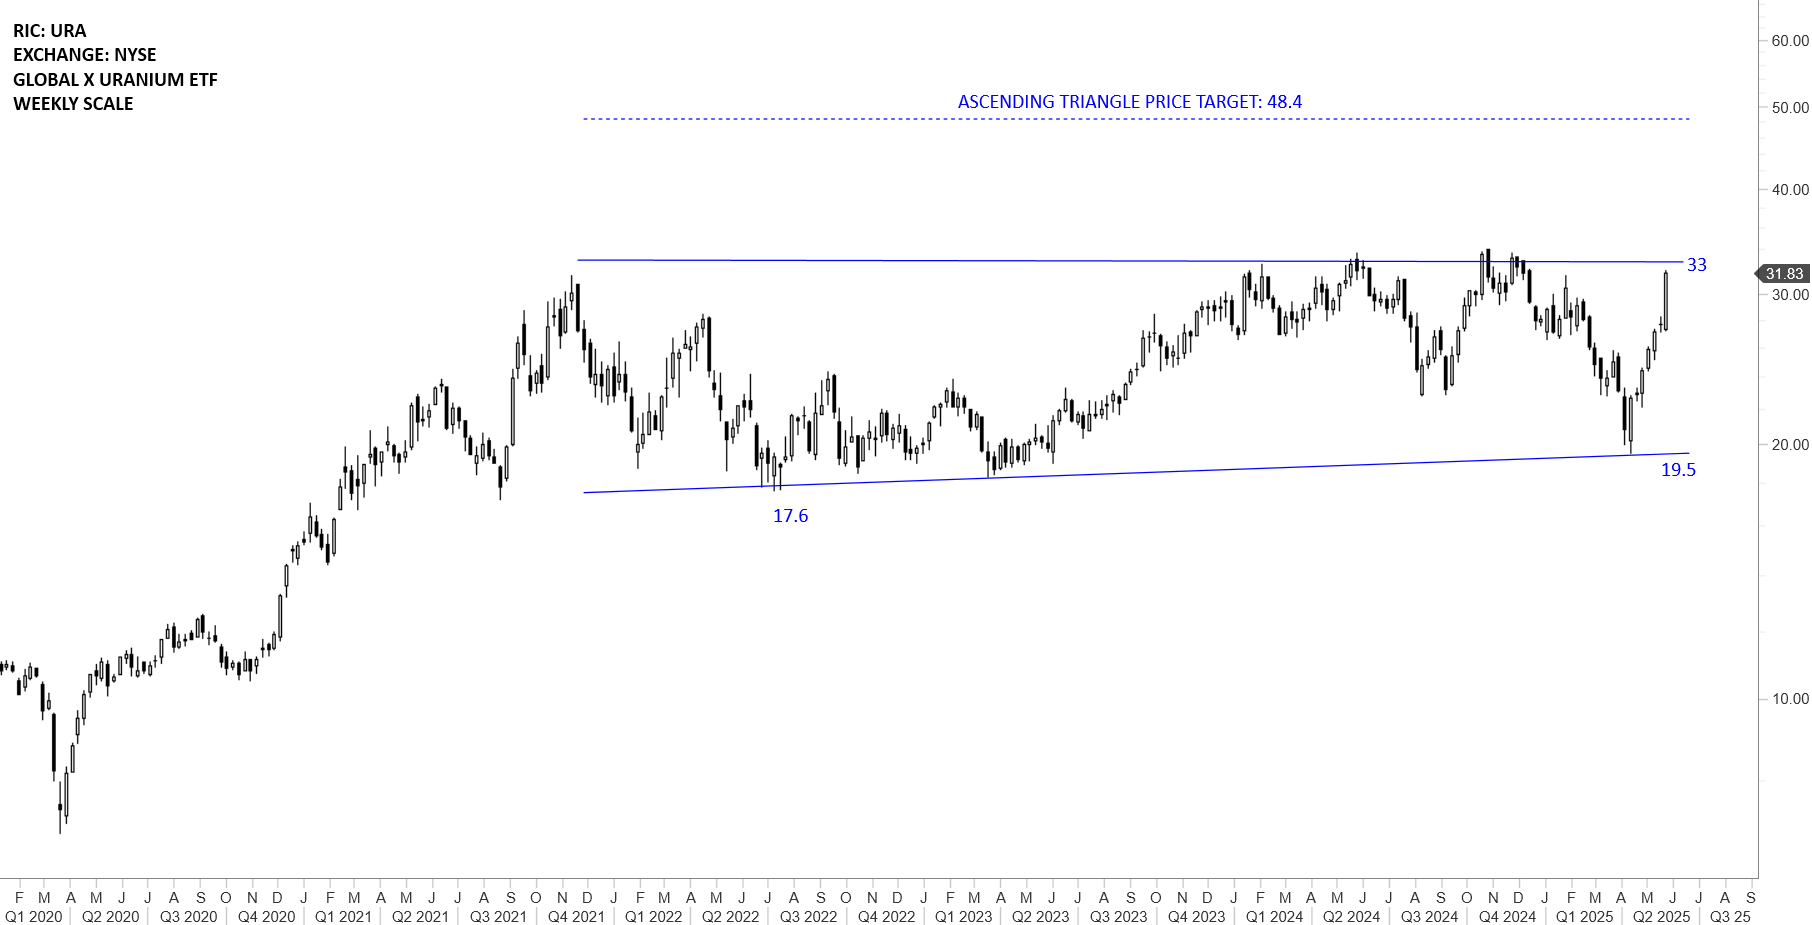
Global X Uranium ETF (URA) is possibly forming a larger scale ascending triangle. The price is in a wide trading range between 19.5 and 33 levels. Breakout above 33 levels can complete a multi-year long ascending triangle with the price target of 48.4 levels.
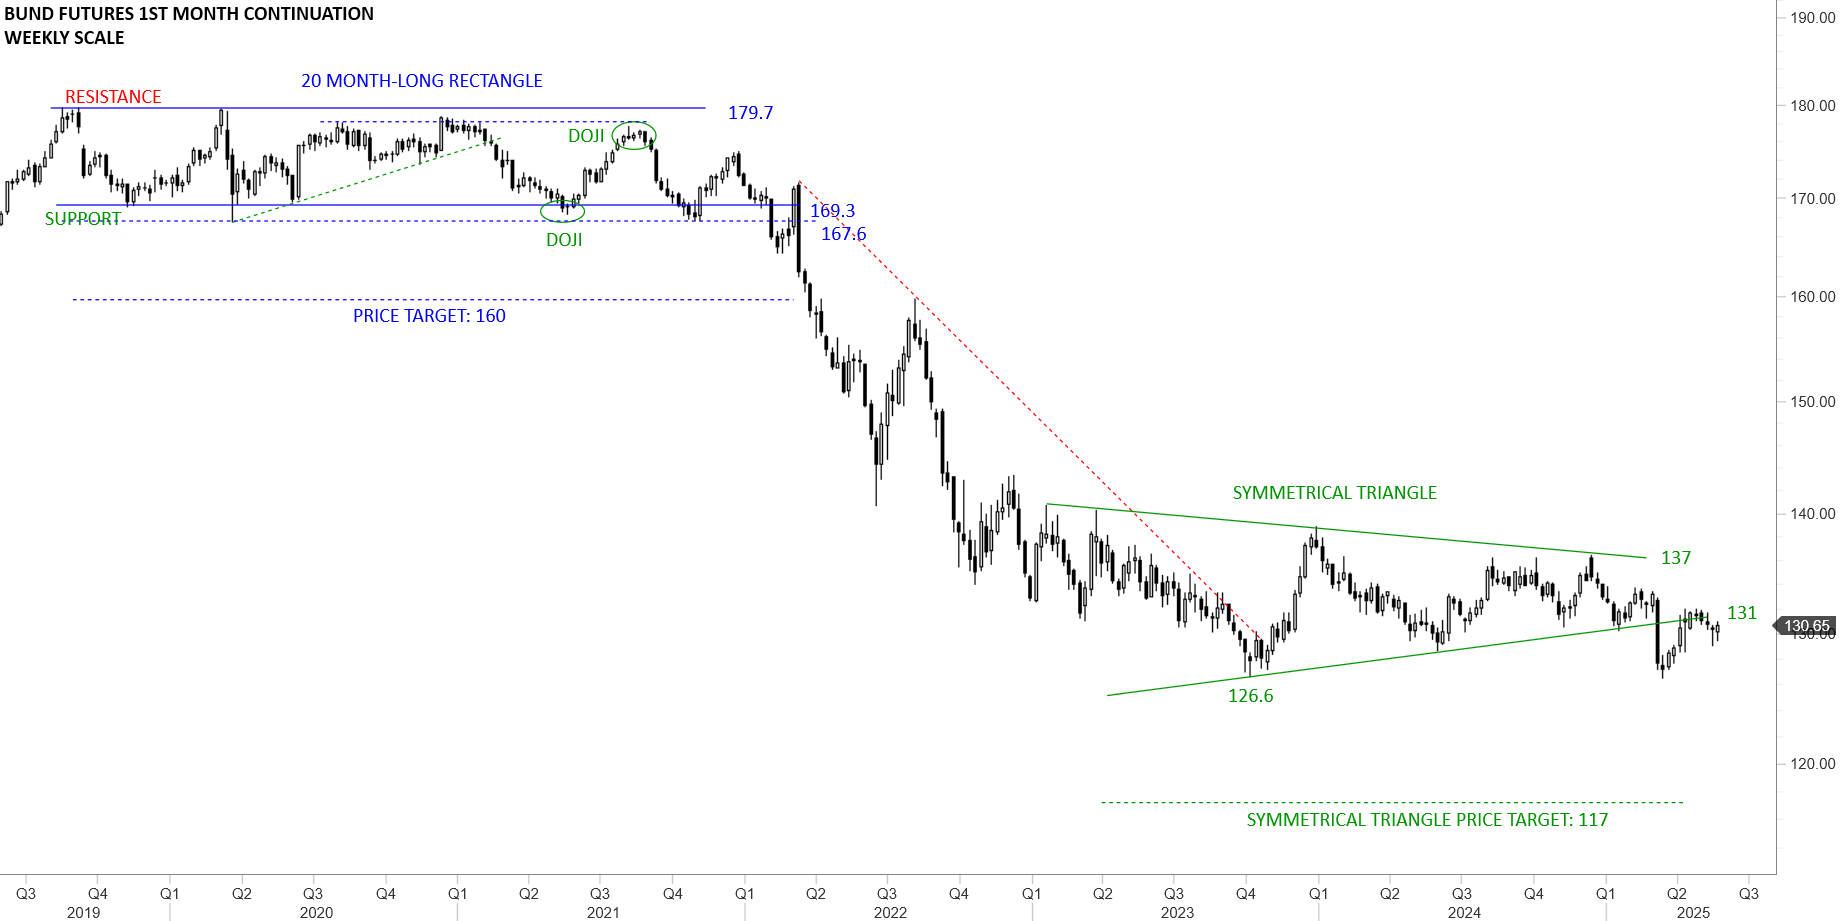
Bund had difficulty to accelerate on the upside. Breakdown below 131 levels completed the symmetrical triangle on the downside and can extend the downtrend towards the next support at 126.6 levels. Symmetrical triangle has a much lower price objective if the low at 126.6 is taken out on a weekly basis. The lower boundary of the symmetrical triangle is acting as resistance at 131 levels. Price action can still be considered a re-test of the broken symmetrical triangle.
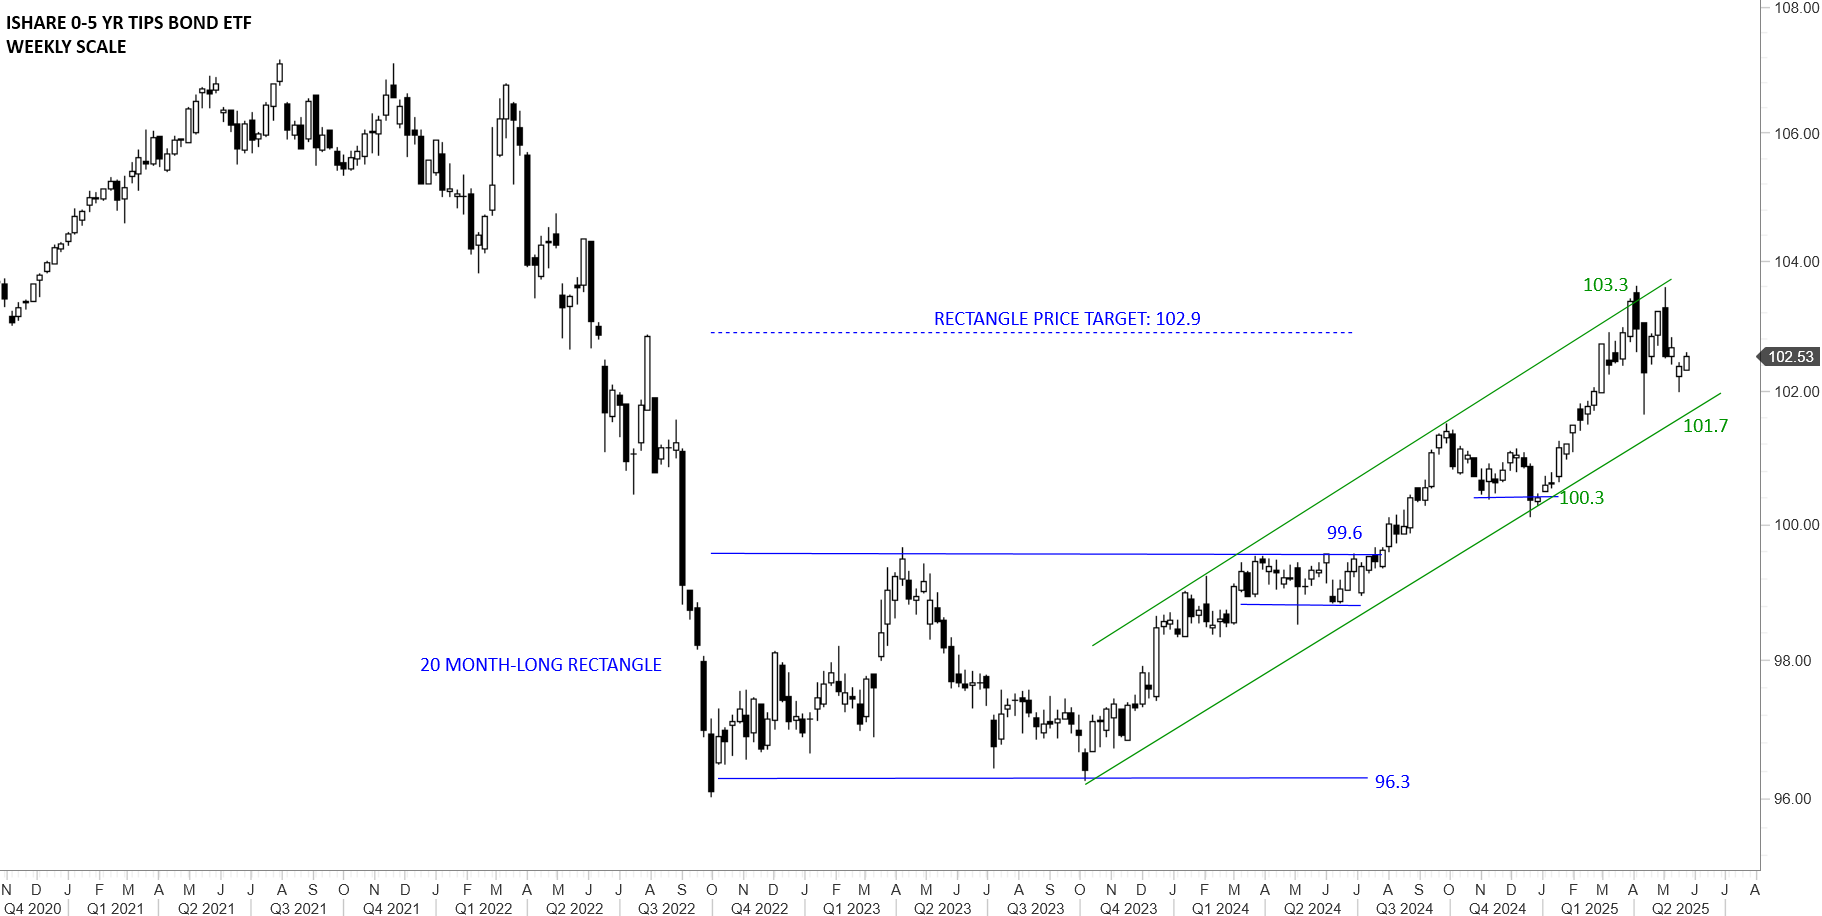
The I-SHARE 0-5 YR TIPS BOND ETF seeks to track the investment results of an index composed of inflation-protected U.S. Treasury bonds with remaining maturities of less than five years. It seeks to protect against near-term inflation. Price chart completed a 20 month-long rectangle with the upper boundary acting as resistance at 99.6 levels. Q2 2024 consolidation right below the resistance was a preparation for a breakout higher. Breakout in August confirmed the rectangle as bottom reversal with the price target of 102.9 levels. Price target was met. Uptrend is intact, though, price reversed from the upper boundary of its trend channel. The lower boundary of the trend channel forms support at 101.7 levels. Inflationary pressures remain intact.
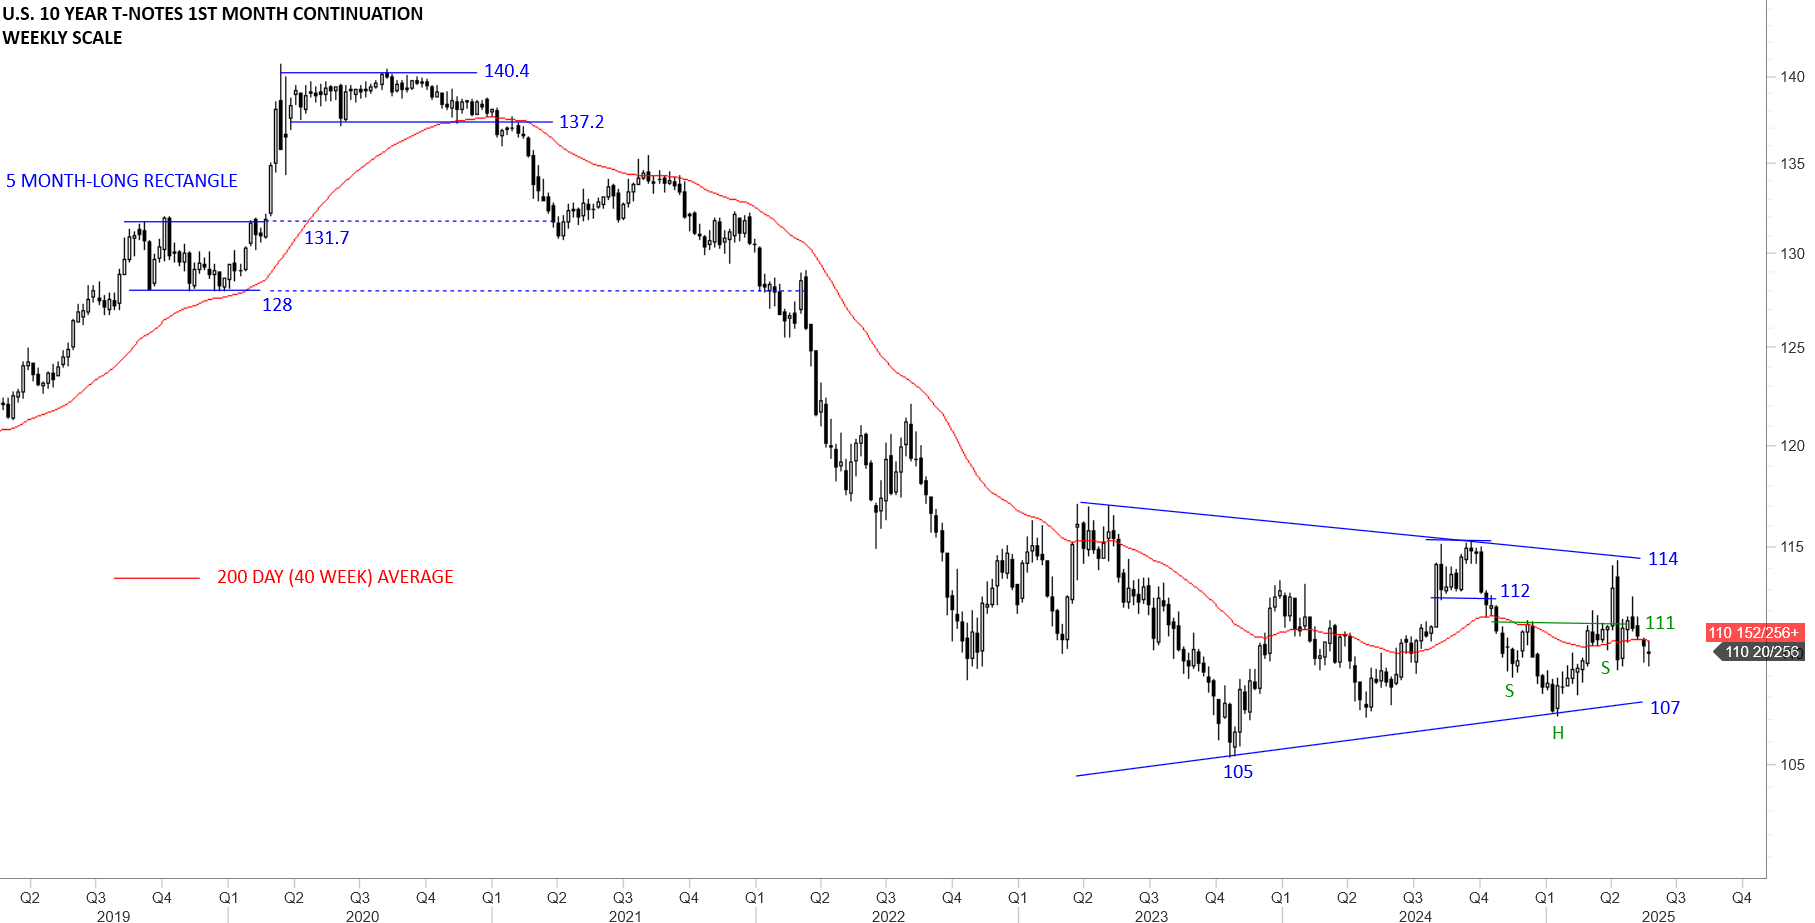
The U.S. 10 Year T-Note might be forming a long-term symmetrical triangle with the lower boundary acting as support at 107 and the upper boundary as resistance at 114 levels. Price can remain volatile in this range in the following weeks.
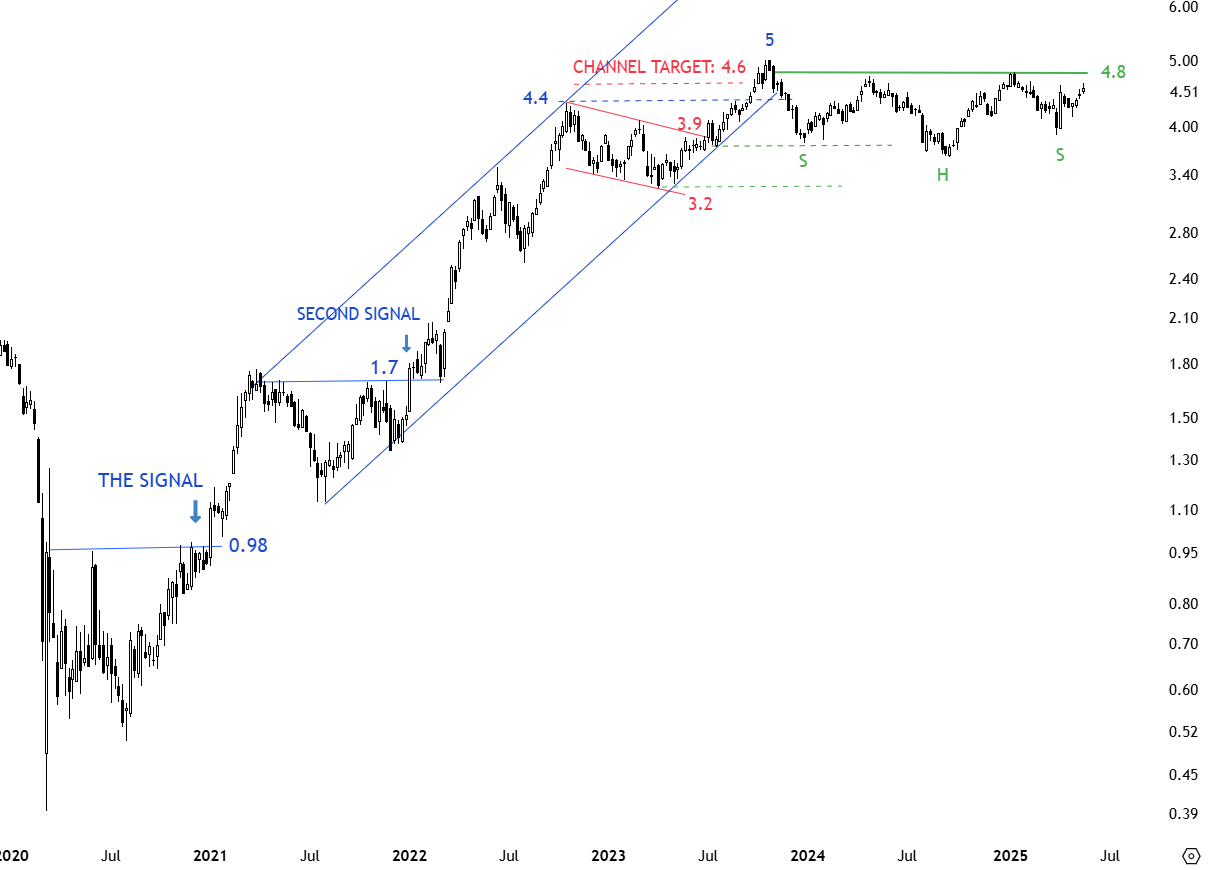
4.8-5.0 area is the strong resistance formed by the horizontal resistance and the high at 5.0. The chart pattern is morphing and price is looking for direction. Wide trading range is between 3.5 and 5.0 levels. A possible H&S continuation might be forming with the neckline at 4.8 levels. Breakout above 4.8 can resume the uptrend on 10 year yields. Yields remain elevated and suggest inflation is still a concern.
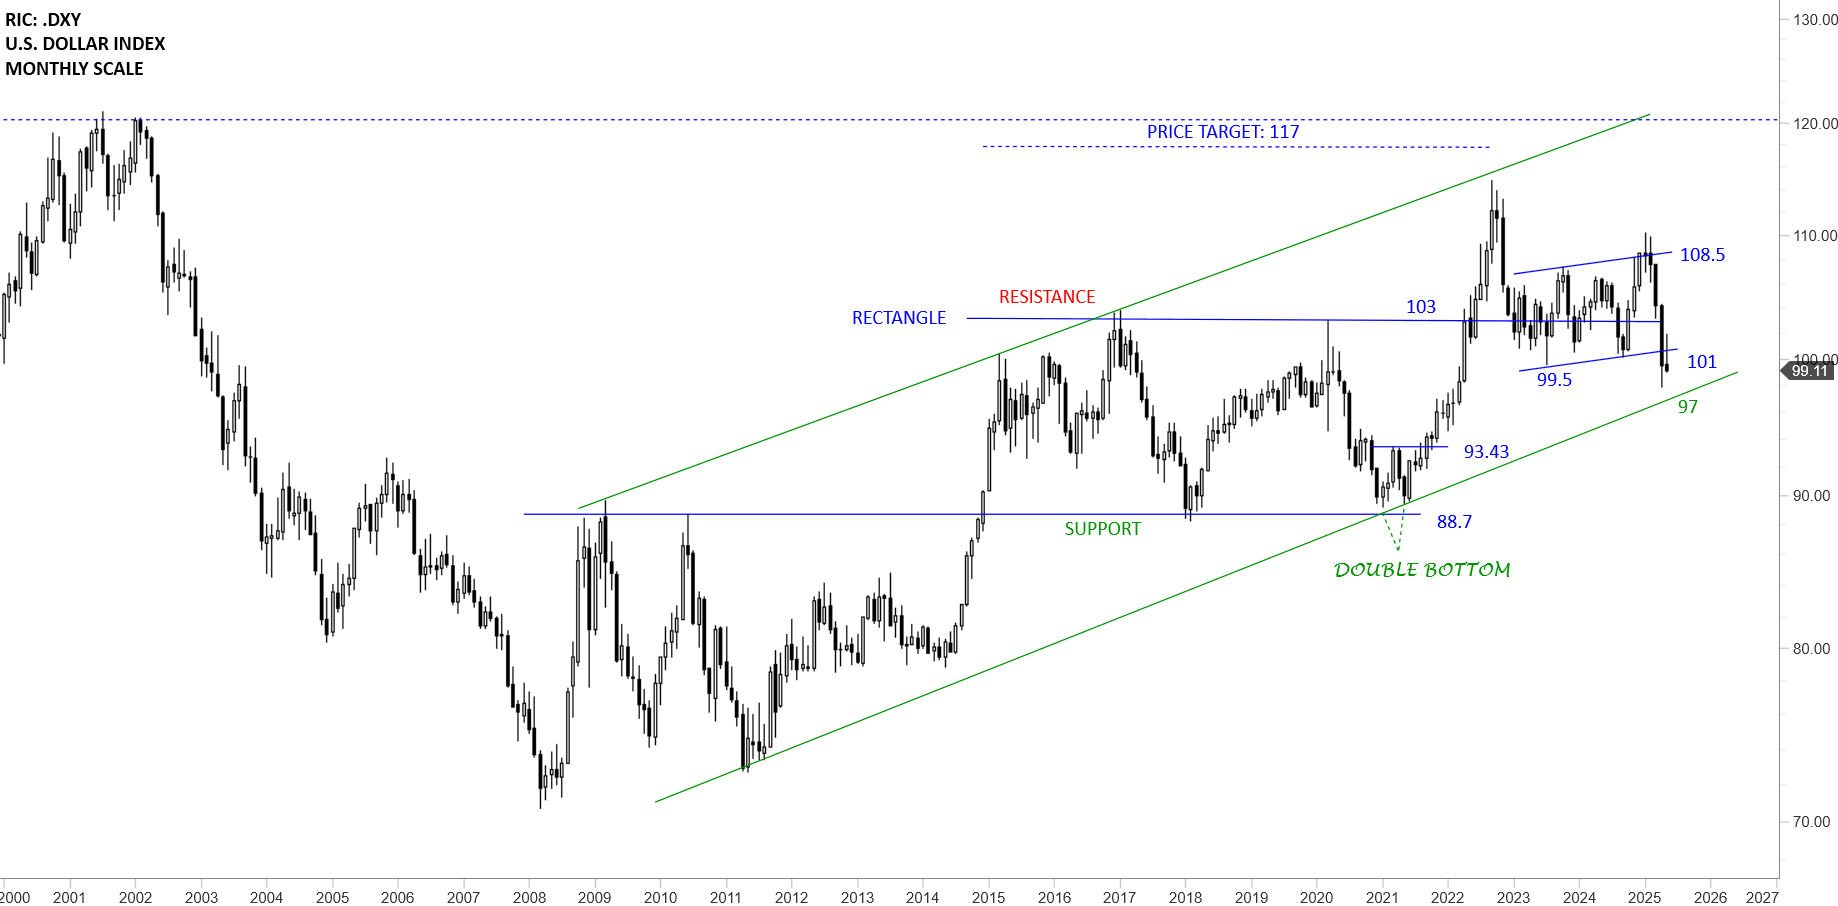
The USD Index better defined range is between 101 and 108.5 levels. For now the U.S. Dollar Index consolidates between 101 and 108.5. April’s close was a borderline breach of the support. 99.5-101 area continues to act as short-term support. A quick recovery above 101-103 area can renew the USD strength against major pairs. I’m monitoring end of month close. Failure to recover above 101 can result in a test of 97 levels.
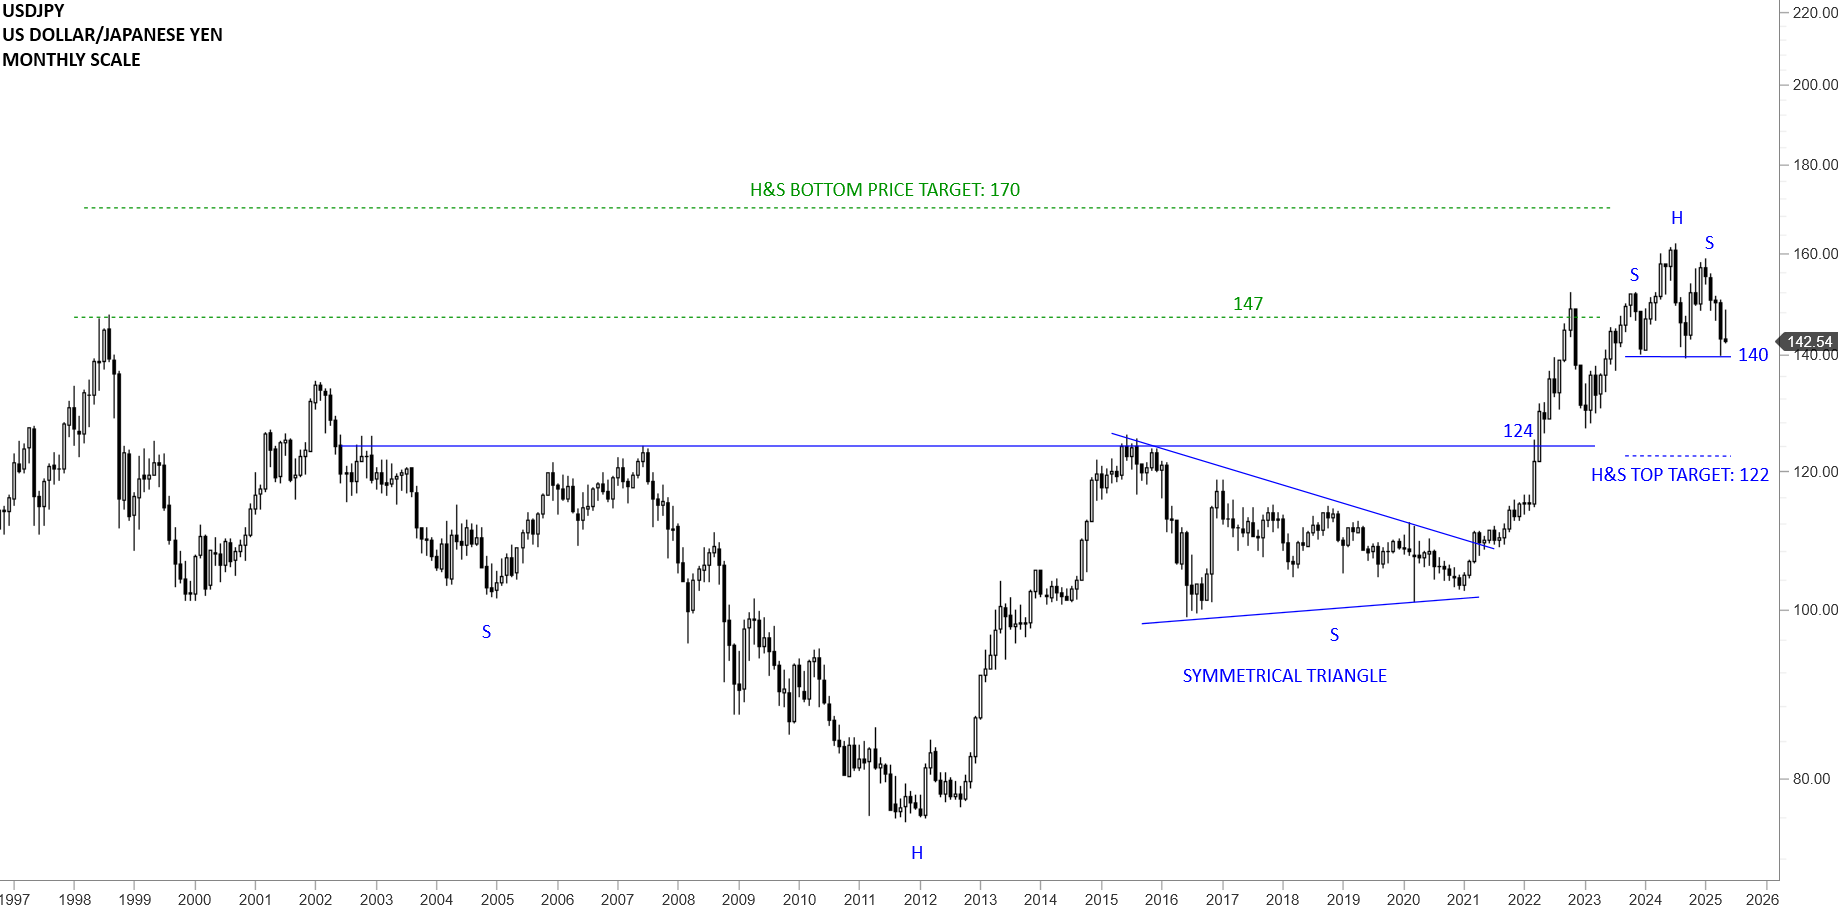
USDJPY completed multi-year long bottom reversal with a breakout above 124 levels. Long-term price action can be analyzed as a steady uptrend with higher highs and higher lows. 140 levels continue to act as support. Wide range remains between 140 and 162 levels. Re-test of 140 levels can better define a H&S top with the neckline at 140. Breakdown below 140 levels can complete the H&S top with the price target of 122 levels. Monthly chart shows a rebound from the lows at 140. While the chart pattern is clearly a H&S top, there is still no breakdown confirmation.
There are 3 new breakout signals.
TECH CHARTS ALERT
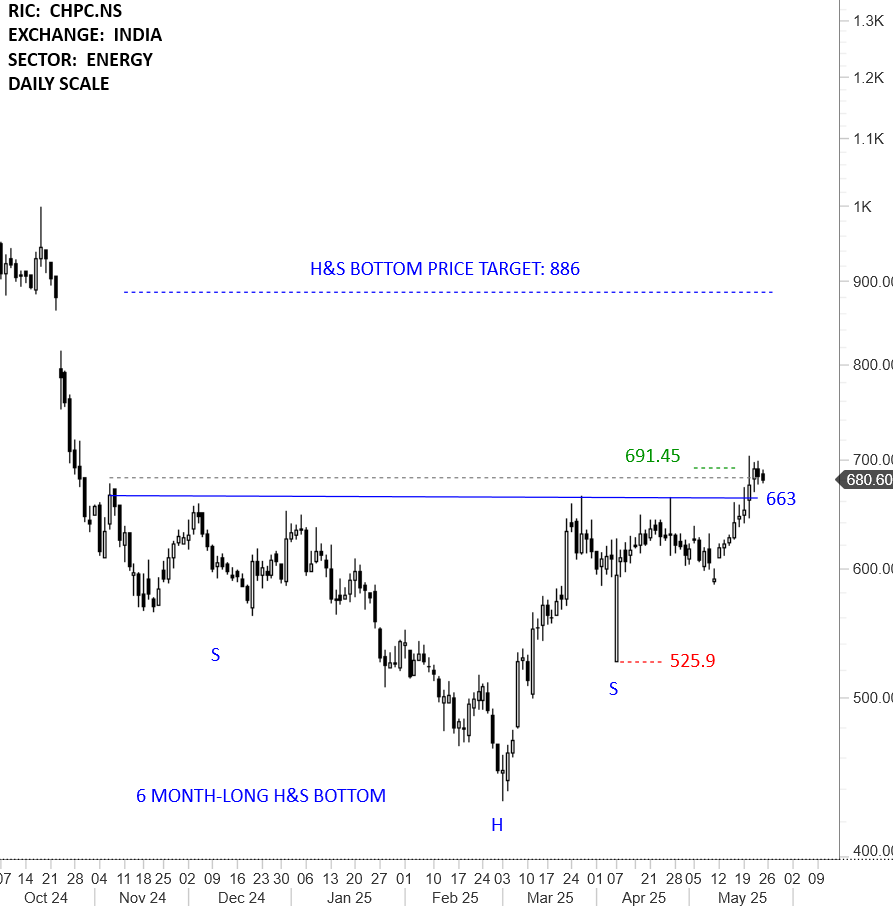
CHENNAI PETROLEUM CORPORATION LTD (CHPC.NS)
Chennai Petroleum Corporation Limited is an India-based refining company, which is engaged in the processing of crude oil into refined petroleum products and other products. The stock is listed on the National Stock Exchange. Price chart formed a 6 month-long head and shoulder bottom with the horizontal boundary acting as strong resistance at 663.00 levels. The horizontal boundary was tested several times over the course of the chart pattern. The daily close above 682.00 levels confirmed the breakout from the 6 month-long head and shoulder bottom with the possible chart pattern price target of 886.00 levels. (Learn more: Video Tutorial)
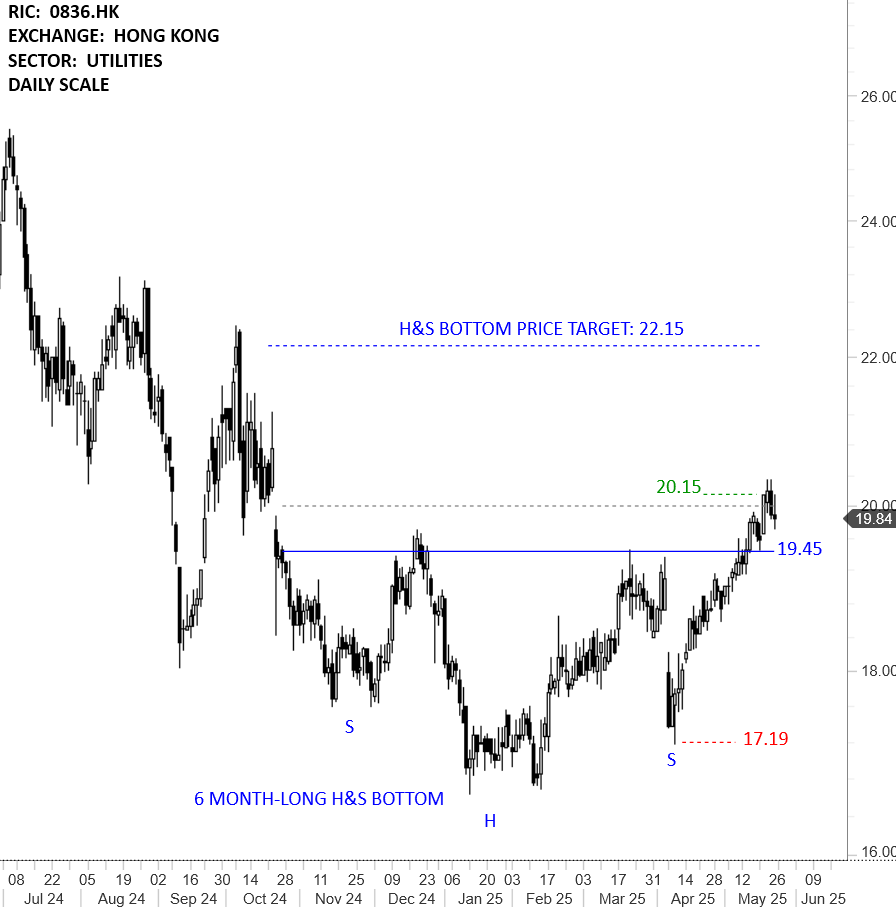
CHINA RESOURCES POWER HOLDINGS CO LTD (0836.HK)
China Resources Power Holdings Company Limited is a Hong Kong-based investment holding company principally engaged in the investment, development and operation of power plants. The stock is listed on the Hong Kong Stock Exchange. Price chart formed a 6 month-long head and shoulder bottom with the horizontal boundary acting as strong resistance at 19.45 levels. The horizontal boundary was tested several times over the course of the chart pattern. The daily close above 20.00 levels confirmed the breakout from the 6 month-long head and shoulder bottom with the possible chart pattern price target of 22.15 levels. (Learn more: Video Tutorial)
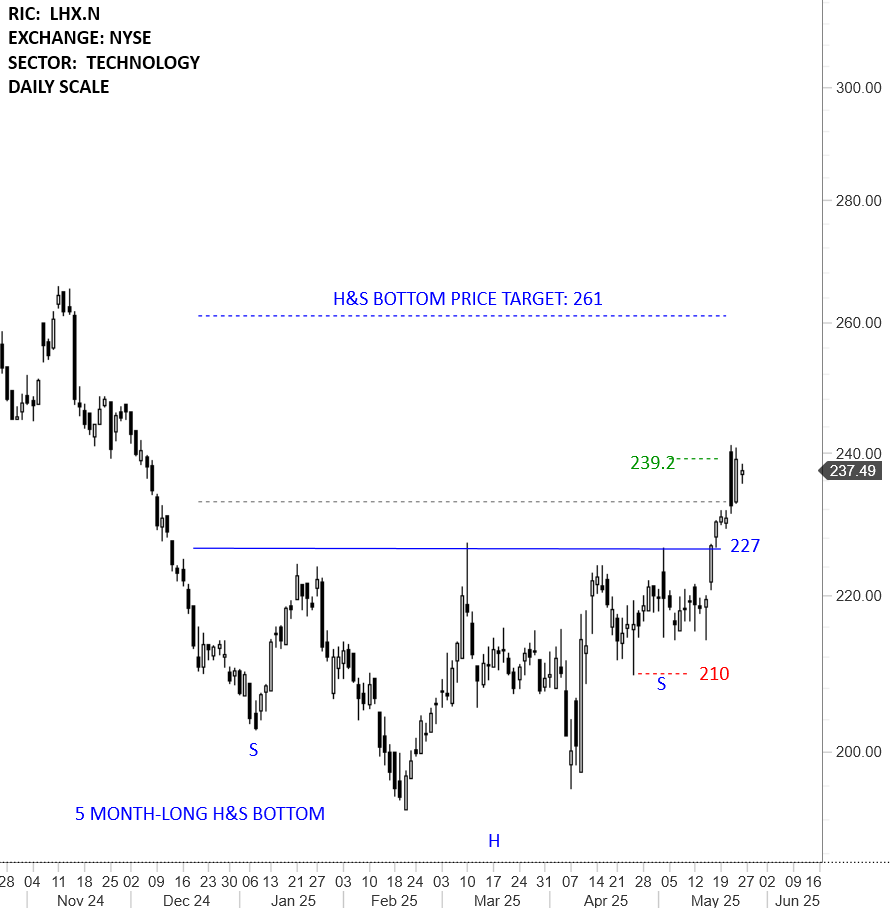
L3HARRIS TECHNOLOGIES INC (LHX.N)
L3Harris Technologies, Inc. provides end-to-end technology solutions connecting the space, air, land, sea and cyber domains in the interest of national security. Its segments include Space & Airborne Systems (SAS), Integrated Mission Systems (IMS), Communication Systems (CS), and Aerojet Rocketdyne (AR). The stock is listed on the New York Stock Exchange. Price chart formed a 5 month-long head and shoulder bottom with the horizontal boundary acting as strong resistance at 227.00 levels. The horizontal boundary was tested several times over the course of the chart pattern. The daily close above 233.00 levels confirmed the breakout from the 5 month-long head and shoulder bottom with the possible chart pattern price target of 261.00 levels. (Learn more: Video Tutorial)
There are 7 additions to watchlist.
TECH CHARTS WATCHLIST
AMERICAS
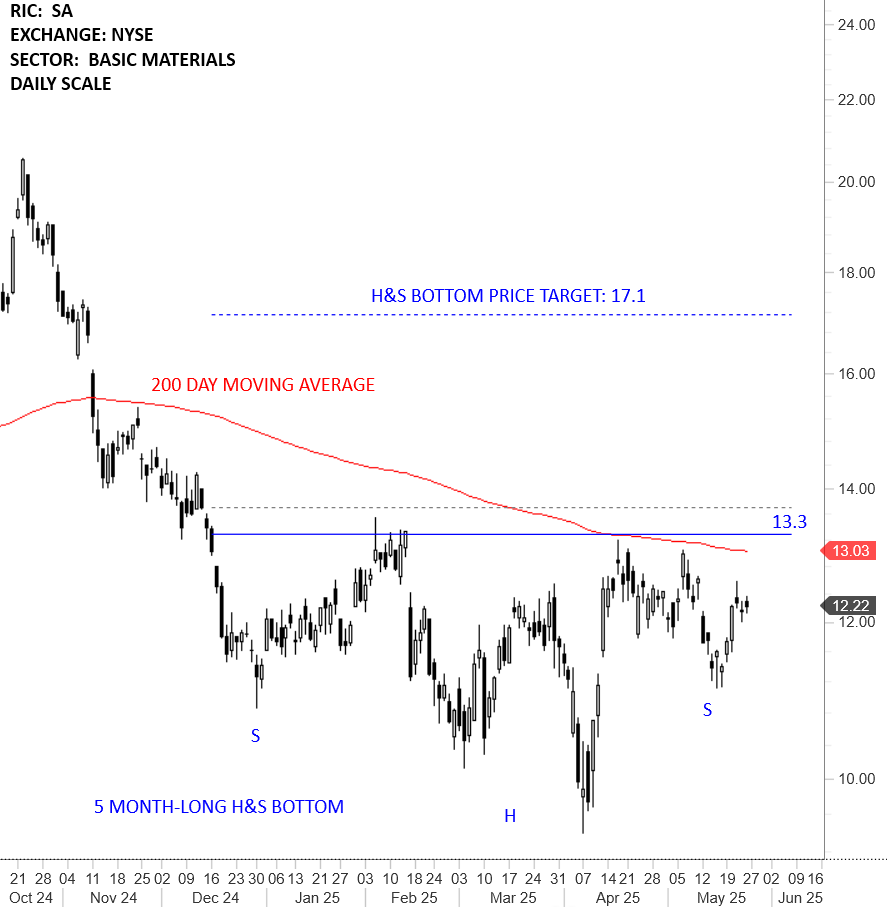
SEABRIDGE GOLD INC (SA) – new addition to watchlist
Seabridge Gold Inc. is engaged in acquiring, exploring, and advancing mineral properties, with an emphasis on gold resources, located in Canada and the United States. The stock is listed on the New York Stock Exchange. Price chart formed a 5 month-long head and shoulder bottom with the horizontal boundary acting as strong resistance at 13.30 levels. The horizontal boundary was tested several times over the course of the chart pattern. A daily close above 13.70 levels will confirm the breakout from the 5 month-long head and shoulder bottom with the possible chart pattern price target of 17.10 levels. (Learn more: Video Tutorial)
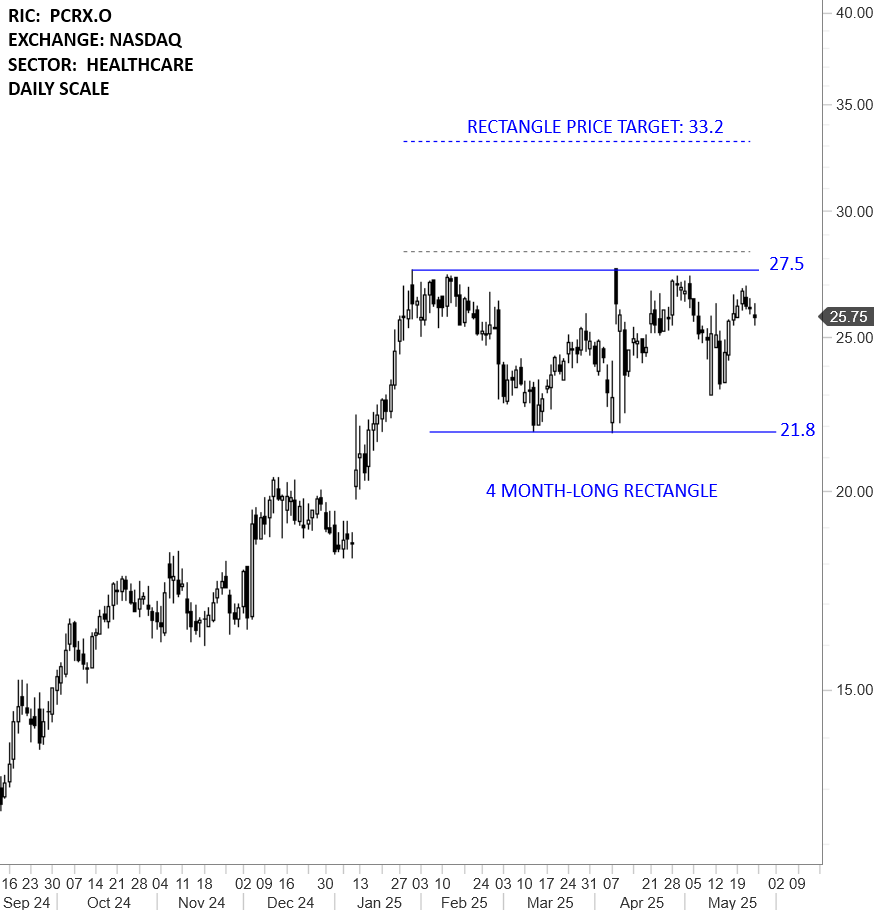
PACIRA BIOSCIENCES INC (PCRX.O) – new addition to watchlist
Pacira BioSciences, Inc. is the holding company for its subsidiary, Pacira Pharmaceuticals, Inc. The Company has three commercial-stage non-opioid treatments: EXPAREL (bupivacaine liposome injectable suspension), a long-acting local analgesic approved for infiltration, fascial plane block, and as an interscalene brachial plexus nerve block, an adductor canal nerve block, and a sciatic nerve block in the popliteal fossa for postsurgical pain management; ZILRETTA (triamcinolone acetonide extended-release injectable suspension), an extended-release, intra-articular injection indicated for the management of osteoarthritis knee pain, and iovera, a handheld device for delivering immediate, long-acting, drug-free pain control using precise, controlled doses of cold temperature to a targeted nerve. The Company is also advancing the development of PCRX-201, a locally administered gene therapy with the potential to treat largely prevalent diseases like osteoarthritis. The stock is listed on the Nasdaq Stock Exchange. Price chart formed a 4 month-long rectangle with the horizontal boundary acting as strong resistance at 27.50 levels. The horizontal boundary was tested several times over the course of the chart pattern. A daily close above 28.30 levels will confirm the breakout from the 4 month-long rectangle with the possible chart pattern price target of 33.20 levels. (Learn more: Video Tutorial)
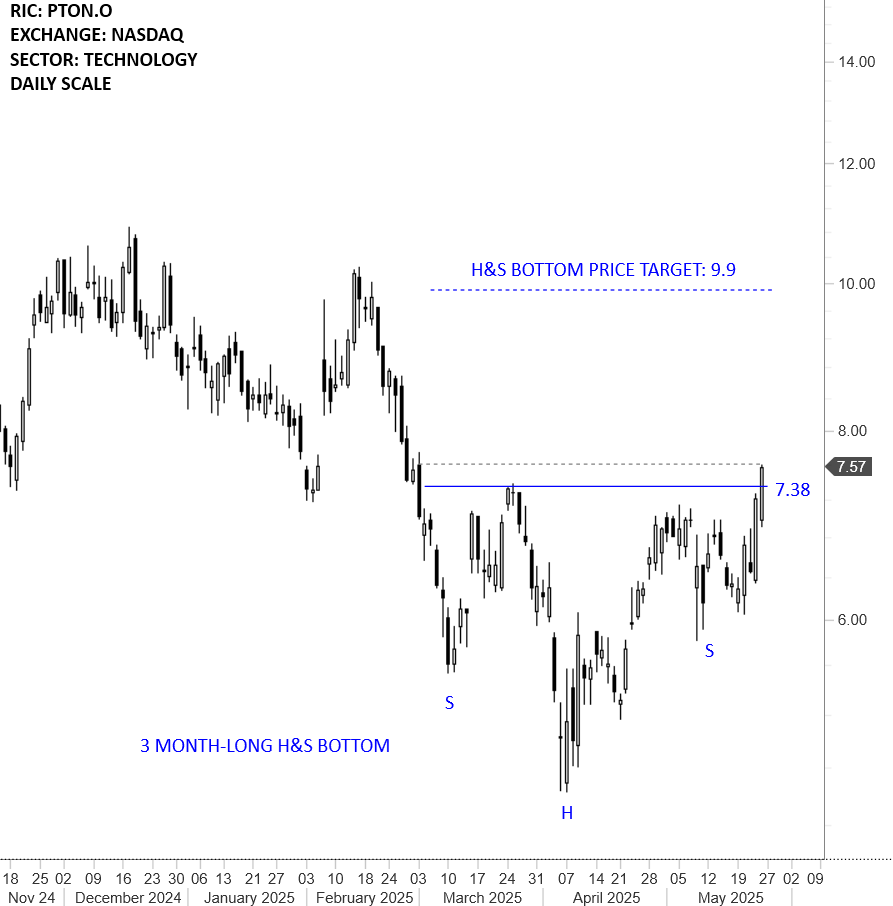
PELOTON INTERACTIVE INC (PTON.O) – new addition to watchlist
Peloton Interactive, Inc. is a global fitness company. The Company operates an interactive fitness platform throughout the world, with a community of over six million members. It provides connected, technology-enabled fitness and the streaming of instructor-led boutique classes to its members anytime, anywhere. The stock is listed on the Nasdaq Stock Exchange. Price chart formed a 3 month-long head and shoulder bottom with the horizontal boundary acting as strong resistance at 7.38 levels. The horizontal boundary was tested several times over the course of the chart pattern. A daily close above 7.60 levels will confirm the breakout from the 3 month-long head and shoulder bottom with the possible chart pattern price target of 9.90 levels. (Learn more: Video Tutorial)
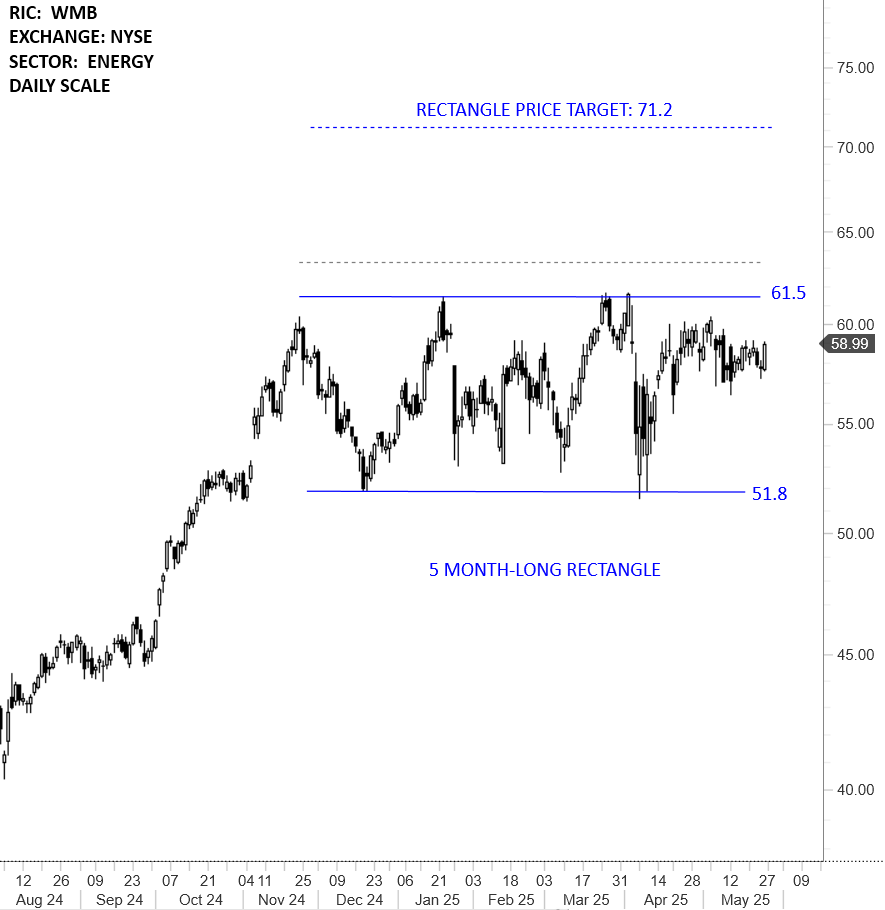
WILLIAMS COMPANIES INC (WMB)
The Williams Companies, Inc. is an energy company. Its segments include Transmission & Gulf of America, Northeast G&P, West, and Gas & NGL Marketing Services. The stock is listed on the New York Stock Exchange. Price chart formed a 5 month-long rectangle with the horizontal boundary acting as strong resistance at 61.50 levels. The horizontal boundary was tested several times over the course of the chart pattern. A daily close above 63.30 levels will confirm the breakout from the 5 month-long rectangle with the possible chart pattern price target of 71.20 levels. (Learn more: Video Tutorial)
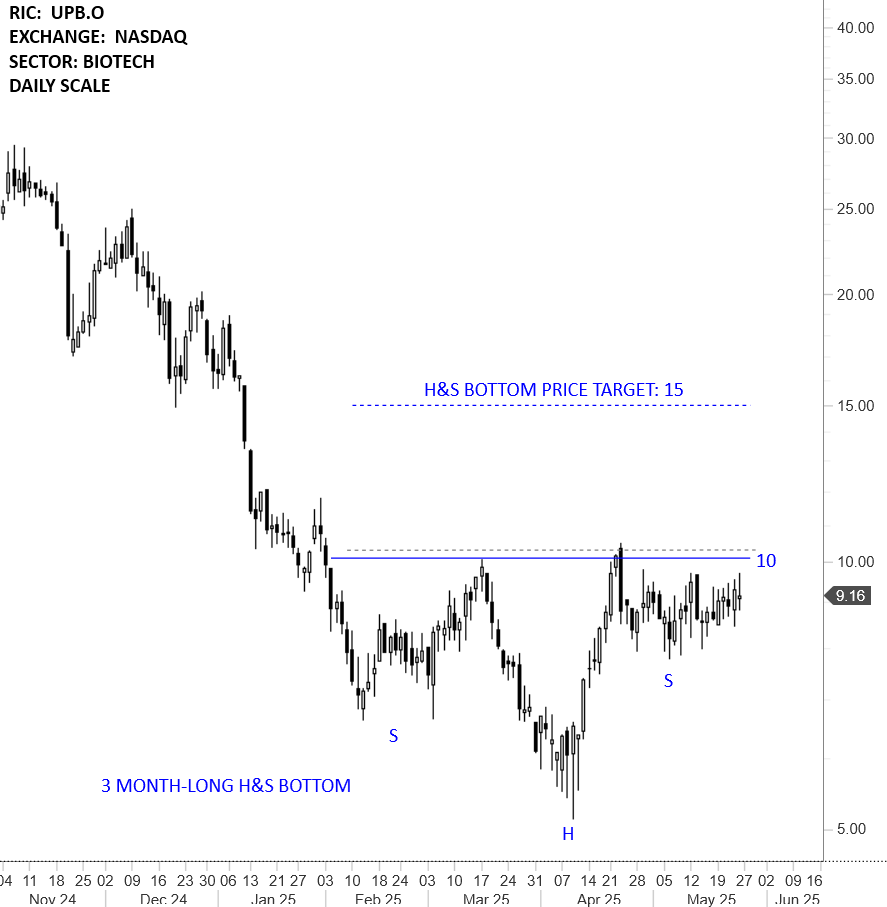
UPSTREAM BIO INC (UPB.O)
Upstream Bio, Inc. is a clinical-stage biotechnology company developing treatments for inflammatory diseases, with an initial focus on severe respiratory disorders. The stock is listed on the Nasdaq Stock Exchange. Price chart formed a 3 month-long head and shoulder bottom with the horizontal boundary acting as strong resistance at 10.00 levels. The horizontal boundary was tested several times over the course of the chart pattern. A daily close above 10.30 levels will confirm the breakout from the 3 month-long head and shoulder bottom with the possible chart pattern price target of 15.00 levels. (Learn more: Video Tutorial)
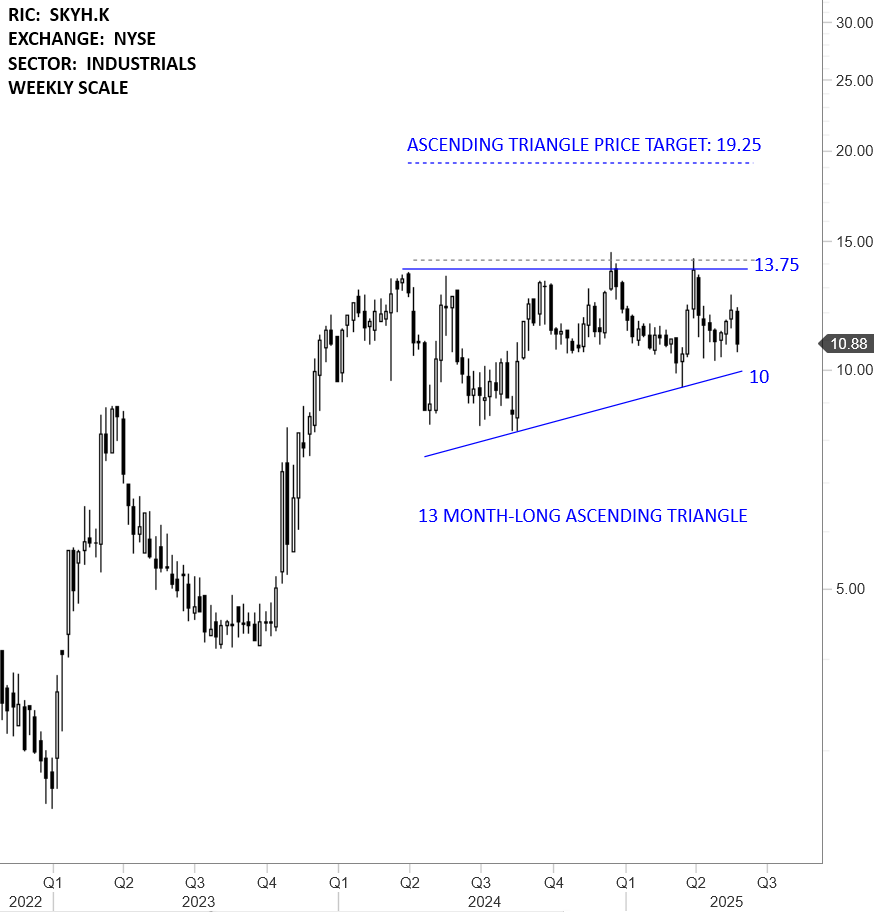
SKY HARBOUR GROUP CORP (SKYH.K)
Sky Harbour Group Corporation is an aviation infrastructure company. The Company is engaged in developing a nationwide network of home basing hangar campuses for business aircraft. The Company develops, leases and manages general aviation hangars across the United States. The stock is listed on the New York Stock Exchange. Price chart formed a 13 month-long ascending triangle with the horizontal boundary acting as strong resistance at 13.75 levels. The horizontal boundary was tested several times over the course of the chart pattern. A daily close above 14.15 levels will confirm the breakout from the 13 month-long ascending triangle with the possible chart pattern price target of 19.25 levels. (Learn more: Video Tutorial)
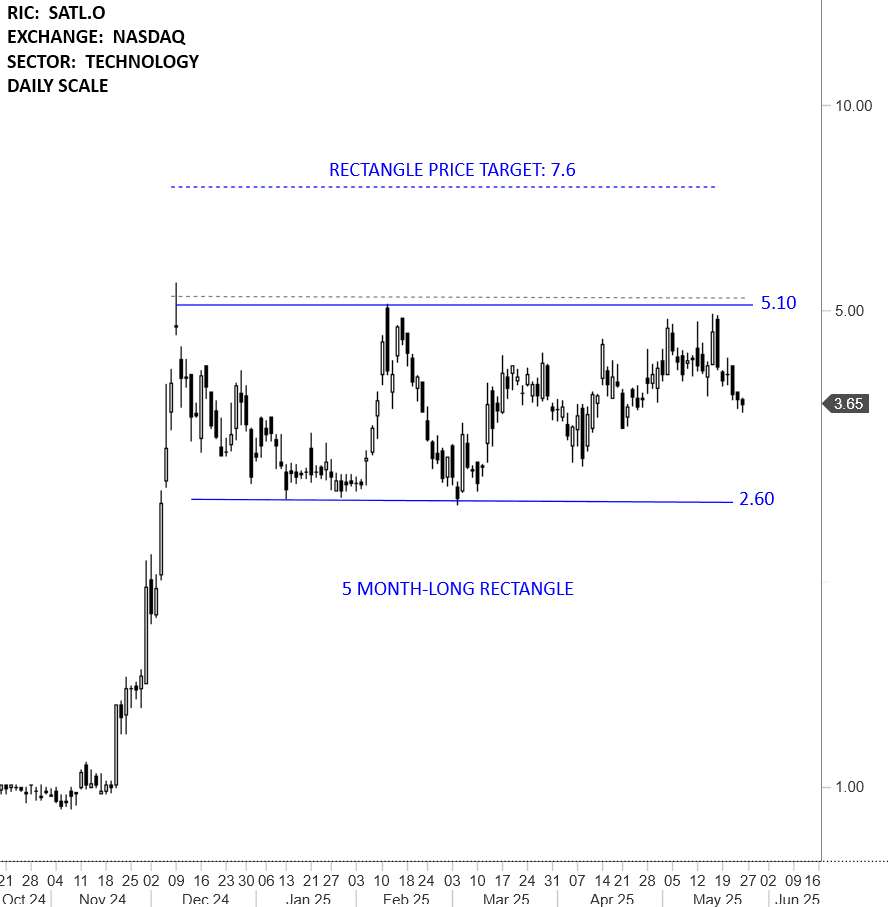
SATELLOGIC INC (SATL.O)
Satellogic Inc. is a vertically integrated geospatial analytics company. It is building a fully automated Earth Observation (EO) platform with the ability to remap the entire planet at both high-frequency and high-resolution, providing accessible and affordable solutions for its customers. The stock is listed on the Nasdaq Stock Exchange. Price chart formed a 5 month-long rectangle with the horizontal boundary acting as strong resistance at 5.10 levels. The horizontal boundary was tested several times over the course of the chart pattern. A daily close above 5.25 levels will confirm the breakout from the 5 month-long rectangle with the possible chart pattern price target of 7.60 levels. (Learn more: Video Tutorial)
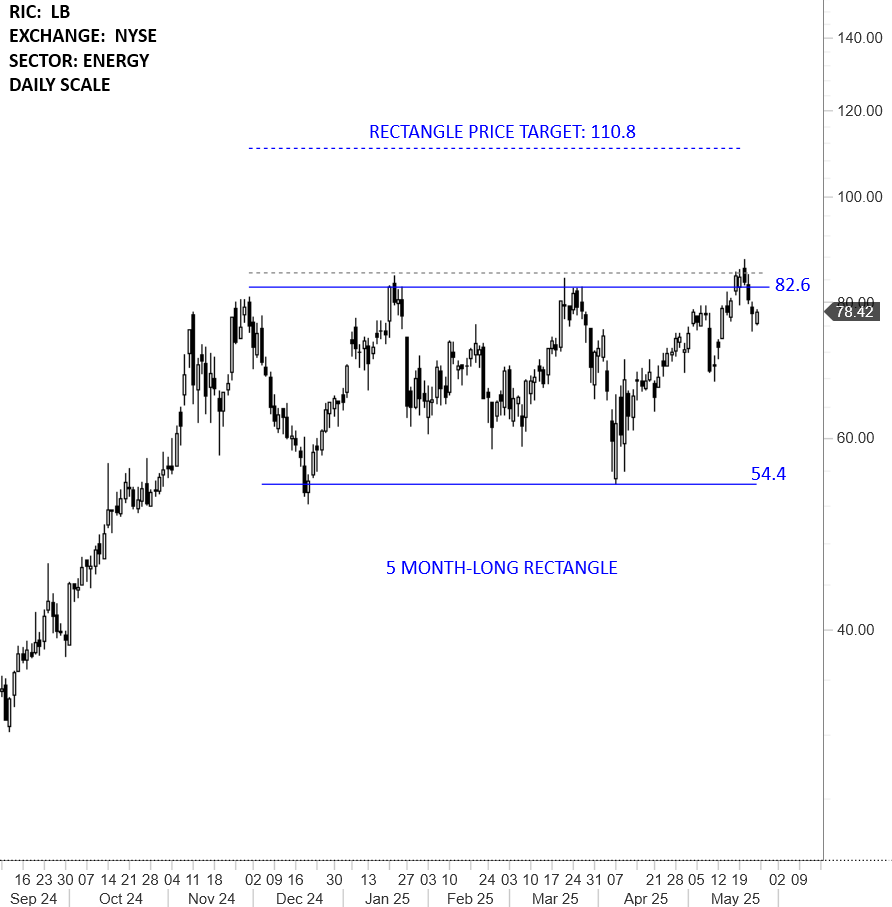
LANDBRIDGE CO LLC (LB)
LandBridge Company LLC owns approximately 273,000 surface acres across Texas and New Mexico, located primarily in the heart of the Delaware sub-basin in the Permian Basin, an active region for oil and natural gas exploration and development in the United States. The Company actively manages its land and resources to support and encourage energy and infrastructure development and other land uses, including digital infrastructure. The stock is listed on the New York Stock Exchange. Price chart formed a 5 month-long rectangle with the horizontal boundary acting as strong resistance at 82.60 levels. The horizontal boundary was tested several times over the course of the chart pattern. A daily close above 85.10 levels will confirm the breakout from the 5 month-long rectangle with the possible chart pattern price target of 110.80 levels. (Learn more: Video Tutorial)
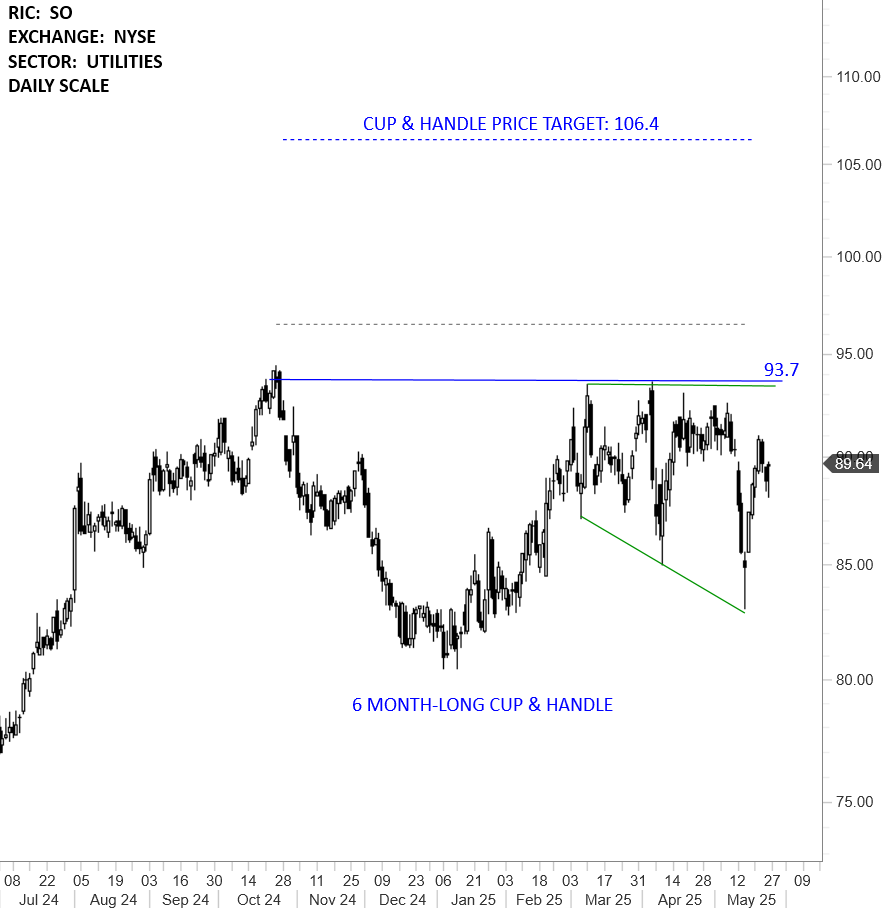
SOUTHERN CO (SO)
The Southern Company is an energy provider. The Company owns three traditional electric operating companies, Southern Power Company and Southern Company Gas. The stock is listed on the New York Stock Exchange. Price chart formed a 6 month-long cup & handle with the horizontal boundary acting as strong resistance at 93.70 levels. The horizontal boundary was tested several times over the course of the chart pattern. A daily close above 96.50 levels will confirm the breakout from the 6 month-long cup & handle with the possible chart pattern price target of 106.40 levels. The handle part of the pattern might be forming a broadening pattern that can act as continuation. (Learn more: Video Tutorial)
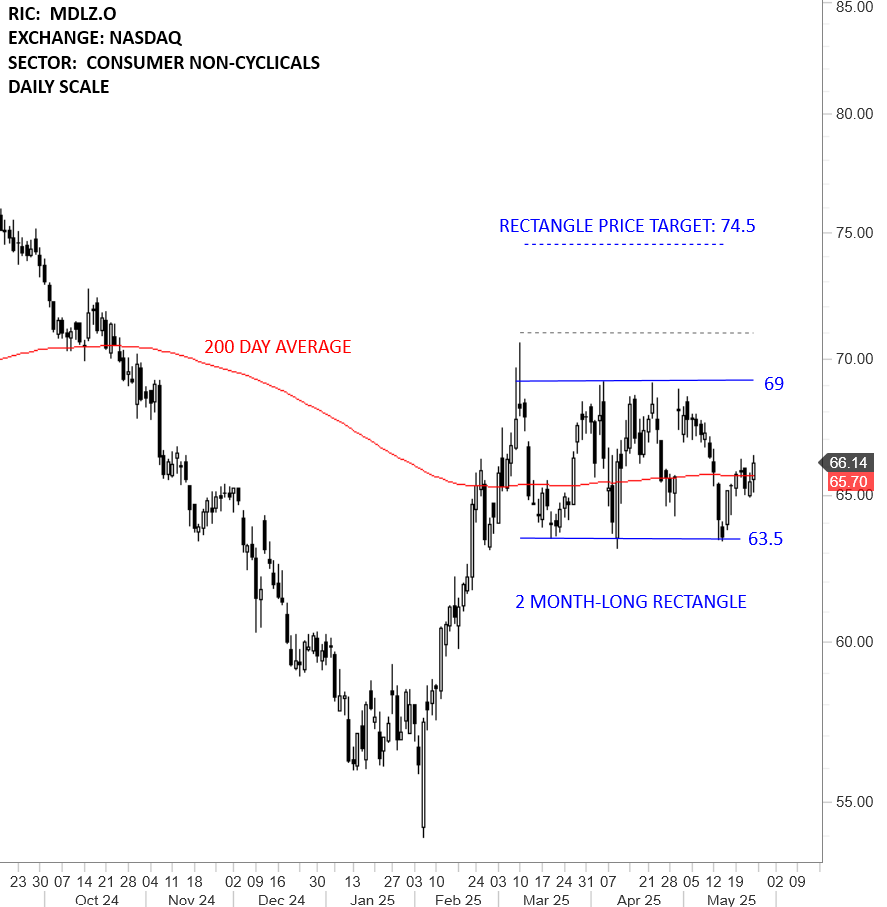
MONDELEZ INTERNATIONAL INC (MDLZ.O)
Mondelez International, Inc. is a snack company. The Company’s core business is making and selling chocolate, biscuits and baked snacks. The Company also has additional businesses in adjacent, locally relevant categories including gum and candy, cheese and grocery and powdered beverages. The stock is listed on the Nasdaq Stock Exchange. Price chart formed a 2 month-long rectangle with the horizontal boundary acting as strong resistance at 69.00 levels. The horizontal boundary was tested several times over the course of the chart pattern. A daily close above 71.00 levels will confirm the breakout from the 2 month-long rectangle with the possible chart pattern price target of 74.50 levels. (Learn more: Video Tutorial)
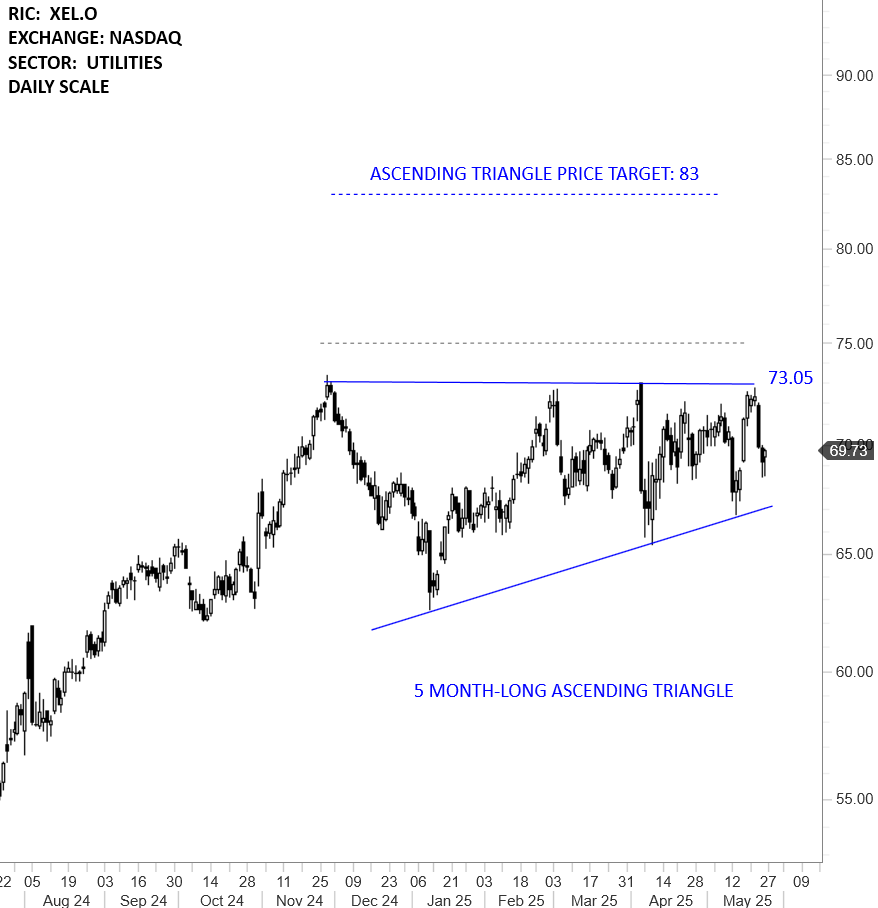
XCEL ENERGY INC (XEL.O)
Xcel Energy Inc. is an electric and natural gas delivery company. The Company provides a comprehensive portfolio of energy-related products and services to approximately 3.9 million electric customers and 2.2 million natural gas customers through four utility subsidiaries, NSP-Minnesota, NSP-Wisconsin, PSCo and SPS. The stock is listed on the Nasdaq Stock Exchange. Price chart formed a 5 month-long ascending triangle with the horizontal boundary acting as strong resistance at 73.05 levels. The horizontal boundary was tested several times over the course of the chart pattern. A daily close above 75.00 levels will confirm the breakout from the 5 month-long ascending triangle with the possible chart pattern price target of 83.00 levels. (Learn more: Video Tutorial)
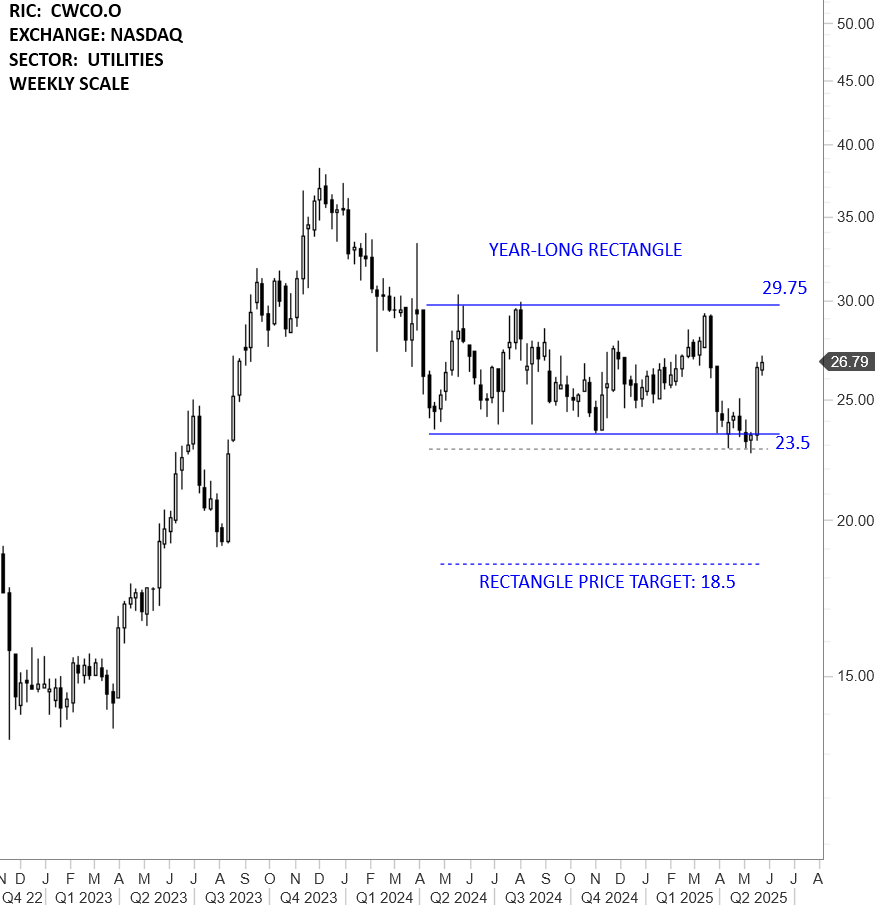
CONSOLIDATED WATER CO LTD (CWCO.O)
Consolidated Water Co. Ltd. is a Cayman Islands-based company that develops and operates advanced water supply and treatment plants and water distribution systems. The stock is listed on the Nasdaq Stock Exchange. Price chart formed a 12 month-long rectangle with the horizontal boundary acting as strong support at 23.50 levels. The horizontal boundary was tested several times over the course of the chart pattern. A daily close below 22.80 levels will confirm the breakdown from the 12 month-long rectangle with the possible chart pattern price target of 18.50 levels. (Learn more: Video Tutorial)
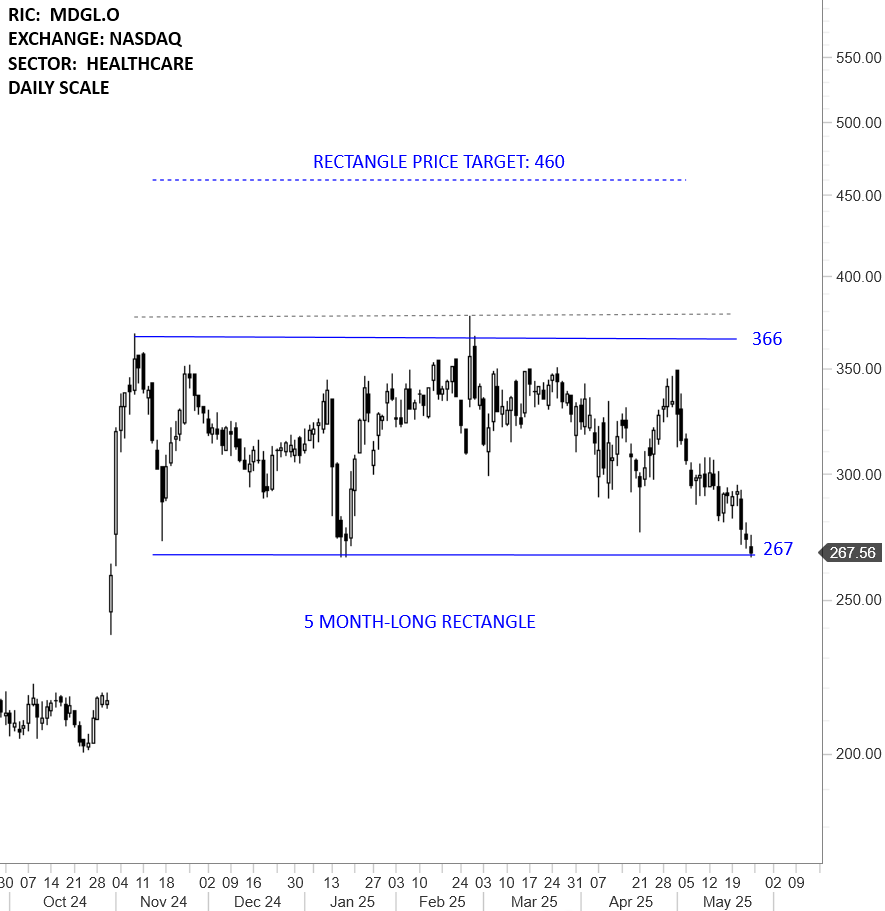
MADRIGAL PHARMACEUTICALS INC (MDGL.O)
Madrigal Pharmaceuticals, Inc. is a biopharmaceutical company focused on delivering novel therapeutics for metabolic dysfunction-associated steatohepatitis (MASH), a liver disease with high unmet medical need. The stock is listed on the Nasdaq Stock Exchange. Price chart formed a 5 month-long rectangle with the horizontal boundary acting as strong resistance at 366.00 levels. The horizontal boundary was tested several times over the course of the chart pattern. A daily close above 377.00 levels will confirm the breakout from the 5 month-long rectangle with the possible chart pattern price target of 460.00 levels. (Learn more: Video Tutorial)
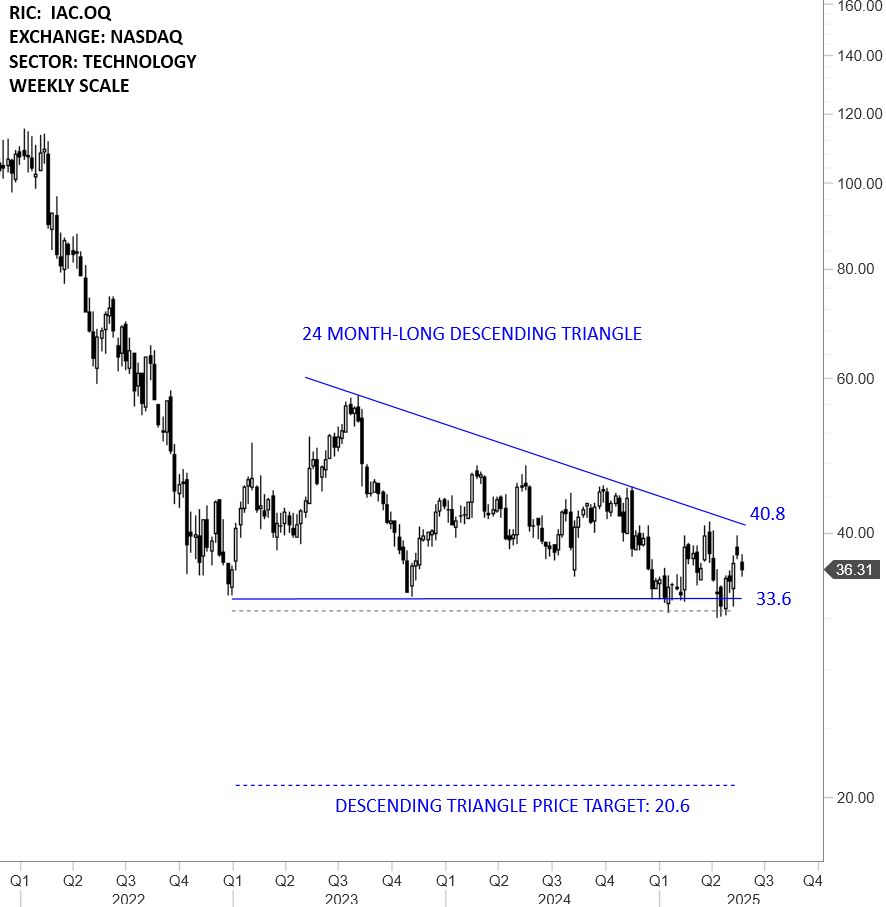
IAC INC (IAC.OQ)
IAC Inc. is engaged in building companies. The Company’s segments include Dotdash Meredith, Care.com, Search, and Emerging & Other. The stock is listed on the Nasdaq Stock Exchange. Price chart formed a 24 month-long descending triangle with the horizontal boundary acting as strong support at 33.60 levels. The horizontal boundary was tested several times over the course of the chart pattern. A daily close below 32.60 levels will confirm the breakdown from the 24 month-long descending triangle with the possible chart pattern price target of 20.60 levels. (Learn more: Video Tutorial)
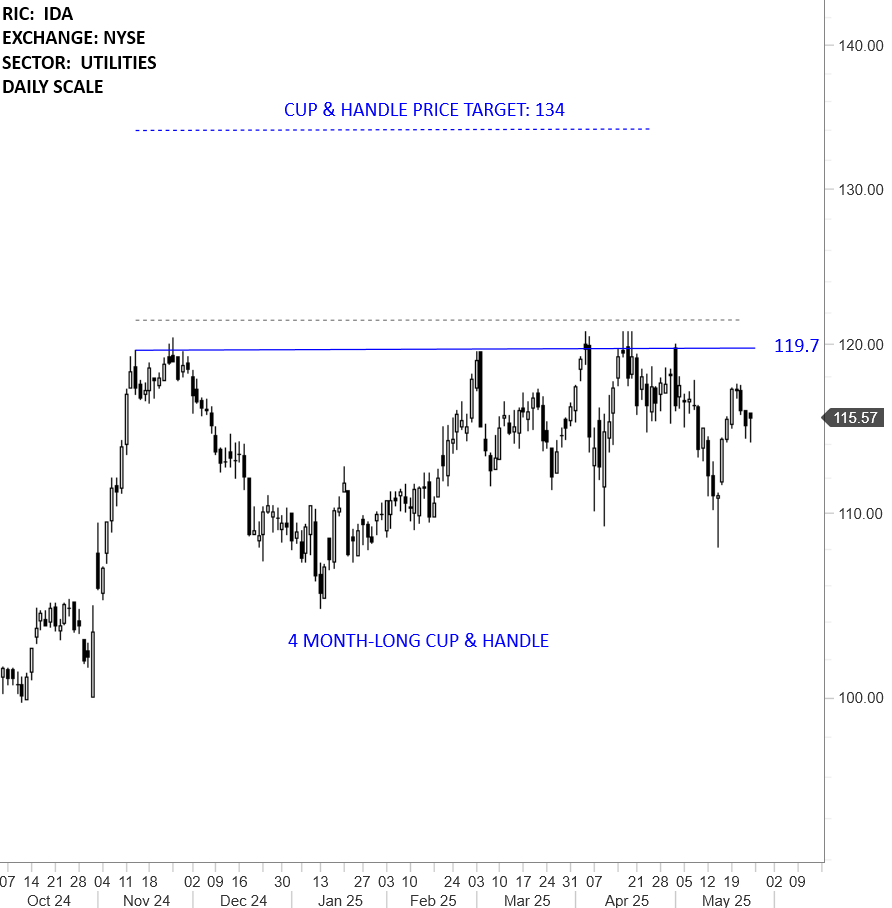
IDACORP INC (IDA)
IDACORP, Inc. is a holding company. The Company operates through its subsidiary, Idaho Power Company (Idaho Power). Idaho Power is an electric utility engaged in the generation, transmission, distribution, sale, and purchase of electric energy and capacity and is regulated by the state regulatory commissions of Idaho and Oregon and by the Federal Energy Regulatory Commission. The stock is listed on the New York Stock Exchange. Price chart formed a 4 month-long cup & handle continuation with the horizontal boundary acting as strong resistance at 119.70 levels. The horizontal boundary was tested several times over the course of the chart pattern. A daily close above 121.50 levels will confirm the breakout from the 4 month-long cup & handle continuation with the possible chart pattern price target of 134.00 levels. (Learn more: Video Tutorial)
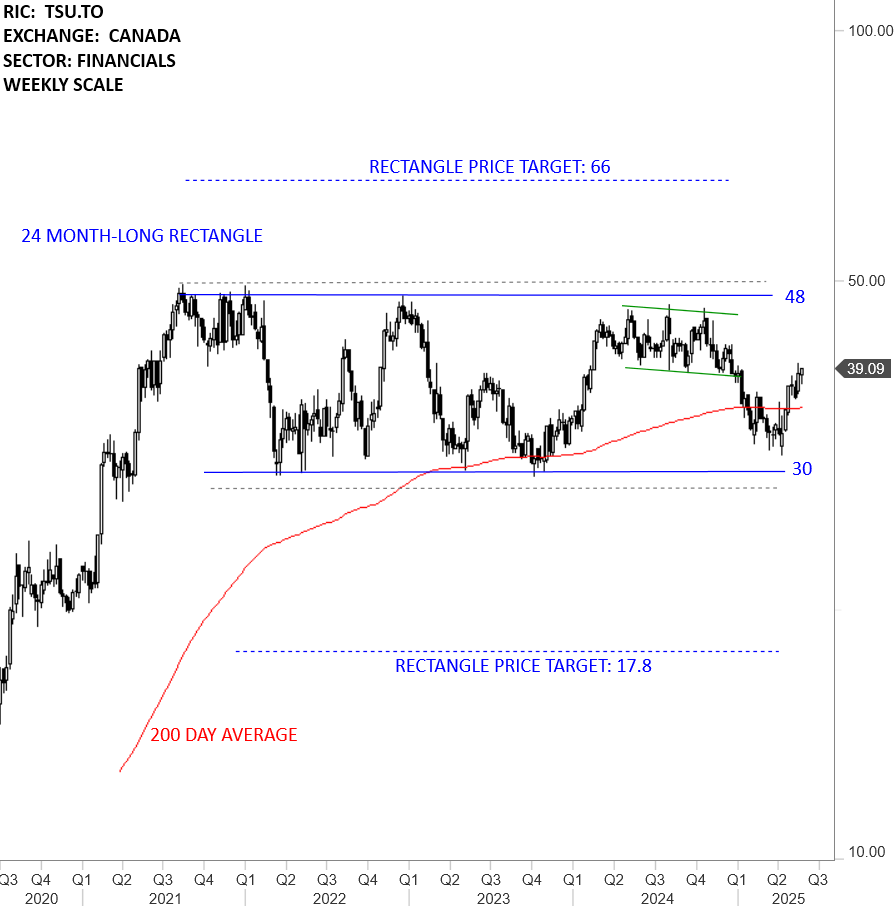
TRISURA GROUP LTD (TSU.TO)
Trisura Group Ltd. is a specialty insurance provider. The Company is engaged in operating in surety, risk solutions, corporate insurance, and fronting business lines of the market. The stock is listed on the Toronto Stock Exchange. Price chart formed a 24 month-long rectangle with the horizontal boundary acting as strong resistance at 48.00 levels. The horizontal boundary was tested several times over the course of the chart pattern. A daily close above 49.60 levels will confirm the breakout from the 24 month-long rectangle with the possible chart pattern price target of 66.00 levels. A daily close below 28 levels can confirm the rectangle as a top reversal with the price target of 17.8 levels. (Learn more: Video Tutorial)
EUROPE
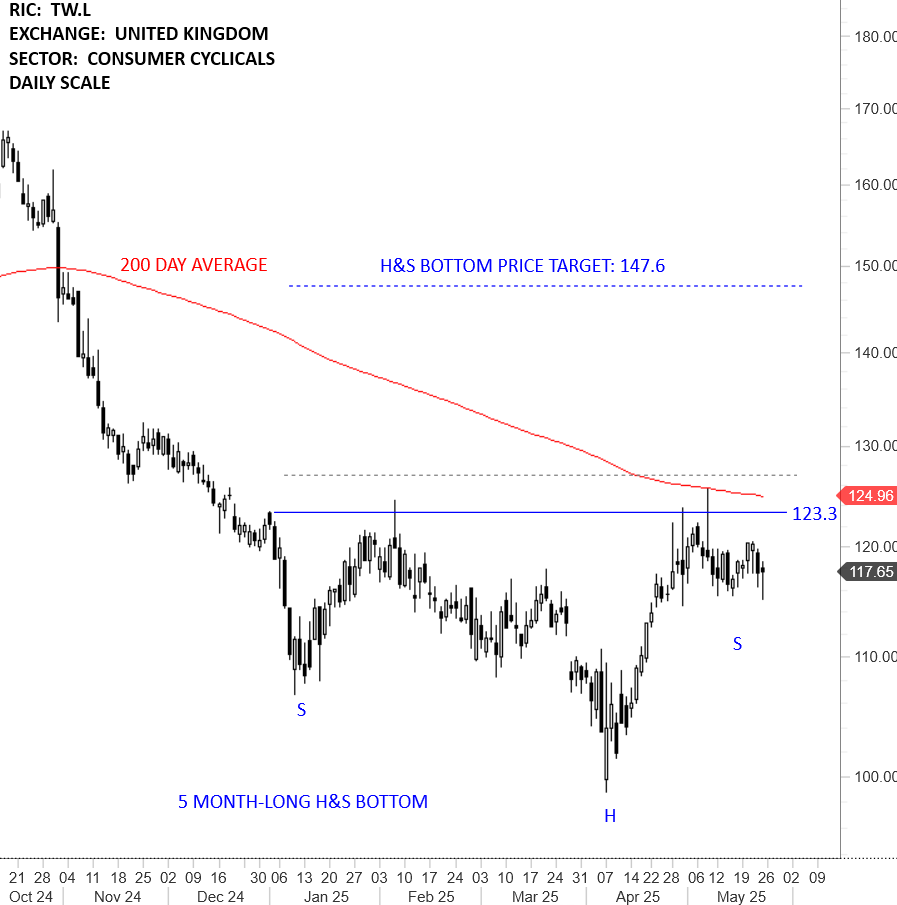
TAYLOR WIMPEY PLC (TW.L) – new addition to watchlist
Taylor Wimpey plc is a United Kingdom-based residential developer. The Company operates through two segments: United Kingdom and Spain. The stock is listed on the London Stock Exchange. Price chart formed a 5 month-long head and shoulder bottom with the horizontal boundary acting as strong resistance at 123.30 levels. The horizontal boundary was tested several times over the course of the chart pattern. A daily close above 127.00 levels will confirm the breakout from the 5 month-long head and shoulder bottom with the possible chart pattern price target of 147.60 levels. (Learn more: Video Tutorial)
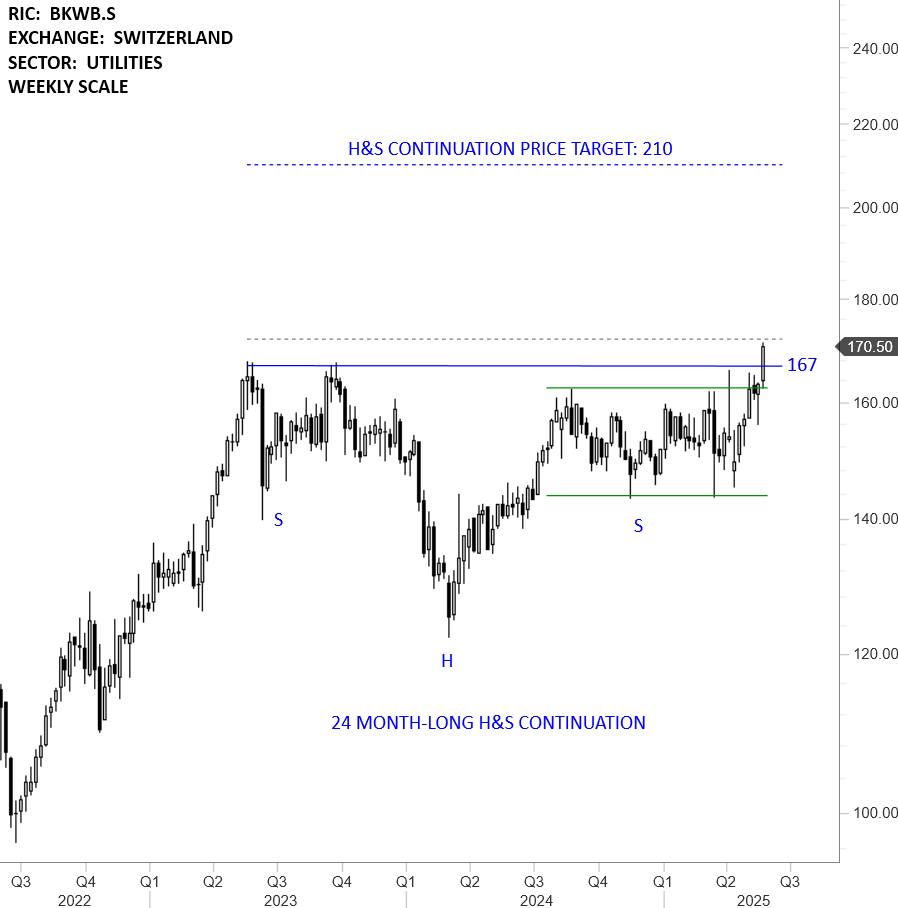
BKW AG (BKWB.S)
BKW AG (BKW) is a Switzerland-based company engaged in the energy sector. It covers energy supply, from production and transmission to trading and distribution. The stock is listed on the Swiss Stock Exchange. Price chart formed a 24 month-long head and shoulder continuation with the horizontal boundary acting as strong resistance at 167.00 levels. The horizontal boundary was tested several times over the course of the chart pattern. A daily close above 172.00 levels will confirm the breakout from the 24 month-long head and shoulder continuation with the possible chart pattern price target of 210.00 levels. (Learn more: Video Tutorial)
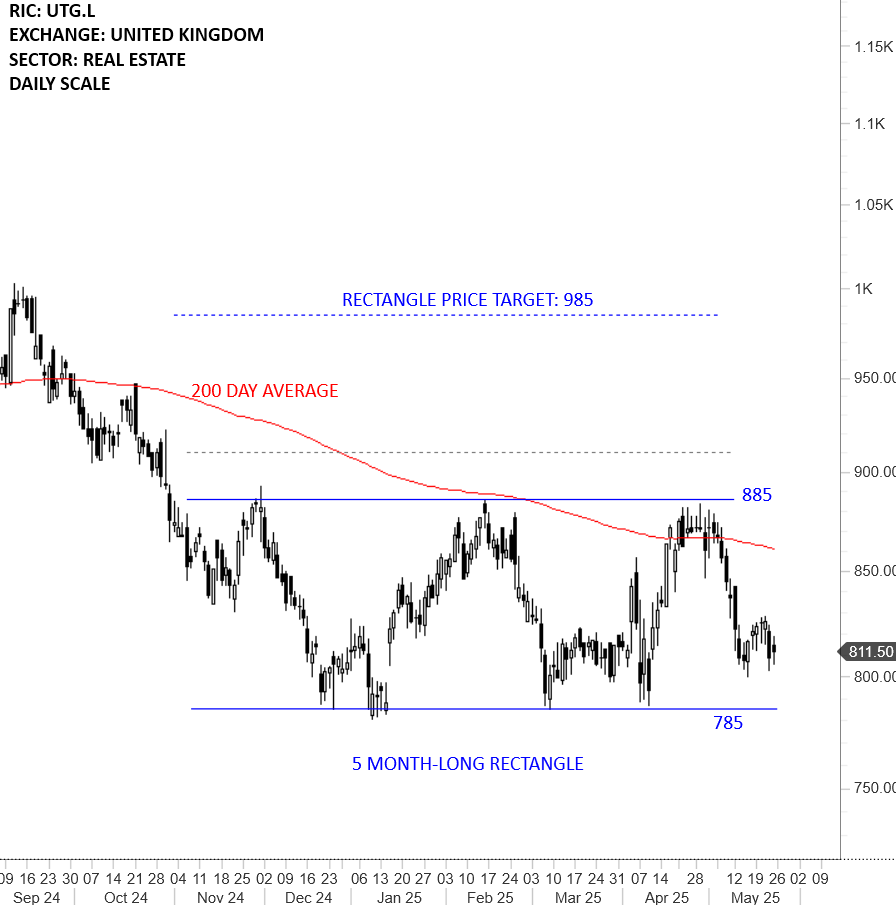
UNITE GROUP PLC (UTG.L)
The Unite Group PLC is a United Kingdom-based owner, manager, and developer of purpose-built student accommodation (PBSA) serving the country’s higher education sector. The Company provides homes to approximately 70,000 students across 152 properties in 23 university towns and cities. The stock is listed on the London Stock Exchange. Price chart formed a 5 month-long rectangle with the horizontal boundary acting as strong resistance at 885.00 levels. The horizontal boundary was tested several times over the course of the chart pattern. A daily close above 910.00 levels will confirm the breakout from the 5 month-long rectangle with the possible chart pattern price target of 985.00 levels.
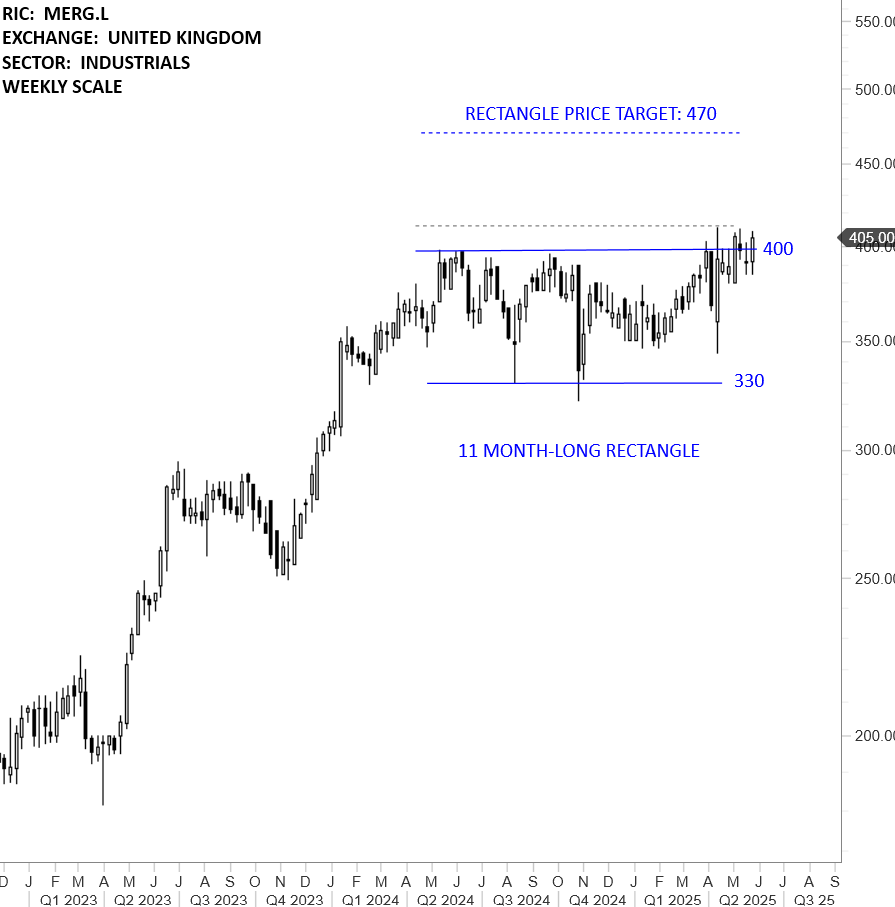
MEARS GROUP PLC (MERG.L)
Mears Group PLC is a United Kingdom-based provider of housing solutions for both the public and private sectors. The Company’s segments include Maintenance and Management. The stock is listed on the London Stock Exchange. Price chart formed an 11 month-long rectangle with the horizontal boundary acting as strong resistance at 400.00 levels. The horizontal boundary was tested several times over the course of the chart pattern. A daily close above 412.00 levels will confirm the breakout from the 11 month-long rectangle with the possible chart pattern price target of 470.00 levels. (Learn more: Video Tutorial)
MIDDLE EAST & AFRICA
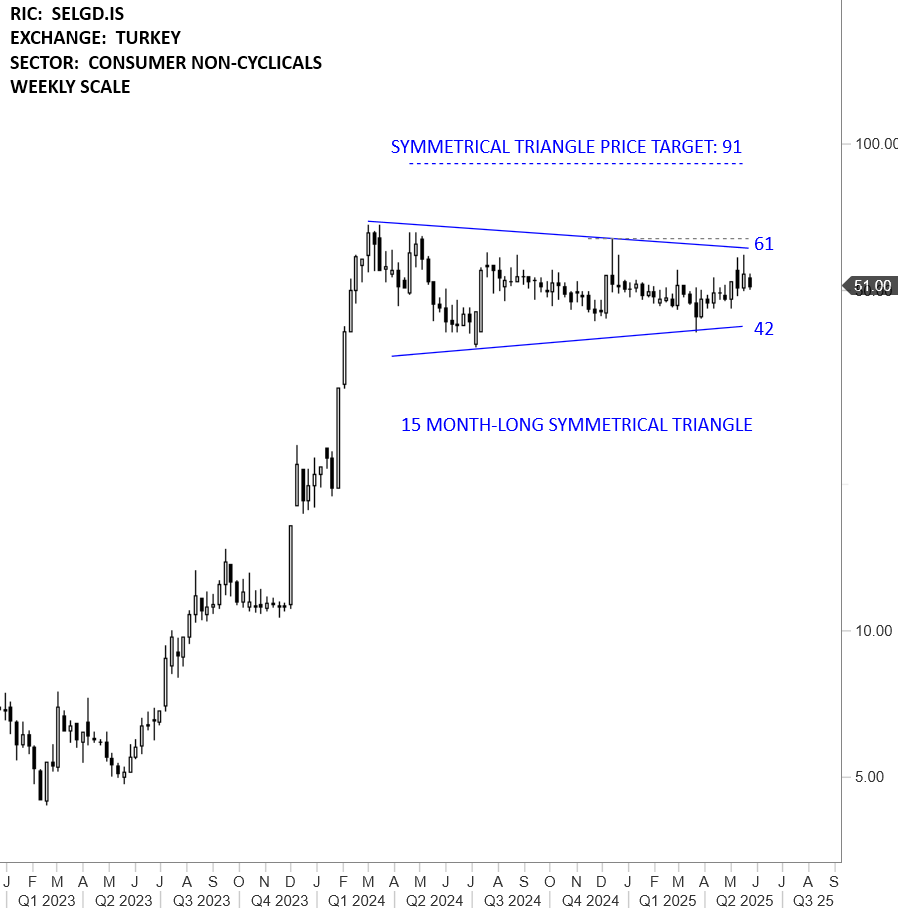
SELCUK GIDA ENDUSTRI IHRACAT ITHALAT AS (SELGD.IS)
Selcuk Gida Endustri Ihracat Ithalat AS is a Turkey-based company active in the food industry sector. The Company is engaged in the processing, packaging, importing and exporting of dried fruit, mainly figs, grapes, apricots, raisins, sour cherries, chestnuts and hazelnuts. The stock is listed on the Istanbul Stock Exchange. Price chart formed a 15 month-long symmetrical triangle with the upper boundary acting as strong resistance at 61.00 levels. The upper boundary was tested several times over the course of the chart pattern. A daily close above 63.80 levels will confirm the breakout from the 15 month-long symmetrical triangle with the possible chart pattern price target of 91.00 levels. (Learn more: Video Tutorial)
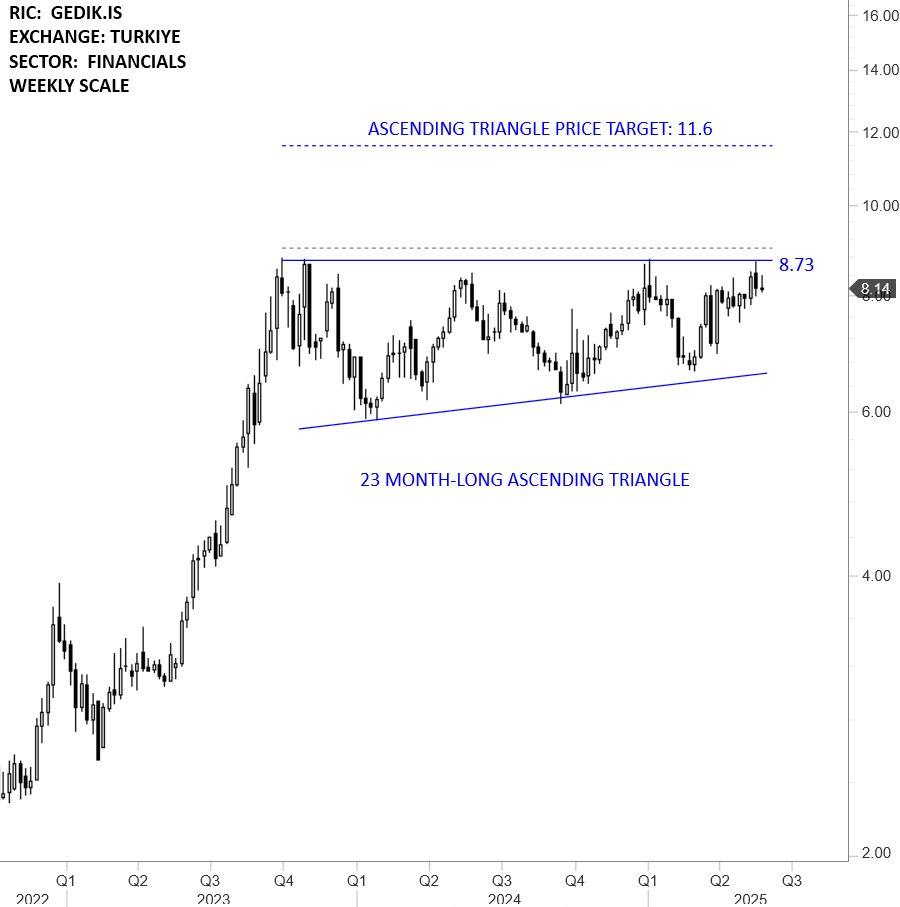
GEDIK YATIRIM MENKUL DEGERLER AS (GEDIK.IS)
Gedik Yatirim Menkul Degerler AS is a Turkey-based brokerage house which provides investment advisory services. The Company’s services include: Equity Trading, On-line Trading, Trading of Fixed-Income Securities, Equity Capital Market Operations, Investment Trust Inc, Asset Management, Futures and Options, Brokerage Services for institutional investors and Investment advisory. The stock is listed on the Istanbul Stock Exchange. Price chart formed a 23 month-long ascending triangle with the horizontal boundary acting as strong resistance at 8.73 levels. The horizontal boundary was tested several times over the course of the chart pattern. A daily close above 9.00 levels will confirm the breakout from the 23 month-long ascending triangle with the possible chart pattern price target of 11.60 levels. (Learn more: Video Tutorial)
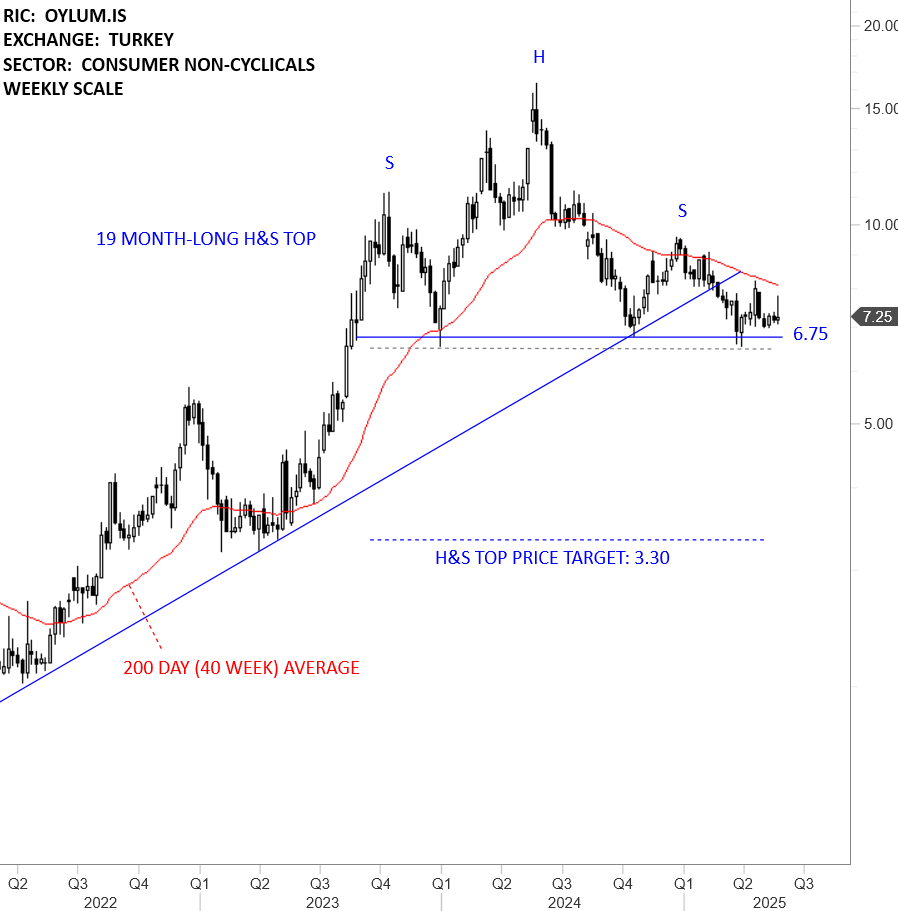
OYLUM SINAI YATIRIMLAR AS (OYLUM.IS)
Oylum Sinai Yatirimlar AS is a Turkey-based company engaged in the food processing sector. The company produces and supplies plain and creamy biscuits; wafers; crackers; praline wafers, and confectionery products, such as chewing gums, jams, candy and halvah products. The stock is listed on the Istanbul Stock Exchange. Price chart formed a 19 month-long head and shoulder top with the horizontal boundary acting as strong support at 6.75 levels. The horizontal boundary was tested several times over the course of the chart pattern. A daily close below 6.50 levels will confirm the breakdown from the 19 month-long head and shoulder top with the possible chart pattern price target of 3.30 levels. (Learn more: Video Tutorial)
ASIA
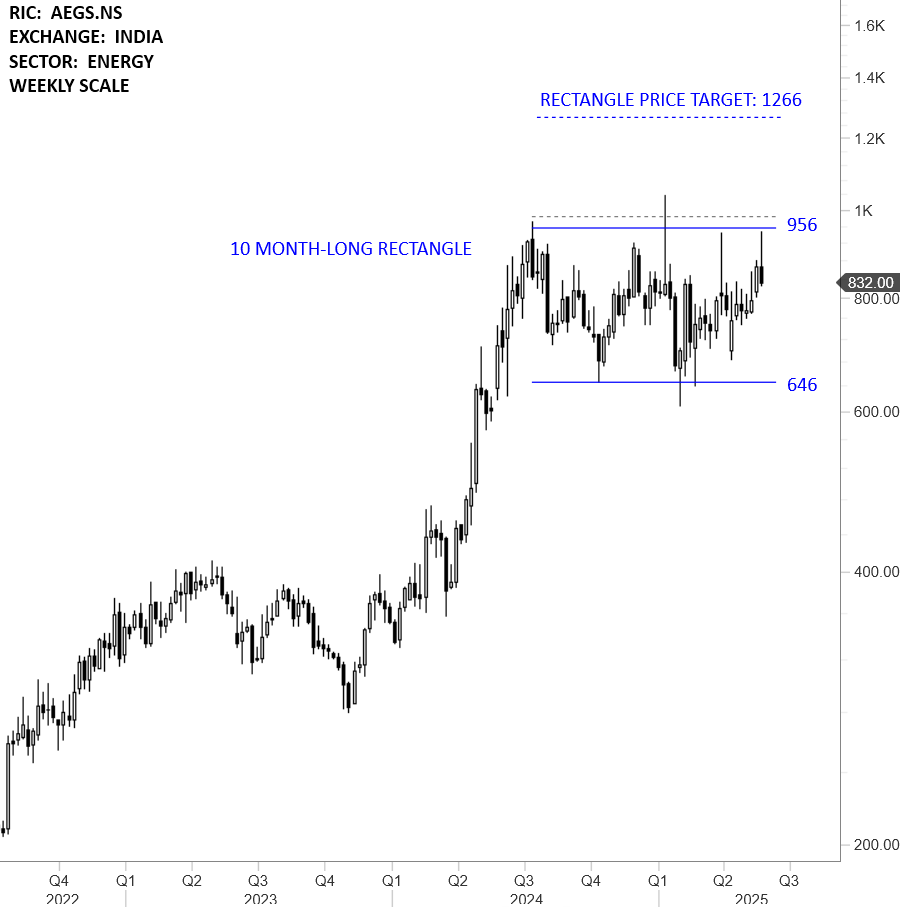
AEGIS LOGISTICS LTD (AEGS.NS) – new addition to watchlist
Aegis Logistics Limited is an India-based integrated oil, gas and chemical logistics company. The Company is engaged in the business of the import and distribution of liquified petroleum gas (LPG) and storage and terminalling facilities for LPG and chemical products. The stock is listed on the National Stock Exchange. Price chart formed a 10 month-long rectangle with the horizontal boundary acting as strong resistance at 956.00 levels. The horizontal boundary was tested several times over the course of the chart pattern. A daily close above 984.00 levels will confirm the breakout from the 10 month-long rectangle with the possible chart pattern price target of 1,266.00 levels. (Learn more: Video Tutorial)
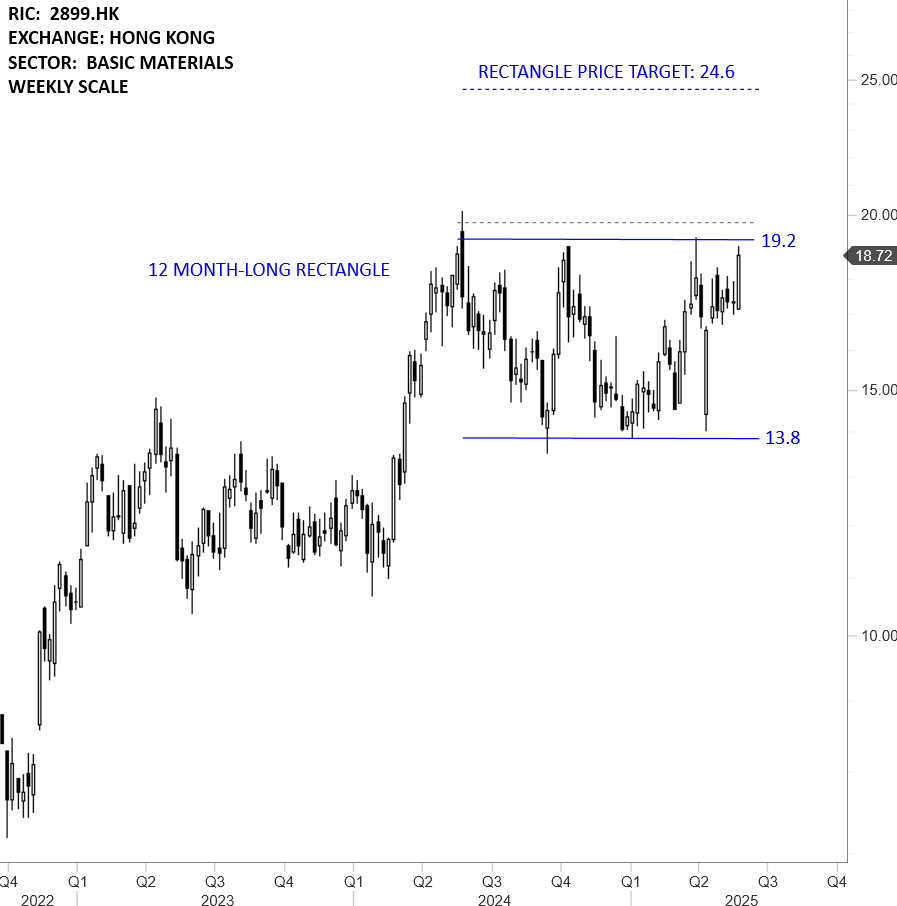
ZIJIN MINING GROUP CO LTD (2899.HK) – new addition to watchlist
Zijin Mining Group Co Ltd is a China-based company mainly engaged in mining business. The stock is listed on the Hong Kong Stock Exchange. Price chart formed a 12 month-long rectangle with the horizontal boundary acting as strong resistance at 19.20 levels. The horizontal boundary was tested several times over the course of the chart pattern. A daily close above 19.75 levels will confirm the breakout from the 12 month-long rectangle with the possible chart pattern price target of 24.60 levels. (Learn more: Video Tutorial)
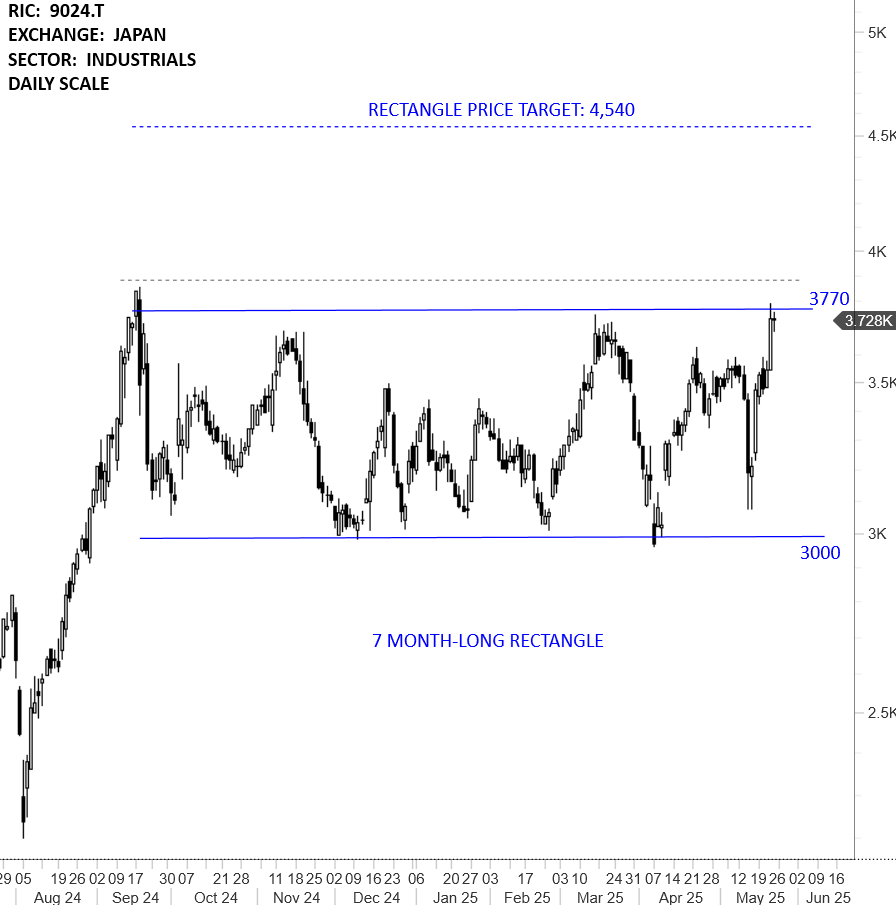
SEIBU HOLDINGS INC (9024.T) – new addition to watchlist
Seibu Holdings, Inc. is a Japan-based holding company which operates in five business segments. Urban Transportation and Regional segment provides passenger transport through trains, buses, and taxis along Seibu rail lines in the Tokyo-Saitama area. Hotel and Leisure segment consists of a varied assortment of facilities in a wide range of fields including hotels, golf courses, ski resorts, and leisure facilities. Real Estate segment is engaged in the development of hotel space, development and operation of stores in train stations, and subdivision of housing, among others. Construction segment is engaged in all types of construction in areas including railway lines, social infrastructure, hotel remodeling, private sector construction, and housing. Hawaii Business segment operates hotels in Hawaii. Other Businesses segment consists of passenger transport in Izuhakone and Ohmi, and the operation of Seibu Lions baseball team. The stock is listed on the Tokyo Stock Exchange. Price chart formed a 7 month-long rectangle with the horizontal boundary acting as strong resistance at 3,770.00 levels. The horizontal boundary was tested several times over the course of the chart pattern. A daily close above 3,883.00 levels will confirm the breakout from the 7 month-long rectangle with the possible chart pattern price target of 4,540.00 levels. (Learn more: Video Tutorial)
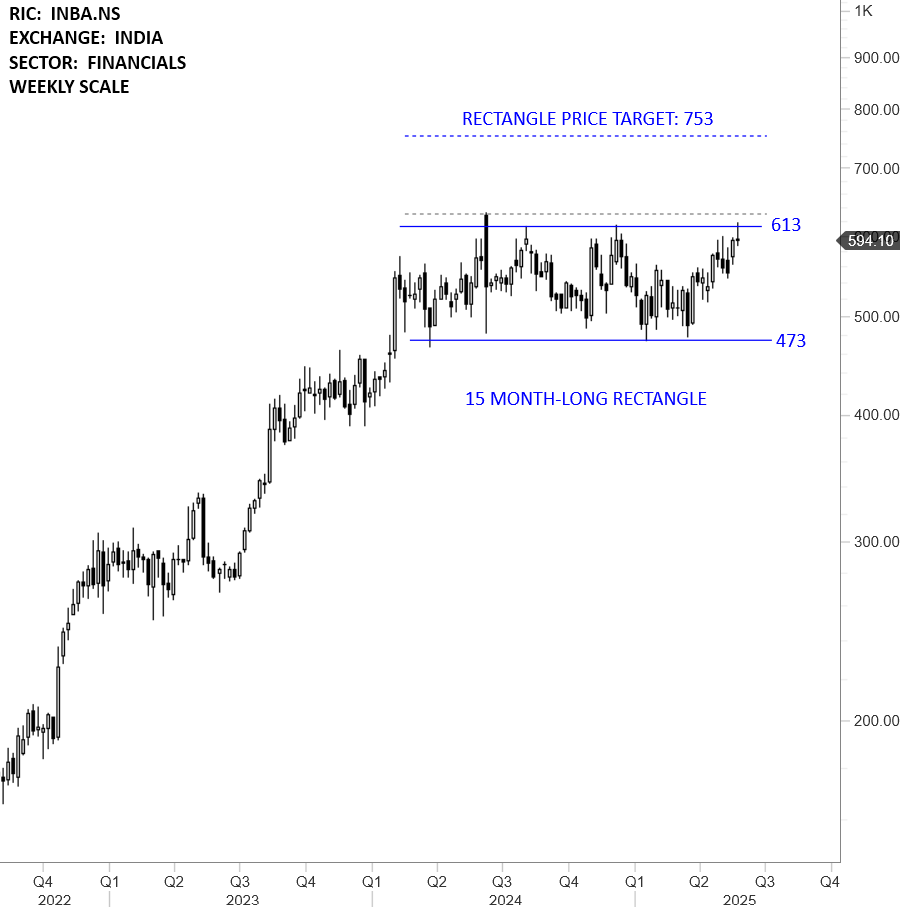
INDIAN BANK (INBA.NS)
Indian Bank is an India-based public sector bank. Its segments include Treasury, Corporate/Wholesale Banking, Retail Banking and Other Banking Business. The stock is listed on the National Stock Exchange. Price chart formed a 15 month-long rectangle with the horizontal boundary acting as strong resistance at 613.00 levels. The horizontal boundary was tested several times over the course of the chart pattern. A daily close above 631.00 levels will confirm the breakout from the 15 month-long rectangle with the possible chart pattern price target of 753.00 levels. (Learn more: Video Tutorial)
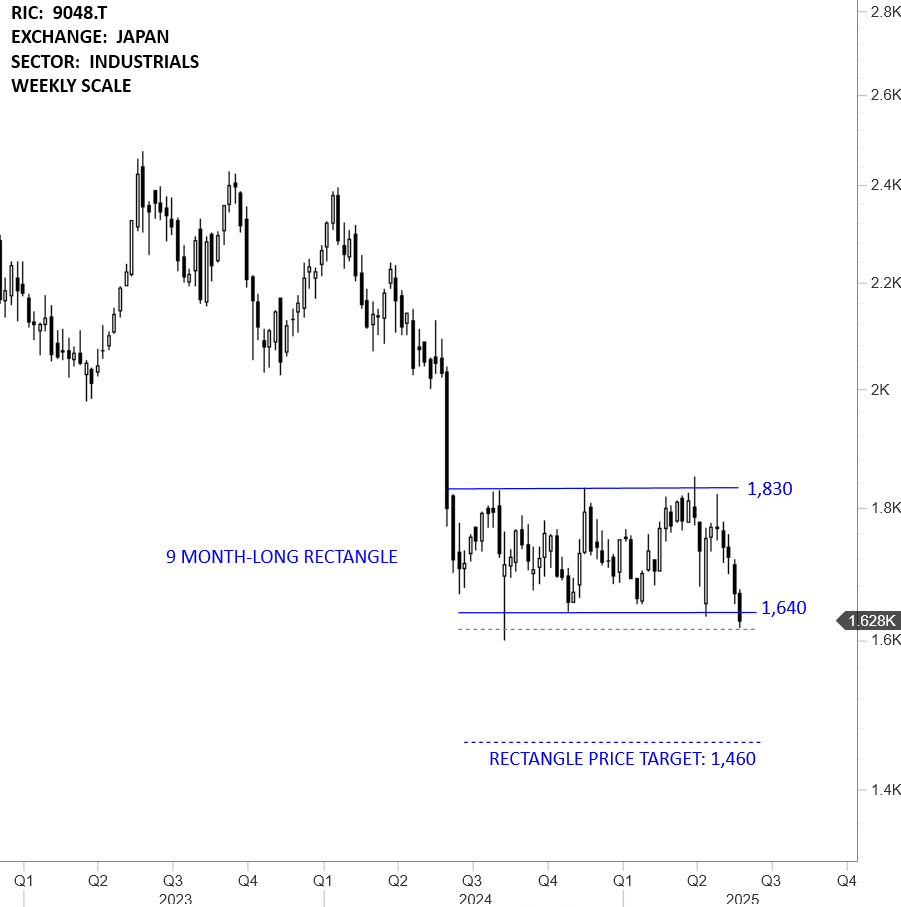
NAGOYA RAILROAD CO LTD (9048.T)
Nagoya Railroad Co., Ltd. is mainly engaged in the provision of transportation services. The stock is listed on the Tokyo Stock Exchange. Price chart formed a 9 month-long rectangle with the horizontal boundary acting as strong support at 1,640.00 levels. The horizontal boundary was tested several times over the course of the chart pattern. A daily close below 1,615.00 levels will confirm the breakdown from the 9 month-long rectangle with the possible chart pattern price target of 1,460.00 levels. (Learn more: Video Tutorial)
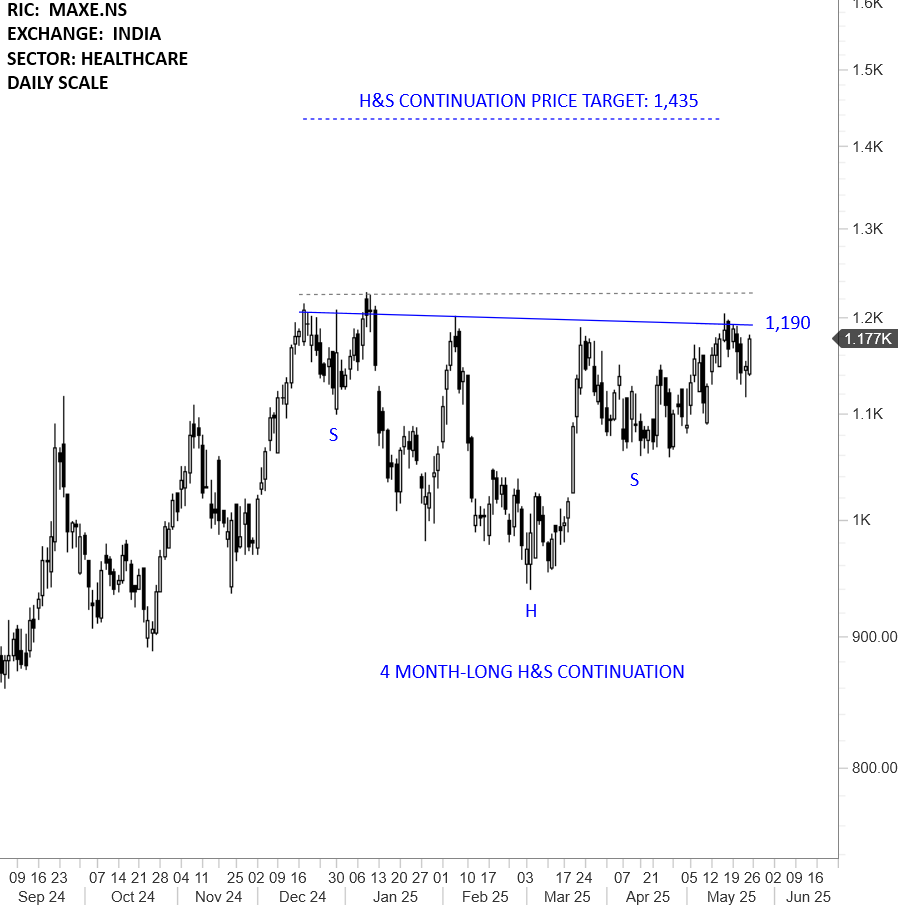
MAX HEALTHCARE INSTITUTE LTD (MAXE.NS)
Max Healthcare Institute Limited is an India-based integrated healthcare provider. The Company operates through a single segment, which is Medical and Healthcare Services. The stock is listed on the National Stock Exchange. Price chart formed a 4 month-long head and shoulder continuation with the (almost) horizontal boundary acting as strong resistance at 1,190.00 levels. The horizontal boundary was tested several times over the course of the chart pattern. A daily close above 1,225.00 levels will confirm the breakout from the 4 month-long head and shoulder continuation with the possible chart pattern price target of 1,435.00 levels. (Learn more: Video Tutorial)
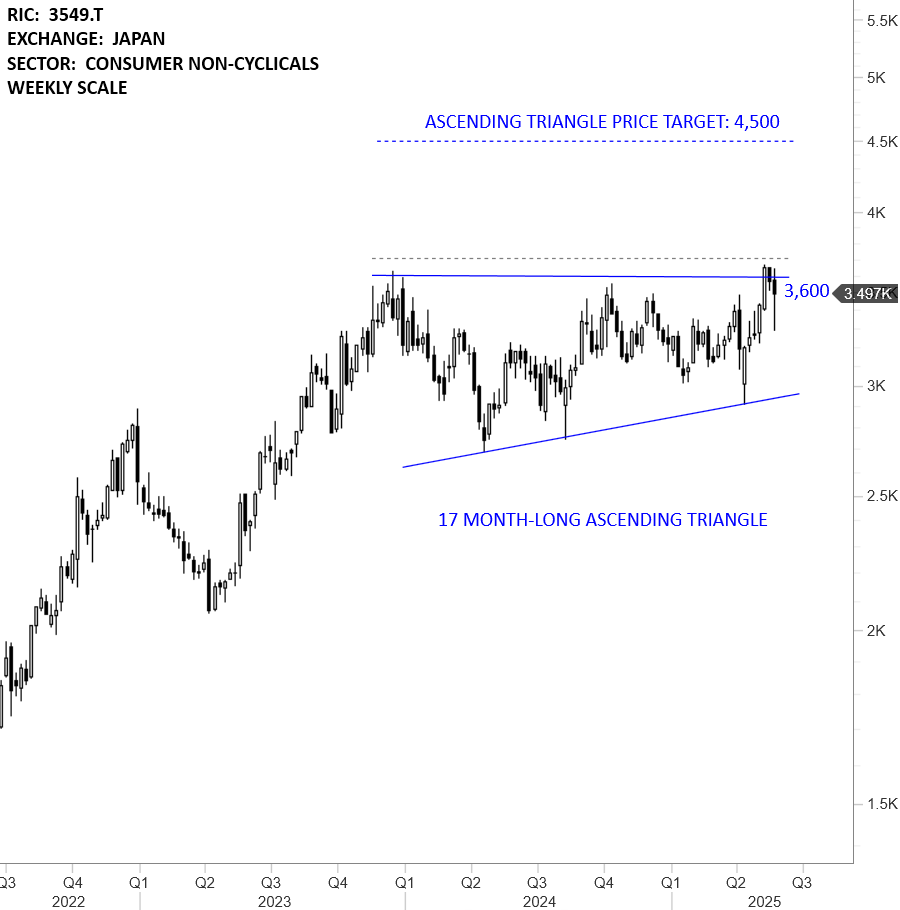
KUSURI NO AOKI HOLDINGS CO LTD (3549.T)
Kusuri No Aoki Holdings Co Ltd is a Japan-based company mainly engaged in the neighborhood-type retail business of pharmaceuticals, cosmetics, daily necessities, foods, and dispensing pharmacies. The Company operates drugstore business with an assortment of products that include daily necessities, with pharmaceuticals and cosmetics as core products. The stock is listed on the Nikkei Stock Exchange. Price chart formed a 17 month-long ascending triangle with the horizontal boundary acting as strong resistance at 3,600.00 levels. The horizontal boundary was tested several times over the course of the chart pattern. A daily close above 3,705.00 levels will confirm the breakout from the 17 month-long ascending triangle with the possible chart pattern price target of 4,500.00 levels. (Learn more: Video Tutorial)
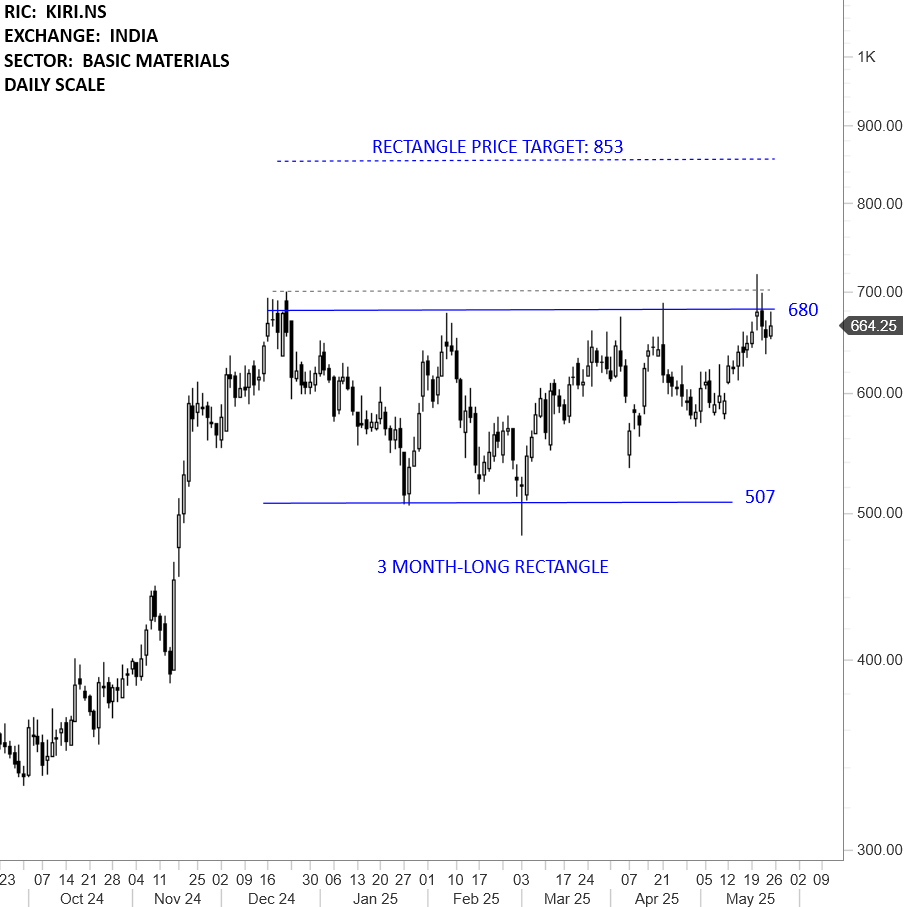
KIRI INDUSTRIES LTD (KIRI.NS)
Kiri Industries Limited is an India-based manufacturer and exporter of a range of dyes, dyes intermediates and basic chemicals. The stock is listed on the National Stock Exchange. Price chart formed a 3 month-long rectangle with the horizontal boundary acting as strong resistance at 680.00 levels. The horizontal boundary was tested several times over the course of the chart pattern. A daily close above 700.00 levels will confirm the breakout from the 3 month-long rectangle with the possible chart pattern price target of 853.00 levels. (Learn more: Video Tutorial)
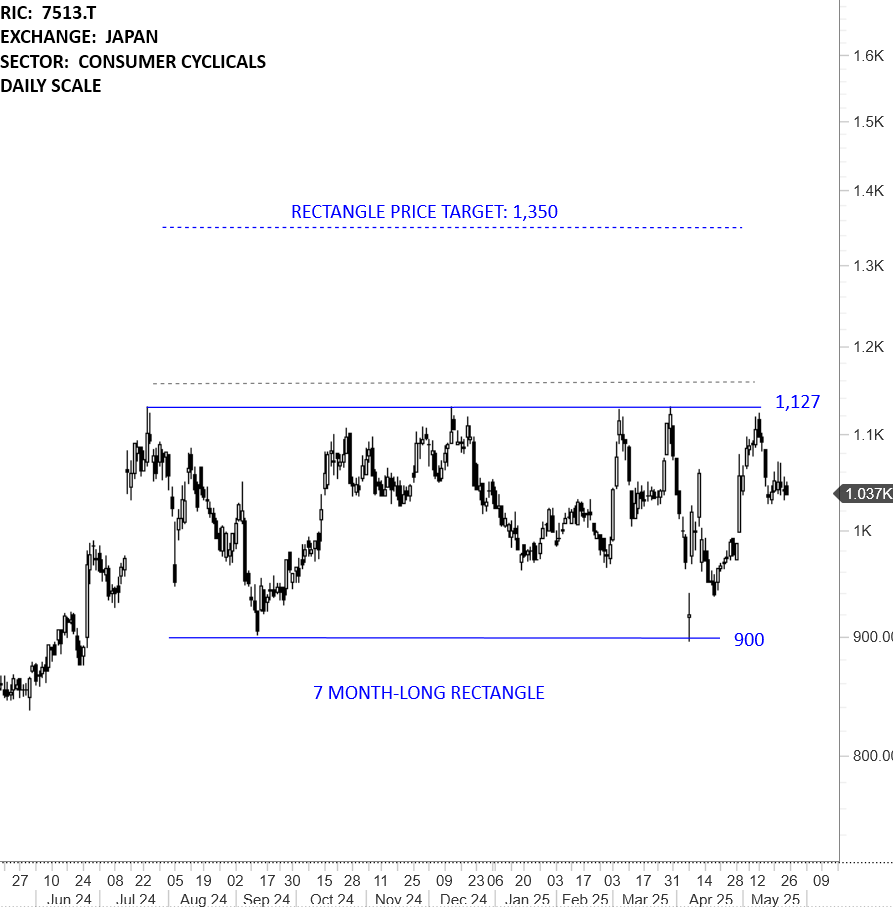
KOJIMA CO LTD (7513.T)
Kojima Co Ltd is a Japan-based company mainly engaged in the sales of home appliances and other products. The Company operates the Product Sales business segment of audio-visual products, home appliances, information and communication equipment products, and others. The stock is listed on the Tokyo Stock Exchange. Price chart formed a 7 month-long rectangle with the horizontal boundary acting as strong resistance at 1,127.00 levels. The horizontal boundary was tested several times over the course of the chart pattern. A daily close above 1,160.00 levels will confirm the breakout from the 7 month-long rectangle with the possible chart pattern price target of 1,350.00 levels. (Learn more: Video Tutorial)
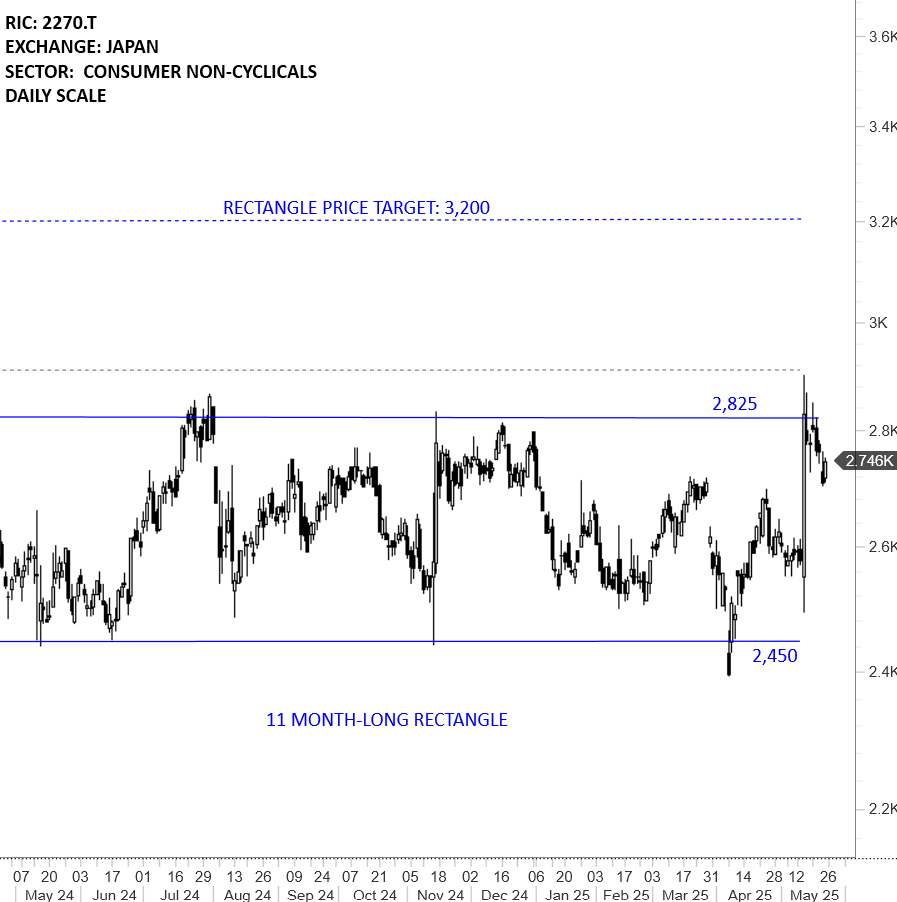
MEGMILK SNOW BRAND CO LTD (2270.T)
MEGMILK SNOW BRAND Co., Ltd. is a company mainly engaged in the dairy products and beverage business. The stock is listed on the Tokyo Stock Exchange. Price chart formed an 11 month-long rectangle with the horizontal boundary acting as strong resistance at 2,825.00 levels. The horizontal boundary was tested several times over the course of the chart pattern. A daily close above 2,910.00 levels will confirm the breakout from the 11 month-long rectangle with the possible chart pattern price target of 3,200.00 levels. (Learn more: Video Tutorial)