
SPDR S & P INTERNATIONAL DIVIDEND ETF (DWX)
Every week Tech Charts Global Equity Markets report features some of the well-defined, mature classical chart patterns under a lengthy watchlist and the chart pattern breakout signals that took place during that week. Global Equity Markets report covers single stocks from developed, emerging and frontier markets, ETF’s, select commodities, cryptocurrencies and global equity indices. Below chart, SPDR S & P INTERNATIONAL DIVIDEND ETF (DWX) is from the watchlist sections of the weekly report. The ETF is possibly forming 2 different H&S continuation chart patterns.
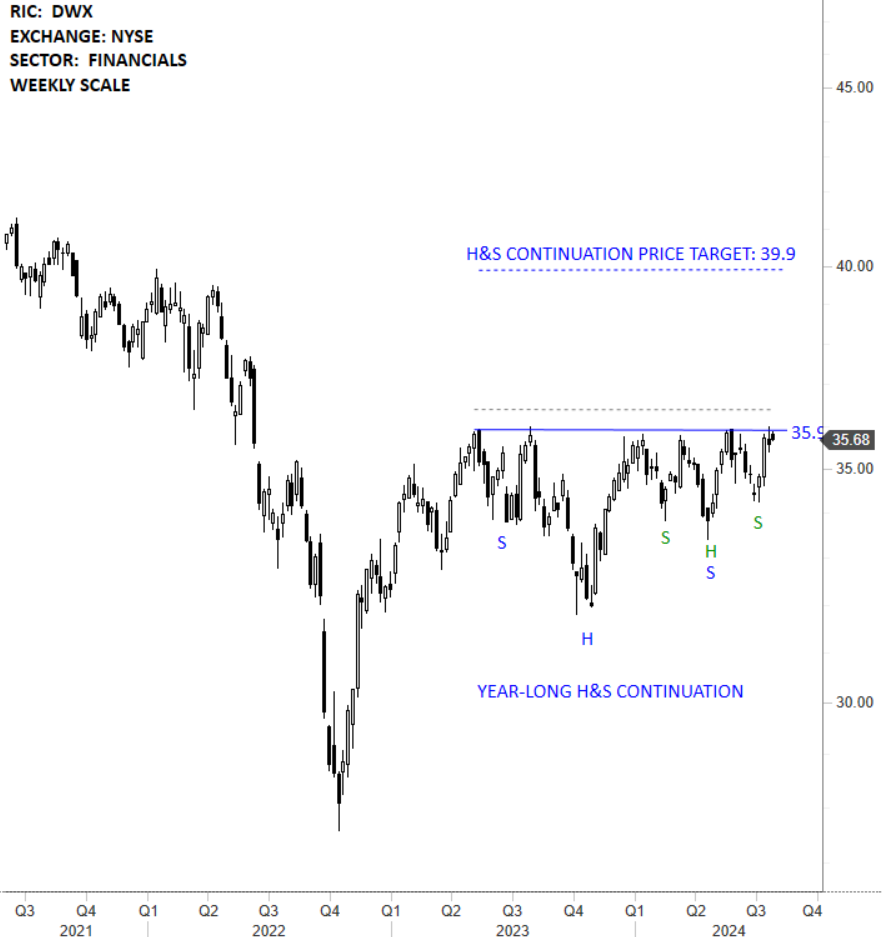
SPDR S & P INTERNATIONAL DIVIDEND ETF (DWX)
The SPDR® S&P® International Dividend ETF seeks to provide investment results that, before fees and expenses, correspond generally to the total return performance of the S&P® International Dividend Opportunities® Index (the “Index”). The ETF is listed on the New York Stock Exchange. It seeks to provide exposure to the 100 highest yielding international common stocks that have passed certain sustainability and earnings growth screens. Price chart formed a 12 month-long head and shoulder continuation with the horizontal boundary acting as strong resistance at 35.90 levels. The horizontal boundary was tested several times over the course of the chart pattern. A daily close above 36.40 levels will confirm the breakout from the 12 month-long head and shoulder continuation with the possible chart pattern price target of 39.90 levels. The right shoulder can be analyzed as a separate H&S continuation chart pattern with the same neckline. Breakout can complete both chart patterns which can become a high conviction signal. (Learn more: Video Tutorial)
I have discussed H&S continuation chart patterns and their validity in this interactive blog post. (Learn More about H&S continuation)
Tech Charts Membership

By becoming a Premium Member, you’ll be able to improve your knowledge of the principles of classical charting.
With this knowledge, you can merge them with your investing system. In fact, some investors use my analyses to modify their existing style to invest more efficiently and successfully.

As a Premium Member of Aksel Kibar’s Tech Charts,
You will receive:
-
Global Equities Report. Delivered weekly.
-
Classical charting principles. Learn patterns and setups.
-
Actionable information. Worldwide indices and stocks of interest.
-
Risk management advice. The important trading points of each chart.
-
Information on breakout opportunities. Identify the ones you want to take action on.
-
Video tutorials. How patterns form and why they succeed or fail.
-
Watch list alerts. As they become available so you can act quickly.
-
Breakout alerts. Usually once a week.
-
Access to everything (now and as it becomes available)o Reports
o Videos and video series -
Multi-part webinar course. You learn the 8 most common charting principles.
-
Webinars. Actionable and timely advice on breaking out chart patterns.
For your convenience your membership auto renews each year.


