GLOBAL EQUITY MARKETS – July 14, 2018
REVIEW
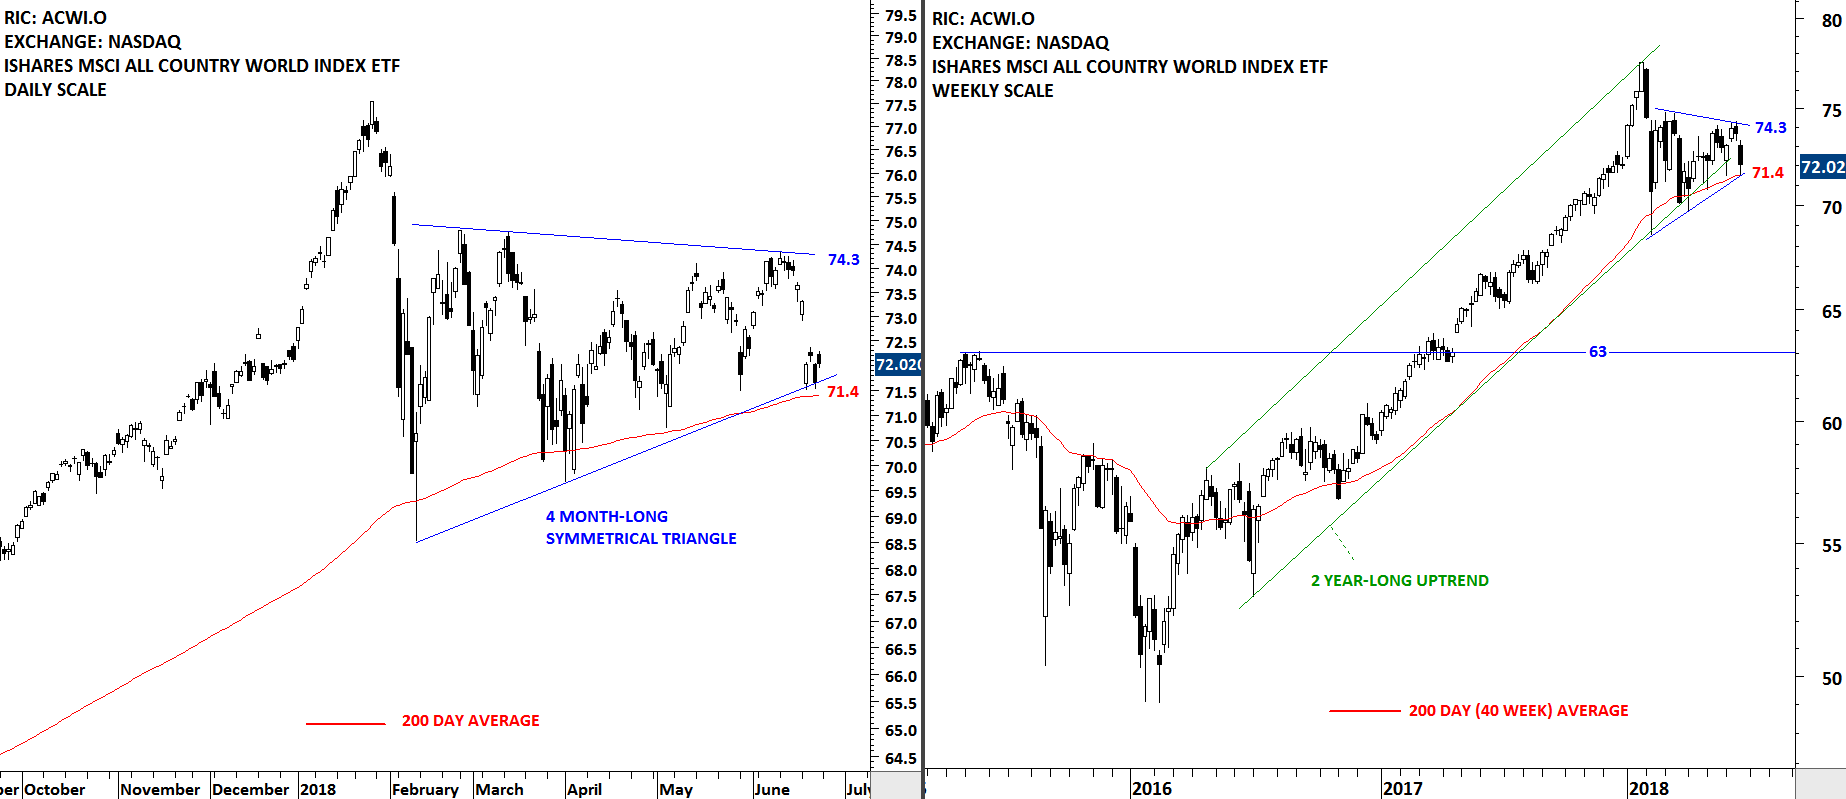
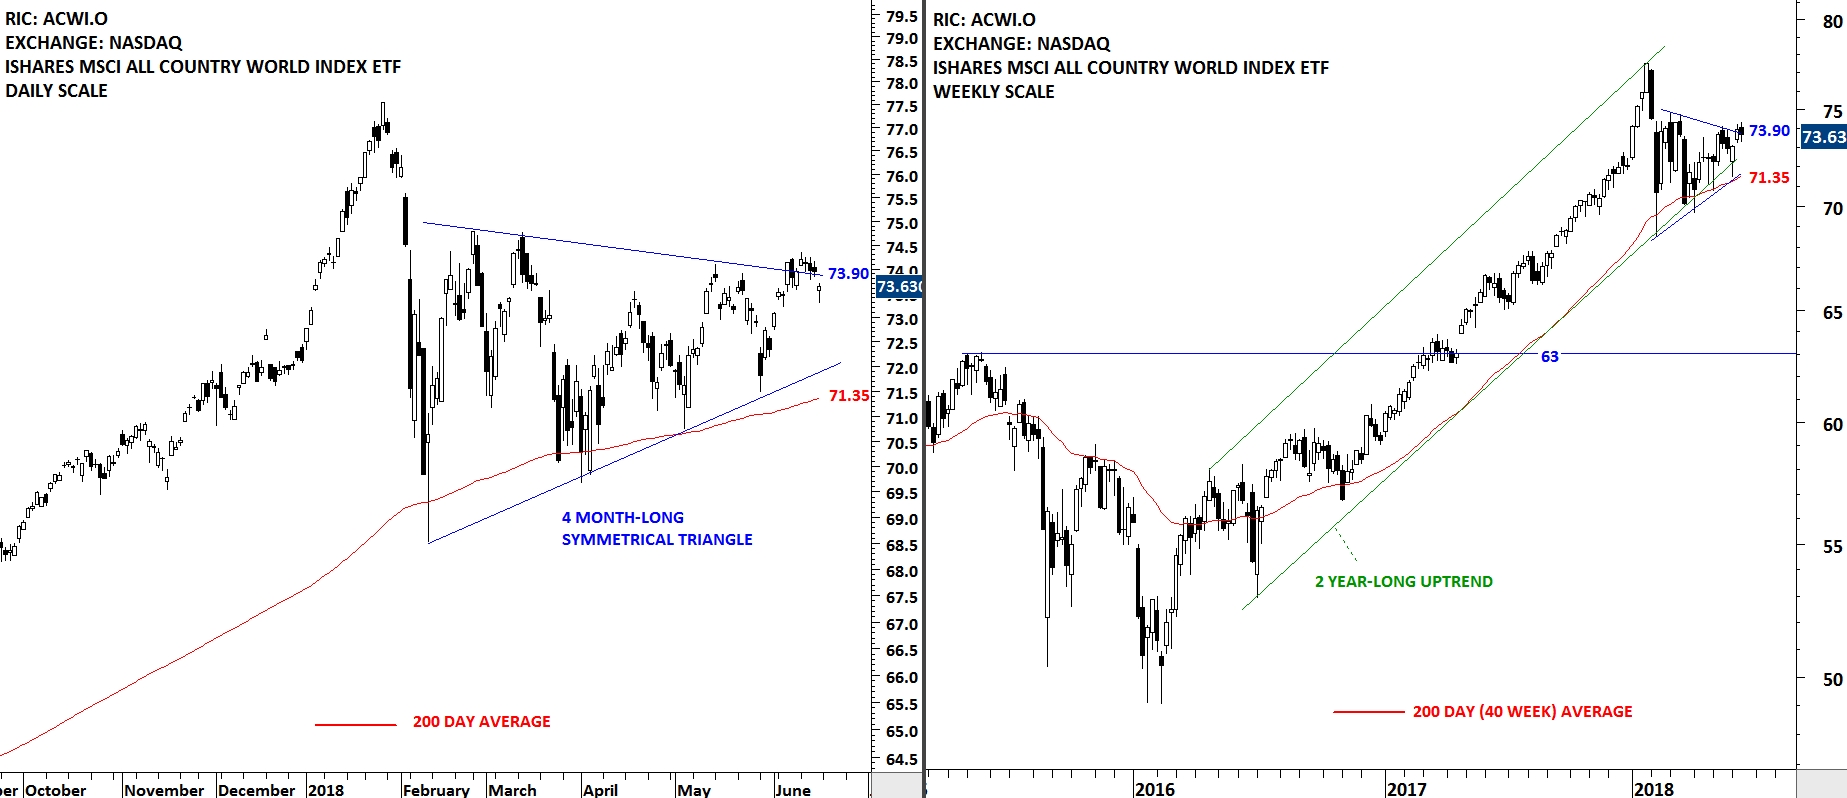
Until a chart pattern is mature and ready to resolve in one direction we have to make minor adjustments to the chart pattern boundaries. (Learn more: Morphology) Dealing with chart patterns and breakouts in real-time is difficult compared to labeling chart patterns on price charts in hindsight. Corrective periods are more tricky compared to trend periods because market corrections are periods of indecision between buyers and sellers whereas trend periods show consensus. The iShares MSCI All Country World Index ETF (ACWI.O) is going through a corrective period. The 5 month-long choppy sideways movement is possibly forming a symmetrical triangle between the boundaries of 70.4 and 74. This week's price action pushed the ETF above its long-term average. For the long-term uptrend to resume, price should remain above the 200 day-average.