GLOBAL EQUITY MARKETS – October 20, 2018
REVIEW
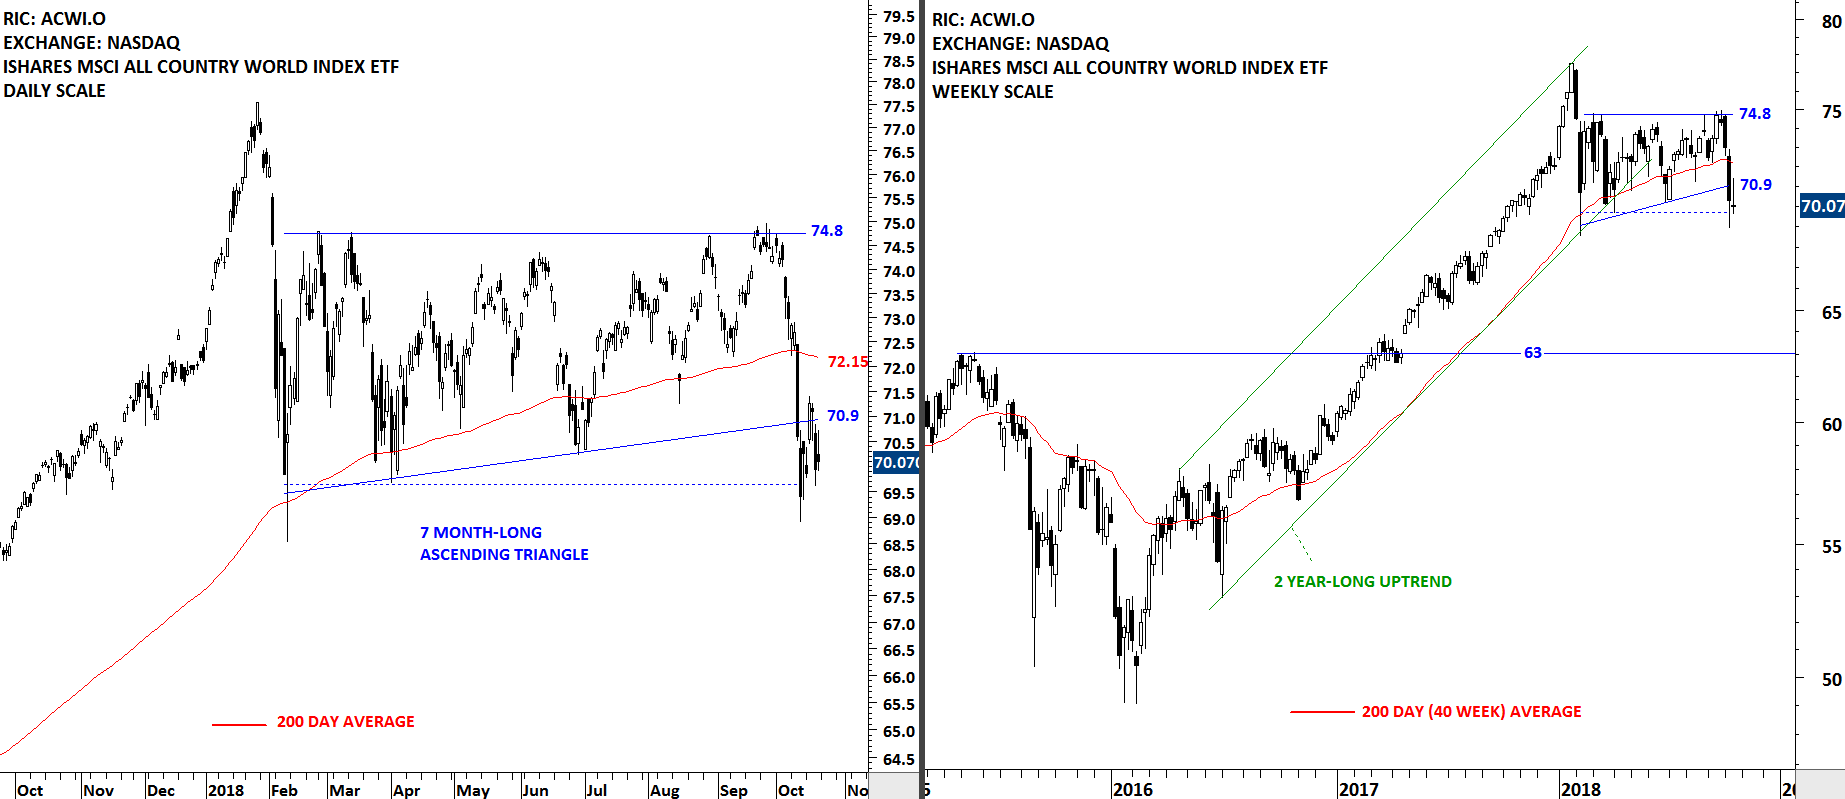
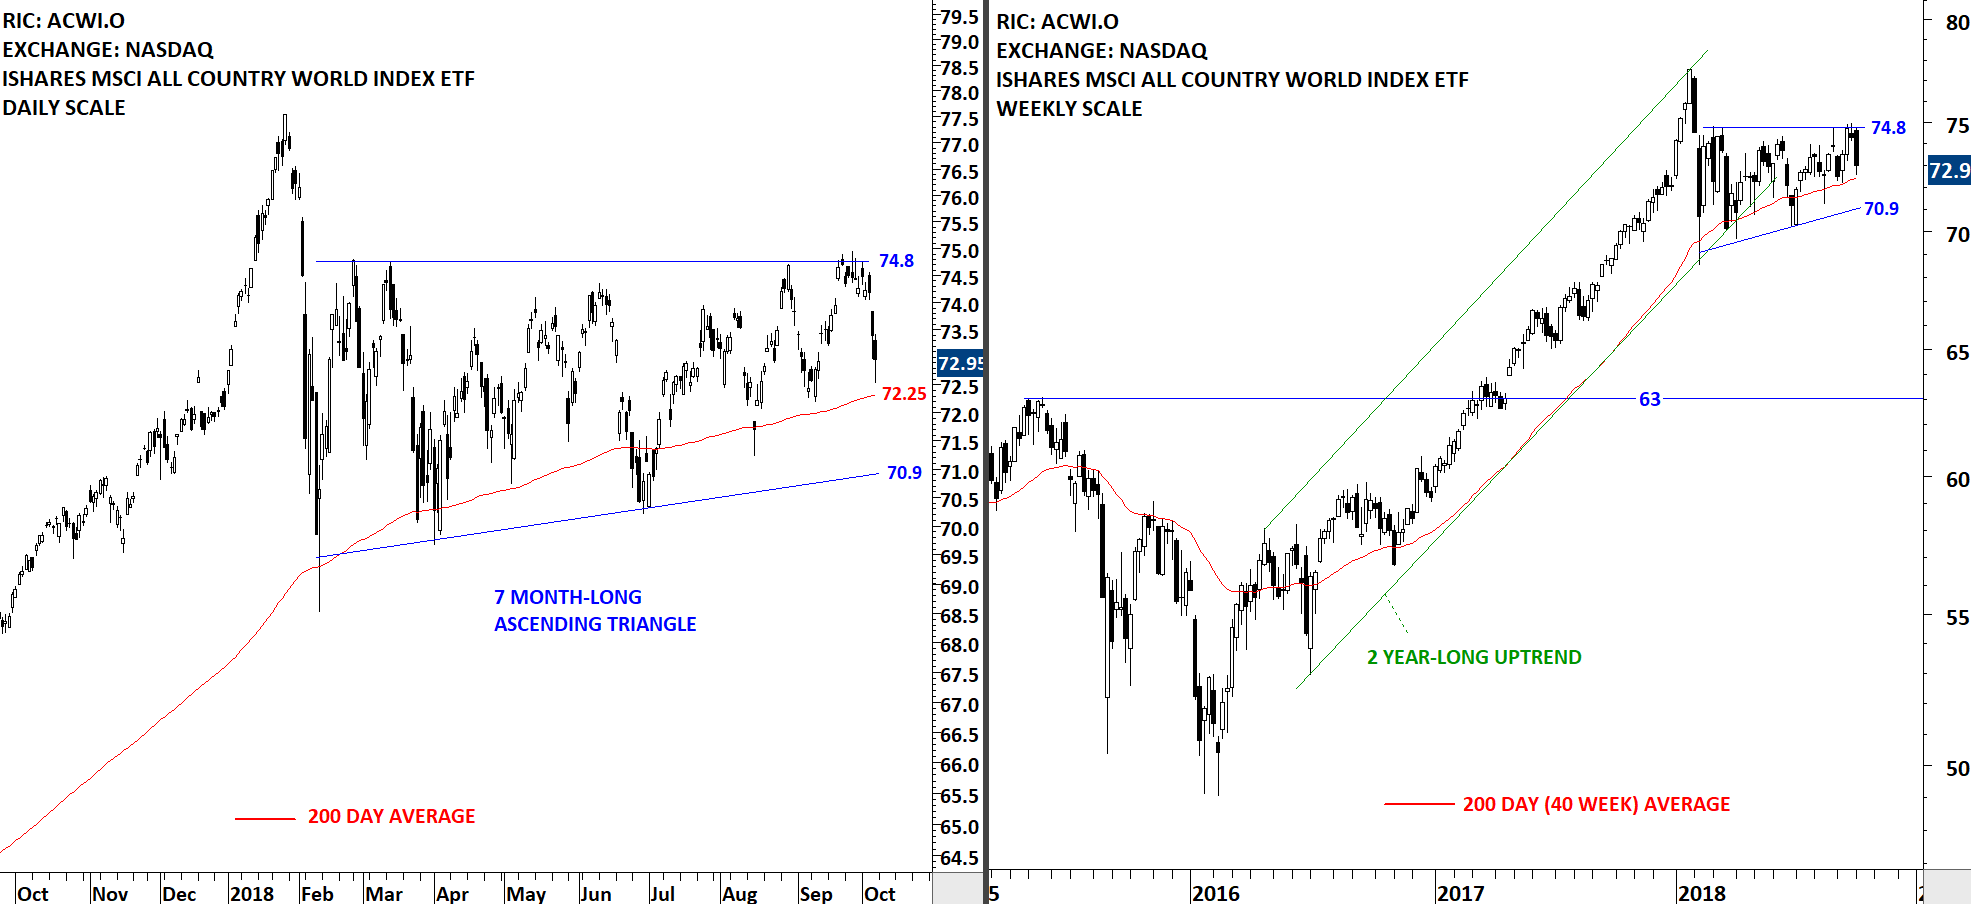
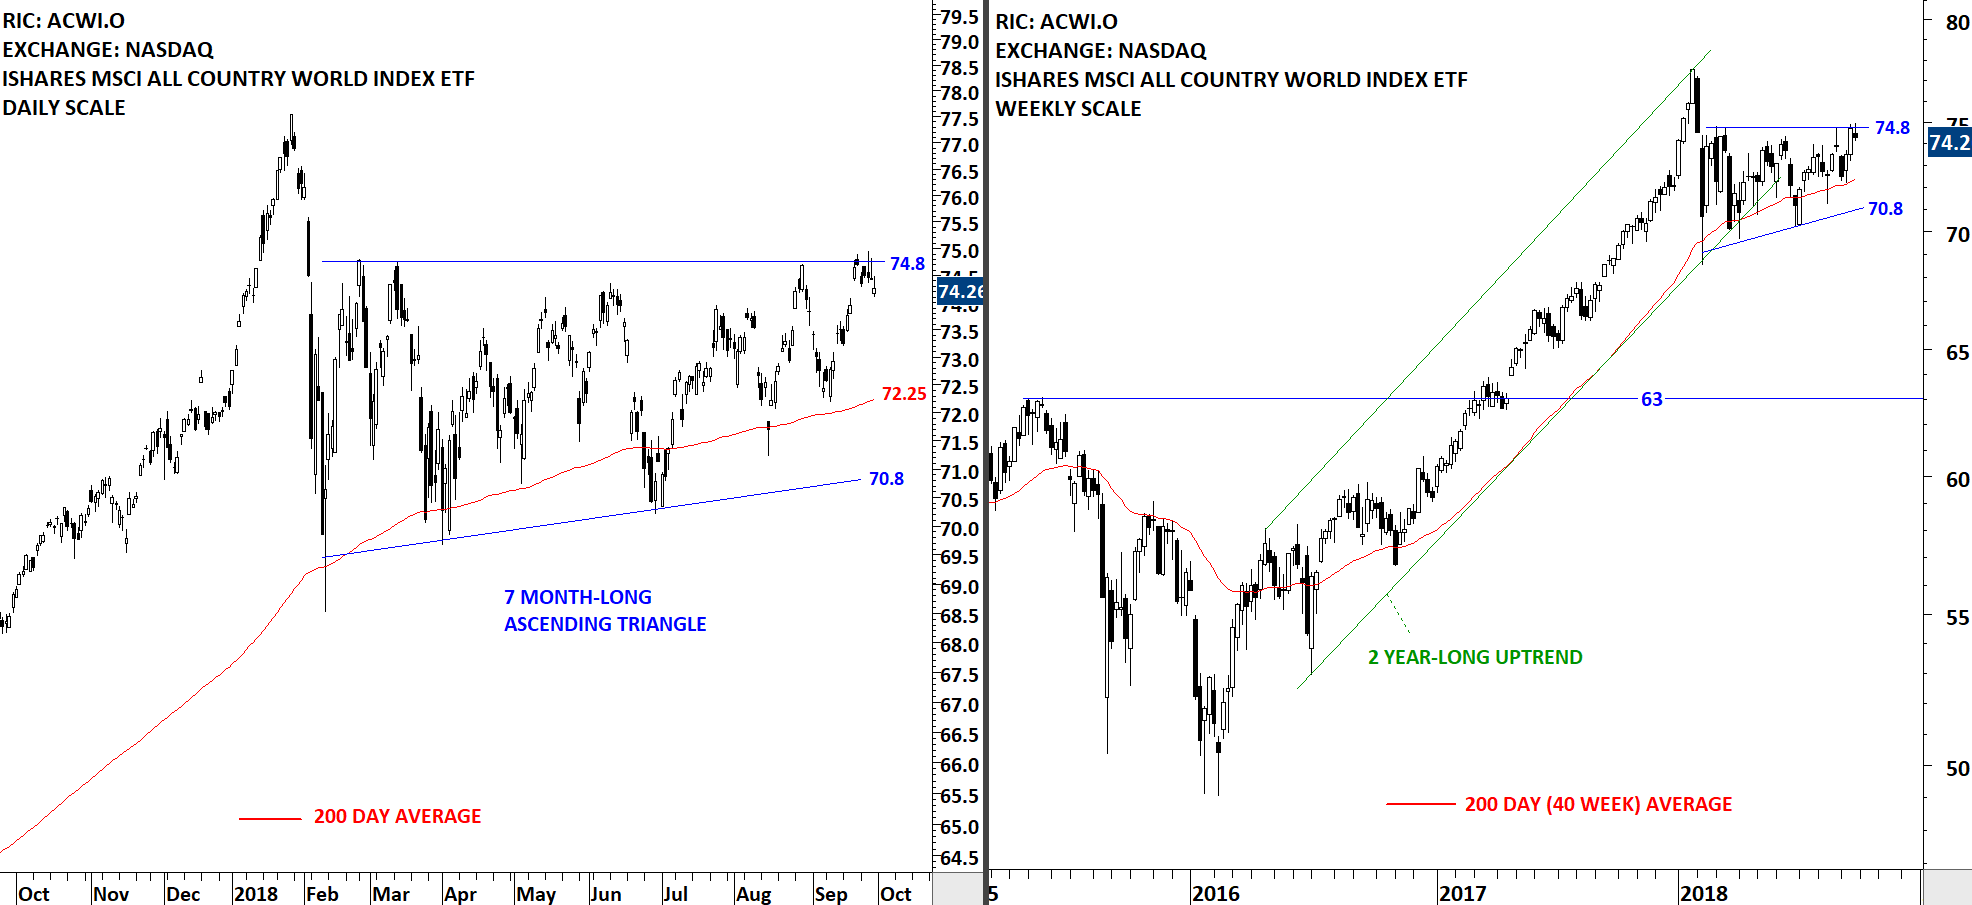
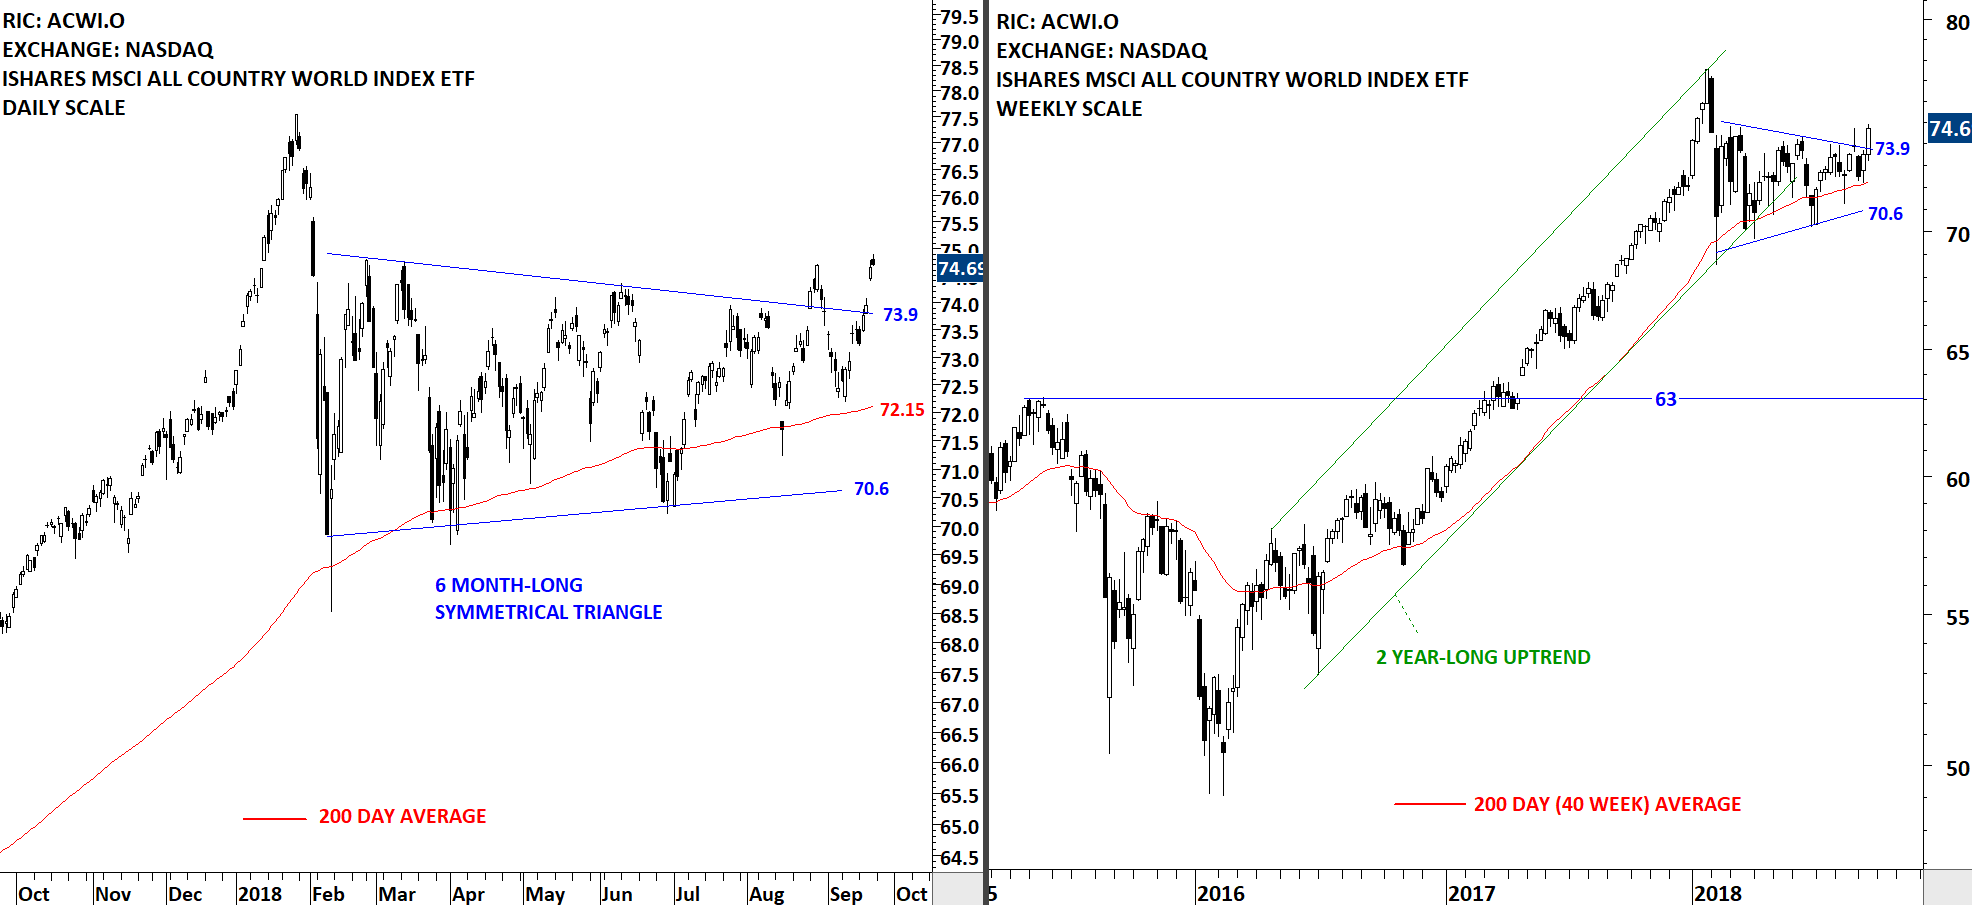
The iShares MSCI All Country World Index ETF (ACWI.O) is trying to hold above February 2018 lows. After reversing from the horizontal resistance at 74.8, the ETF fell below its long-term average and currently is trading below the 200-day average. This week's candlestick was a "doji". It shows that price found short-term support. Failure to hold above February lows can send the ETF towards the next strong support area at 63 levels.