GLOBAL EQUITY MARKETS – February 23, 2019
REVIEW
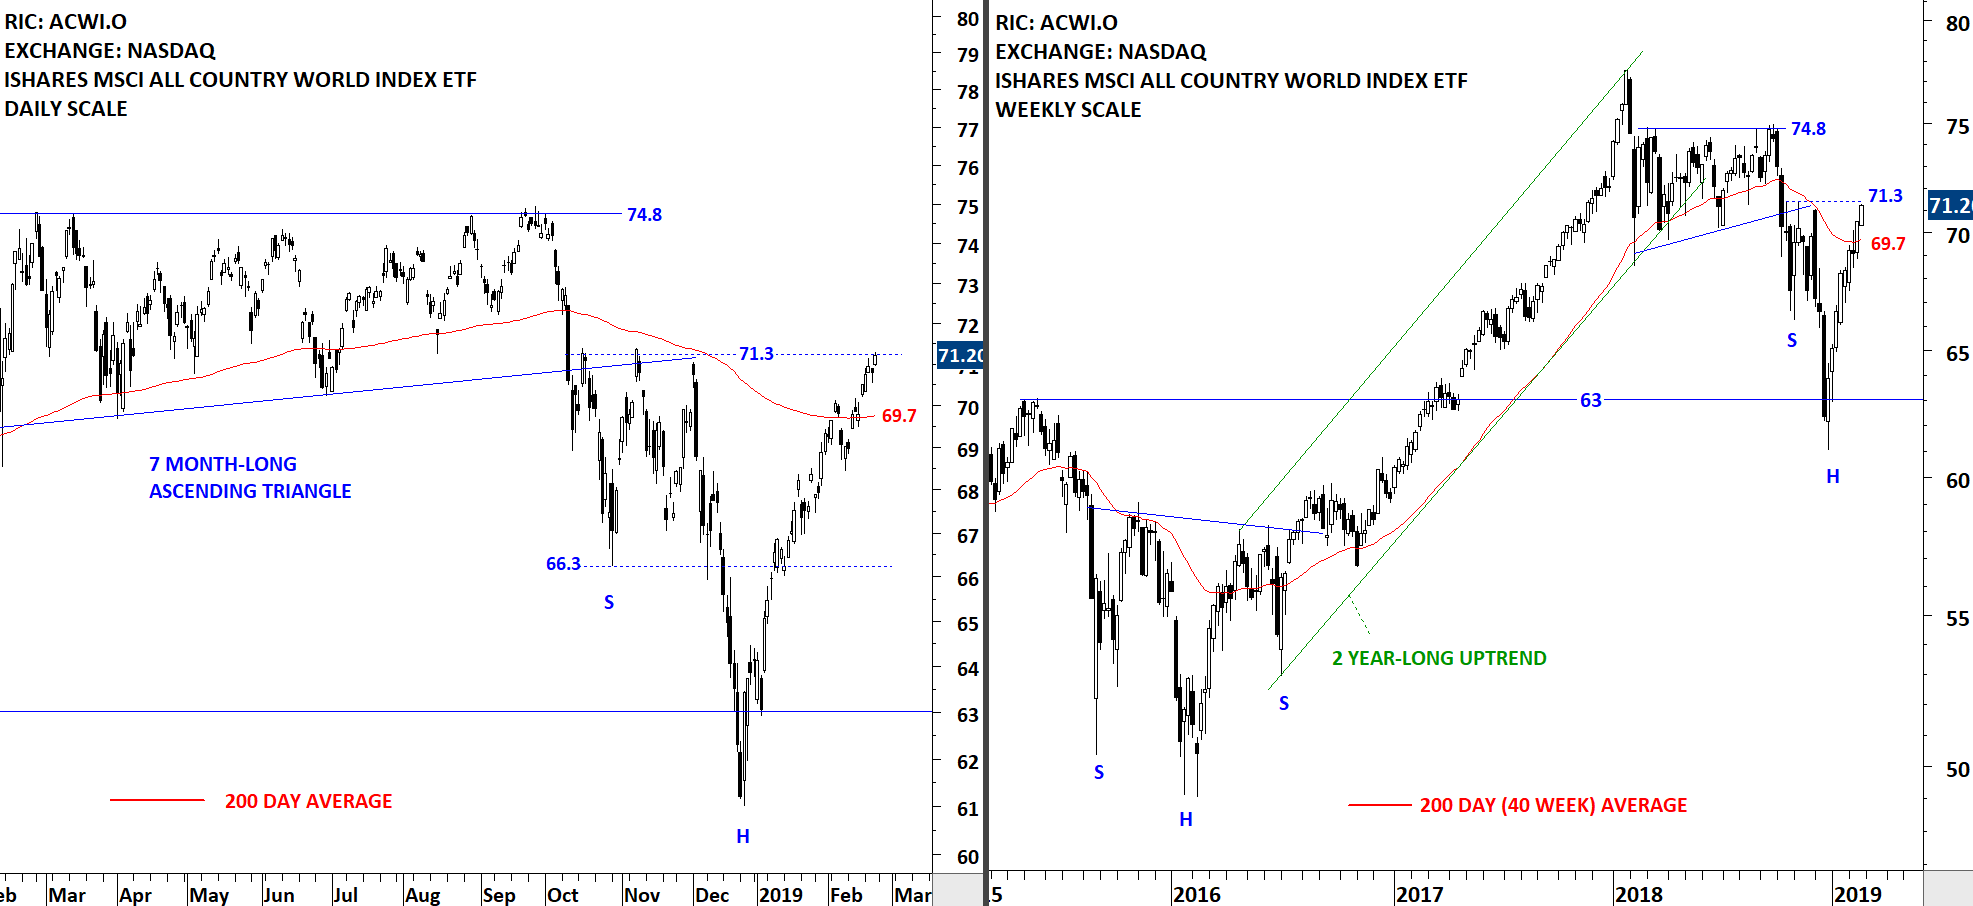
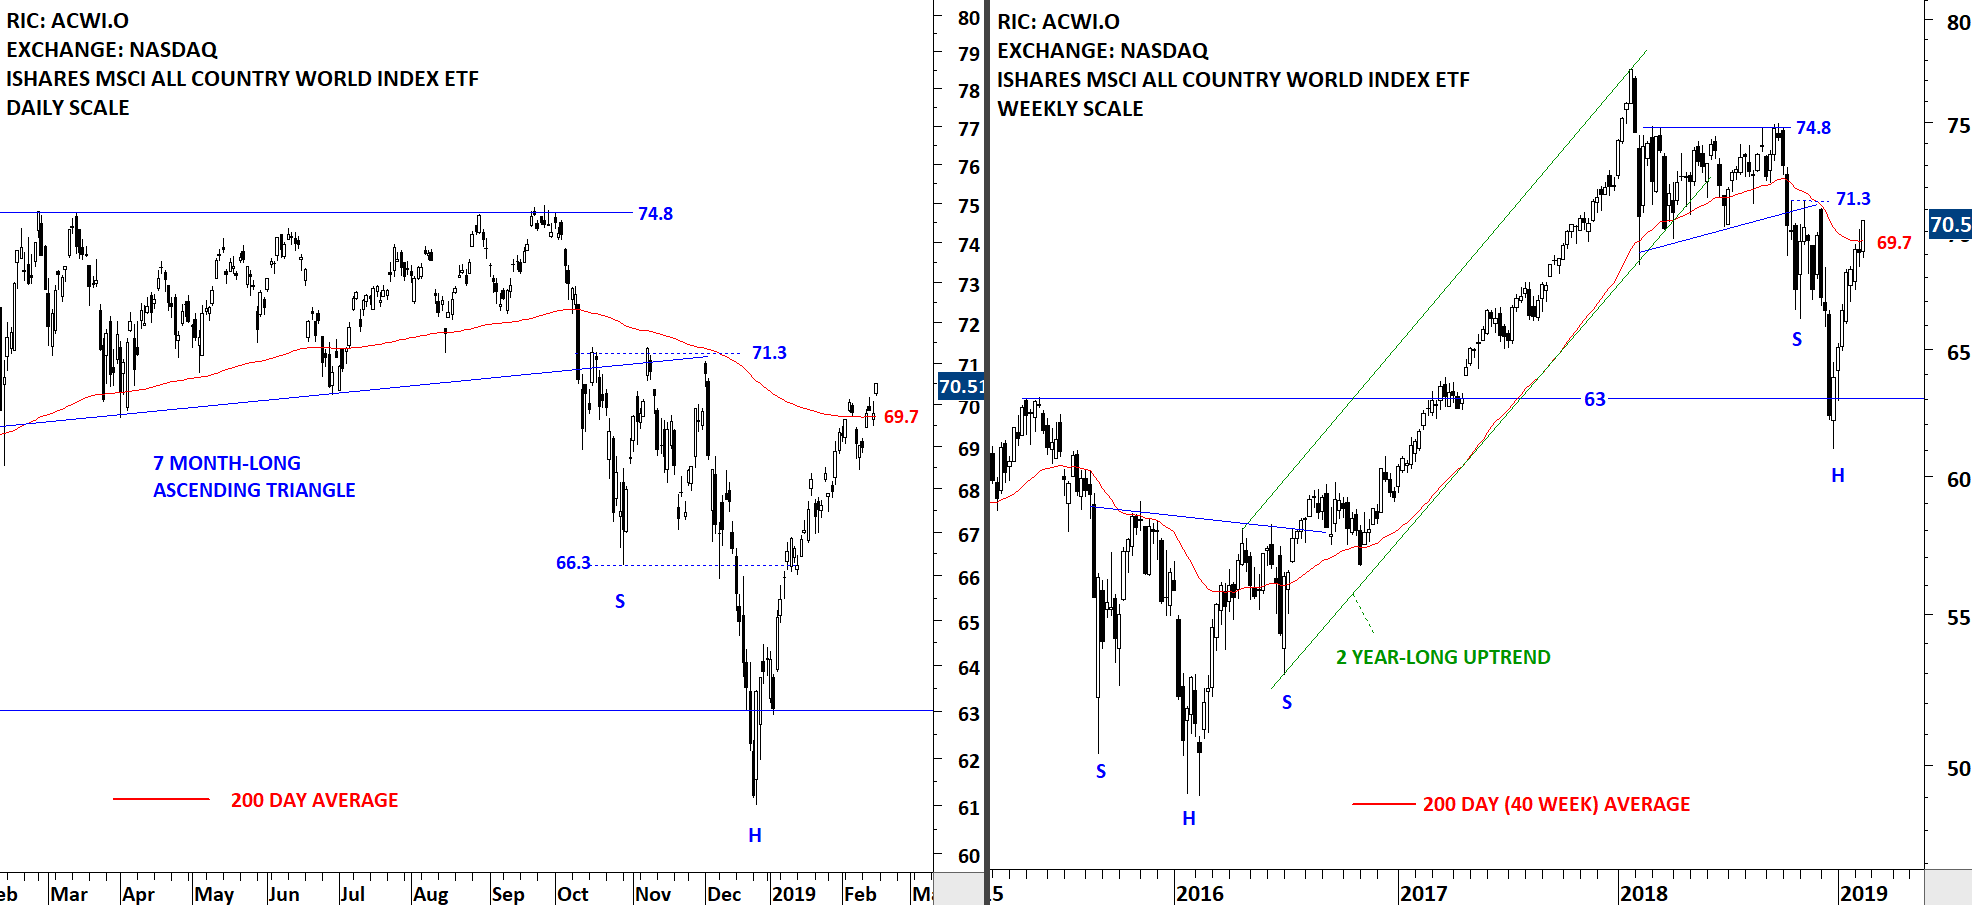
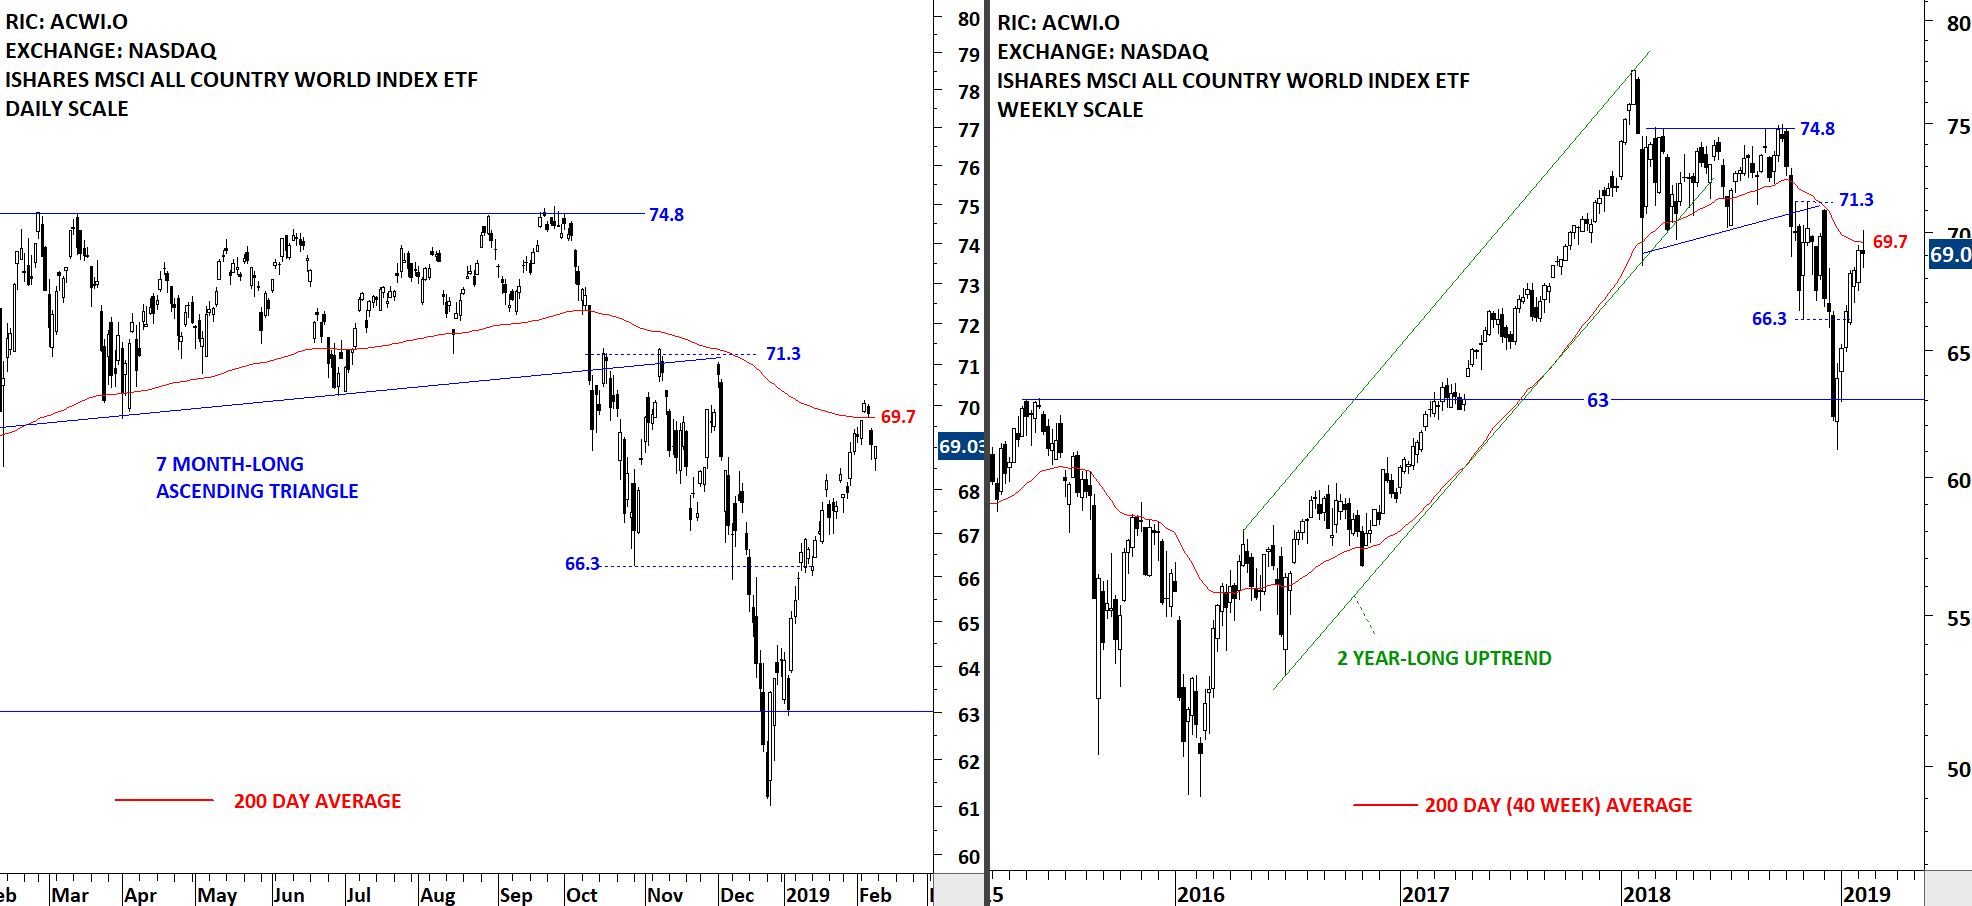
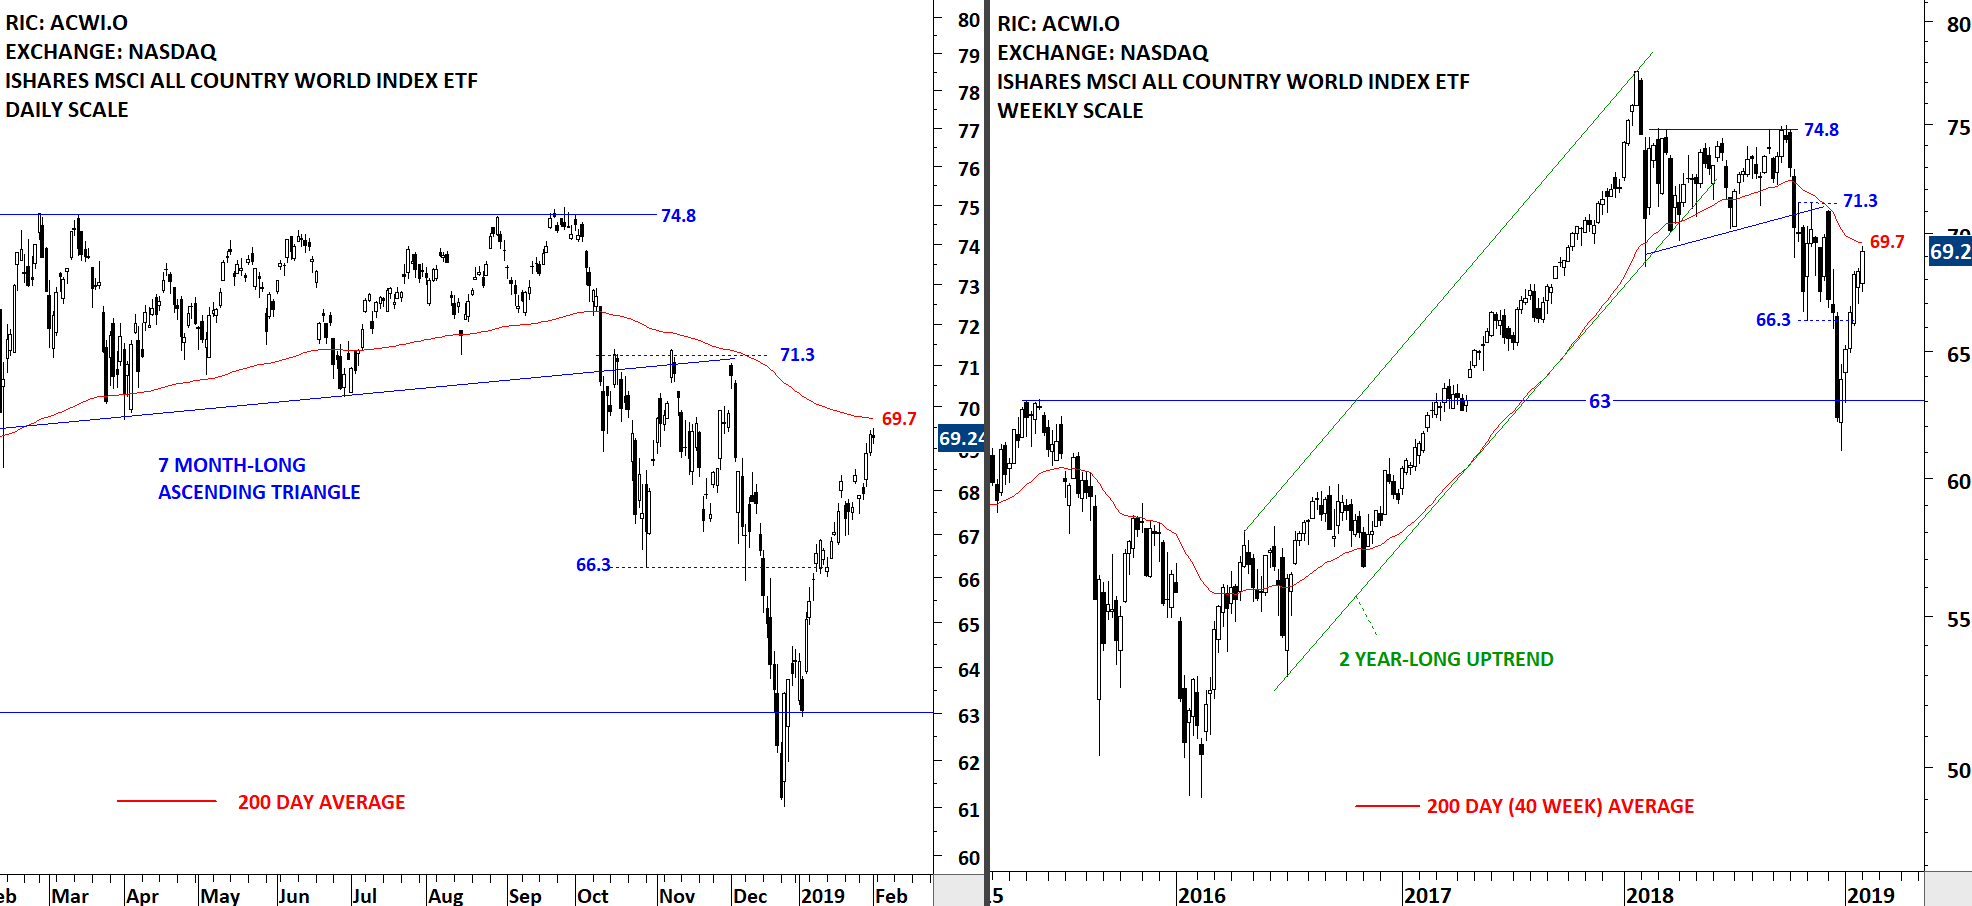
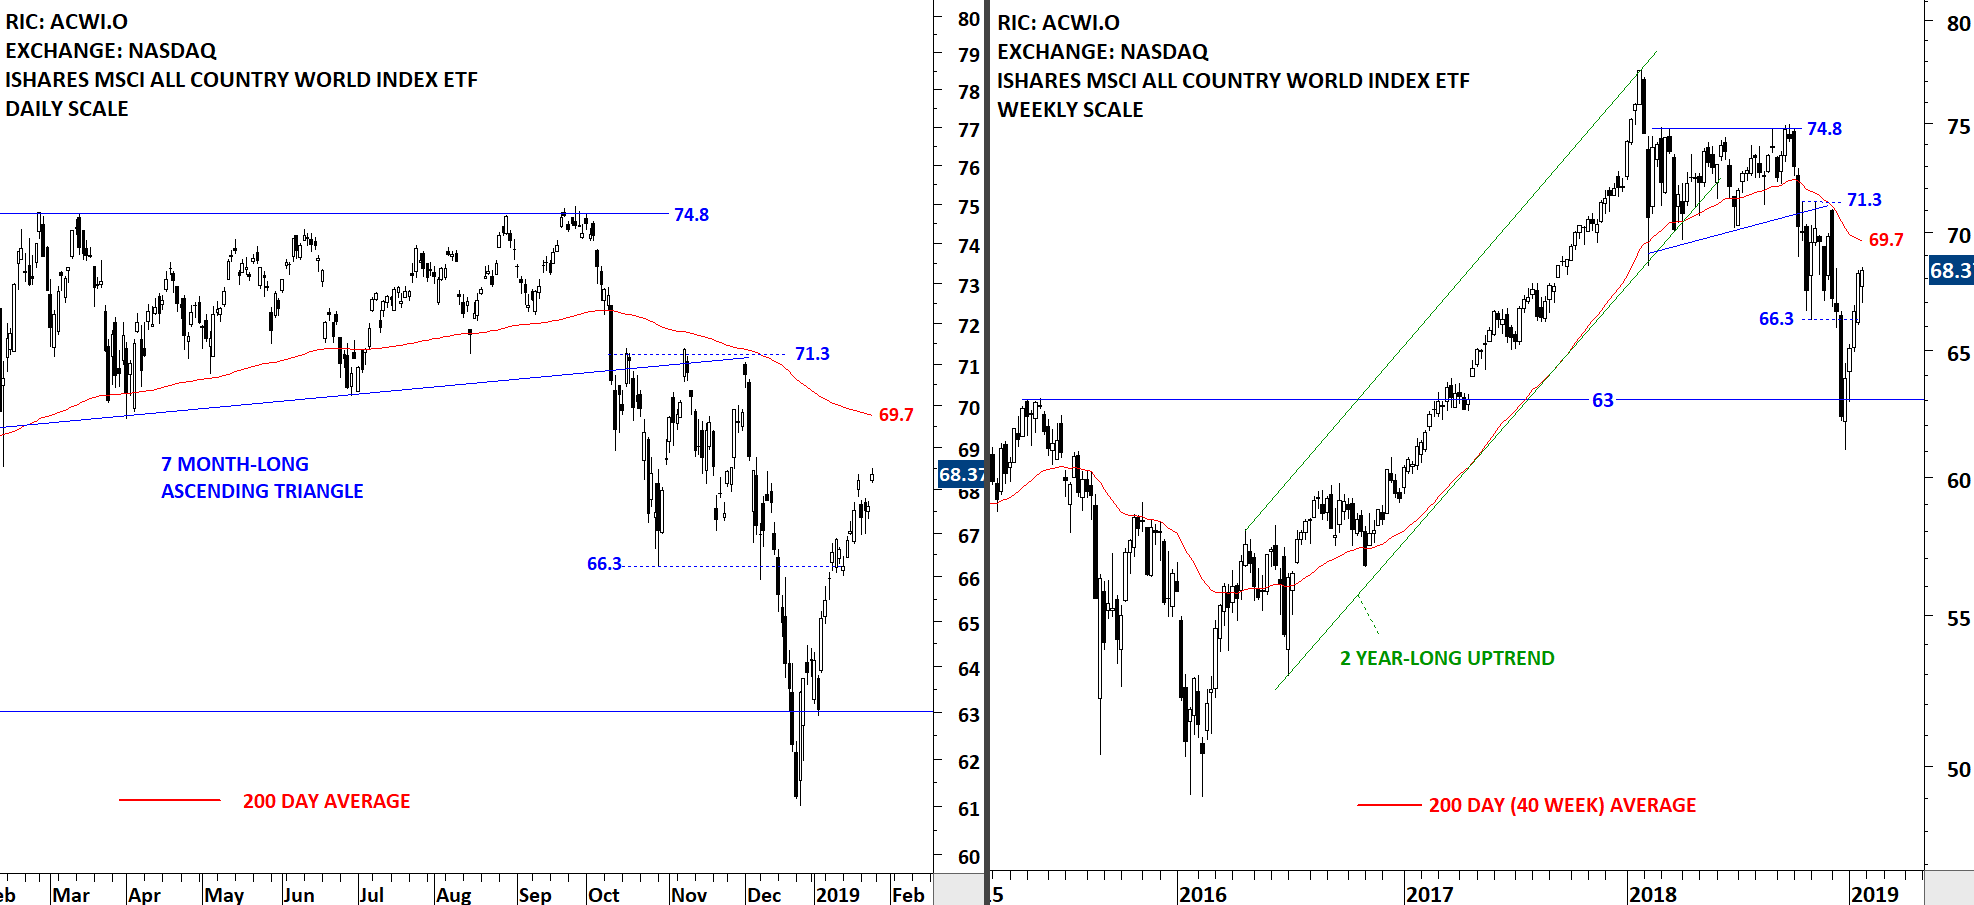
The benchmark for the Global equity markets performance the iShares MSCI All Country World Index ETF is testing the resistance level at 71.3 levels. Since the beginning of the year the ETF had a strong run towards the 200-day moving average. Over the past two weeks the ETF cleared its long-term average. If there is a pullback, the 200-day moving average will act as a support around 69.7 levels. Price action above the long-term average should be considered bullish and could signal a change in trend.