Dear Tech Charts Members,
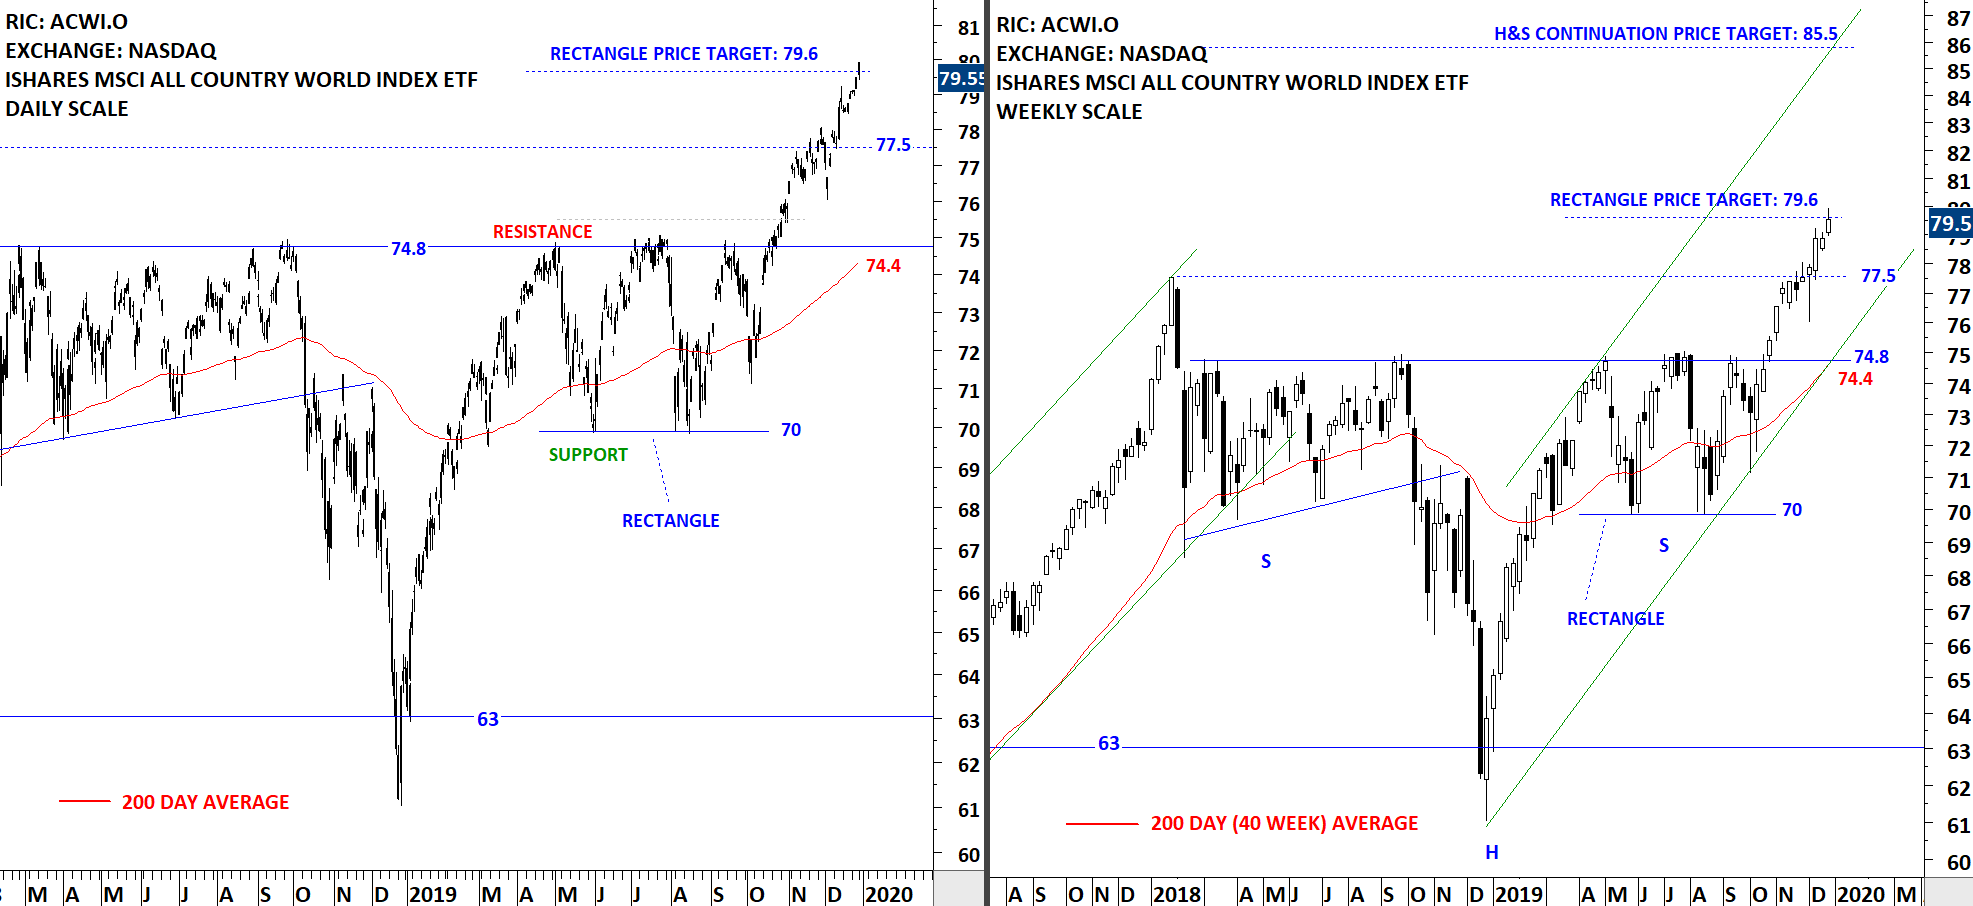
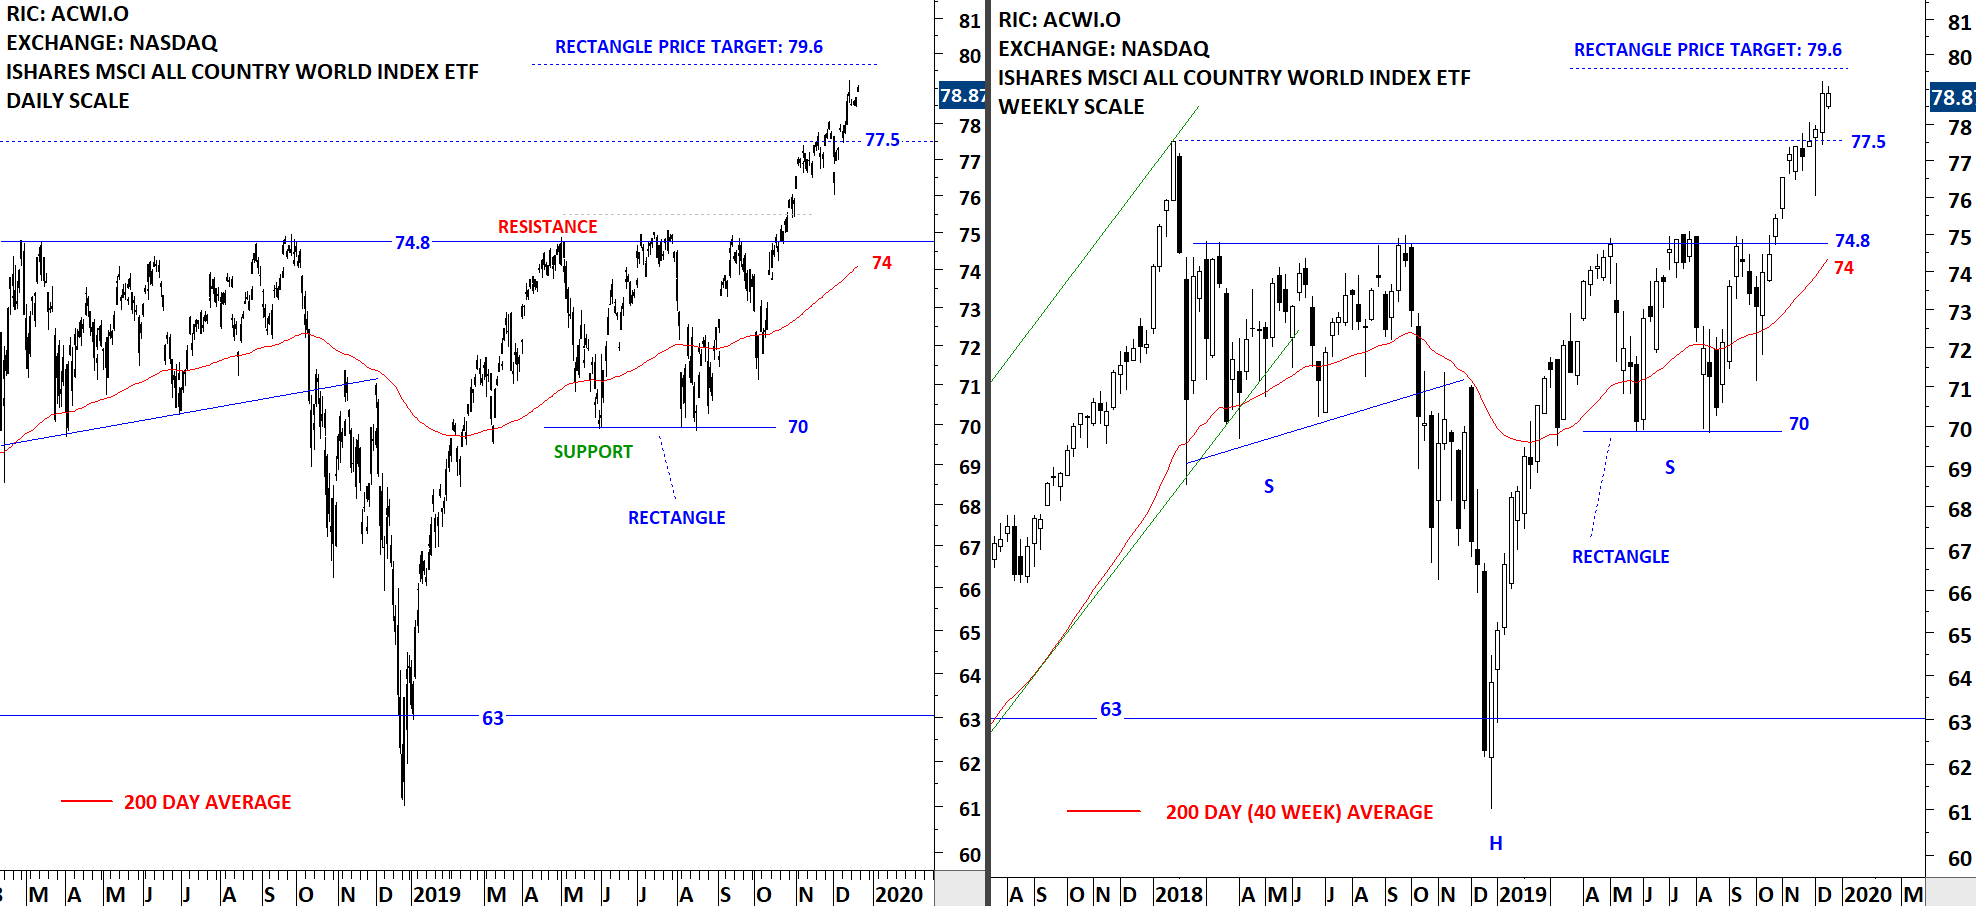
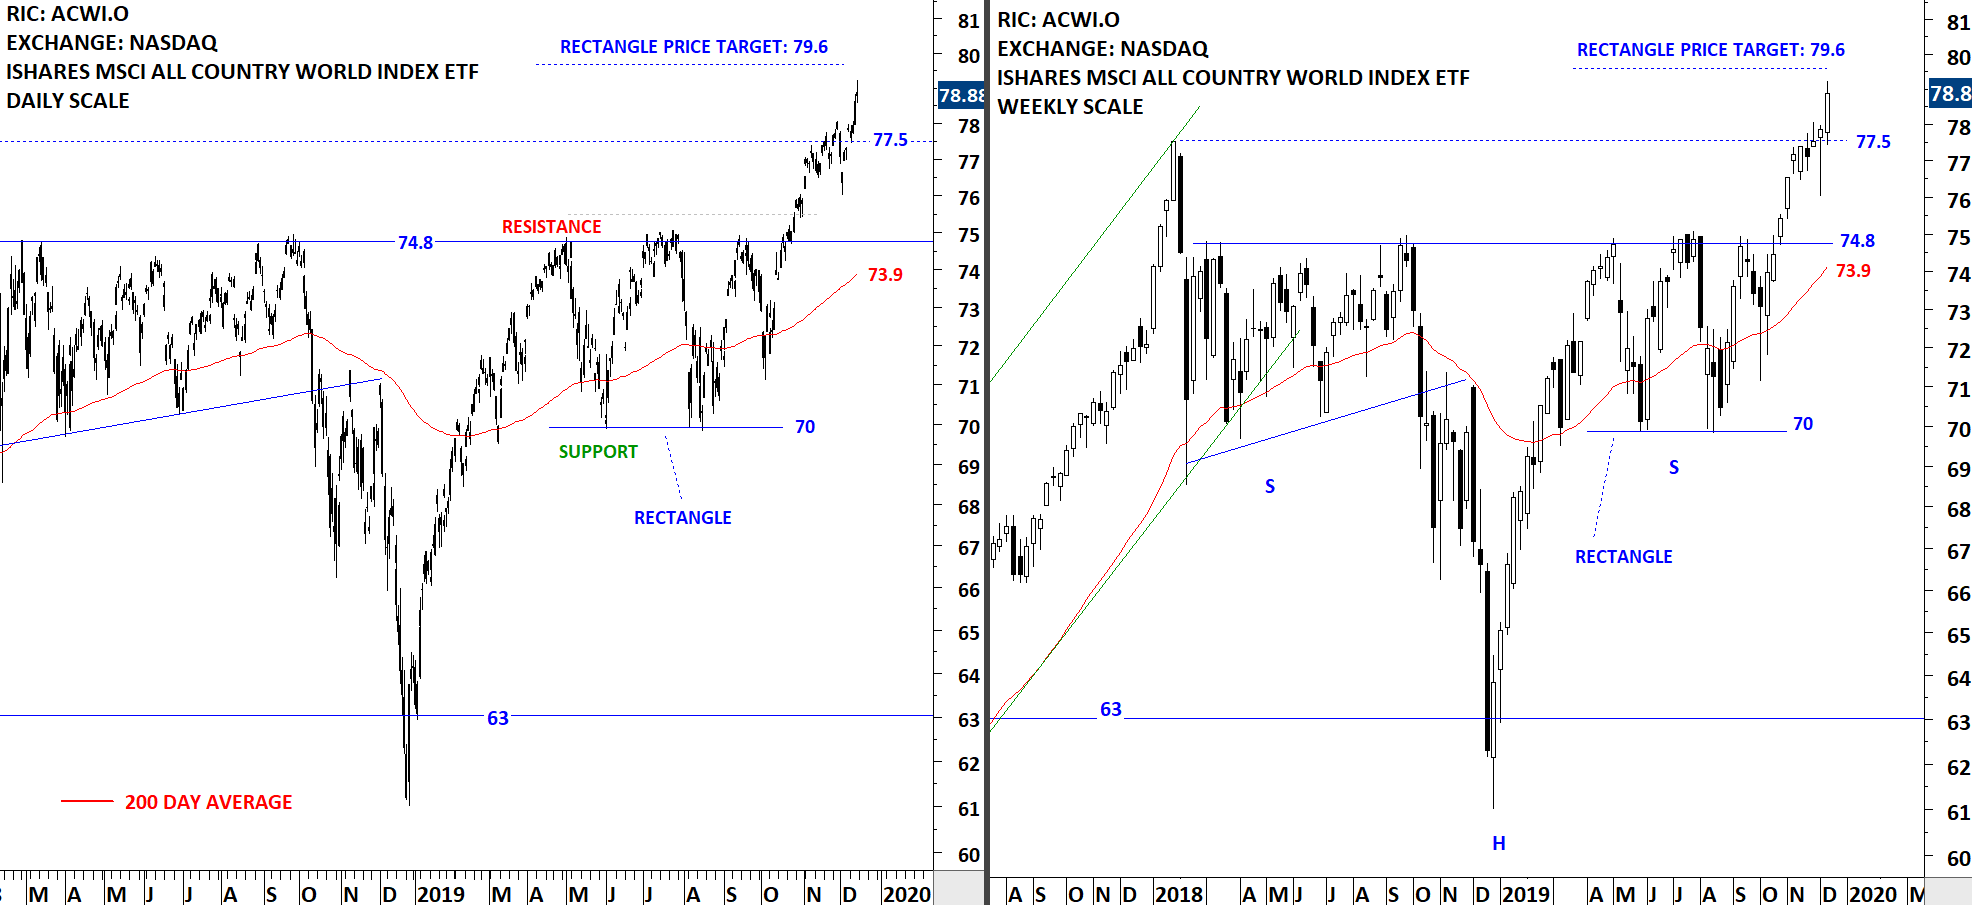
Global Equity Markets report started focusing on shorter-term time frame chart pattern developments as well as long-term patterns. Short-term chart patterns are those that cover anything from 1 month to 3 months (according to Tech Charts Research), whereas longer-term patterns are from 4 months to 24 months. Short-term chart patterns are featured on daily scale price charts, and it is important to see and understand the price dynamics of those in comparison with weekly scale breakouts. We will dedicate this webinar to several short-term examples on different chart patterns such as cup & handle, ascending triangle, descending triangle, rectangle, H&S bottom, and compare those with similar developments on weekly scale price charts. I hope to touch on risk-reward, price target calculations, and breakout confirmation levels on all those chart pattern breakout examples.
Scheduled for: Thursday, December 12, 8:30 am mountain (register below)
Read More