INTERIM UPDATE – September 14, 2020
Dear Tech Charts members, I'm adding 3 more breakout ideas to the Americas section of the report. I will cover those in the upcoming weekly report as well.
This author has not written his bio yet.
But we are proud to say that Aksel Kibar contributed 1507 entries already.
Dear Tech Charts members, I'm adding 3 more breakout ideas to the Americas section of the report. I will cover those in the upcoming weekly report as well.
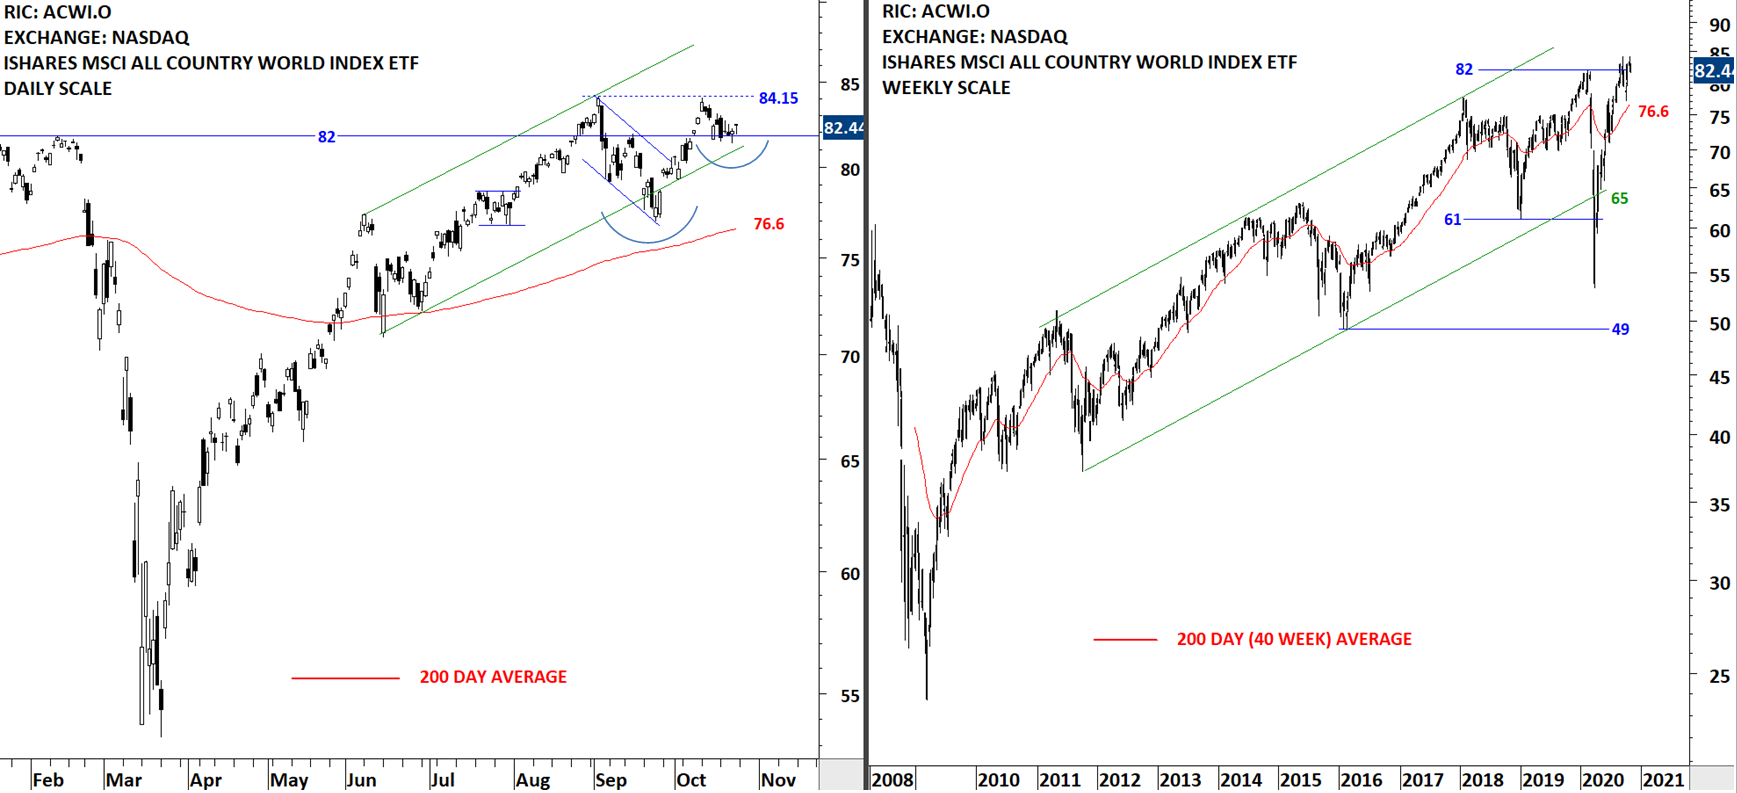
The benchmark for the Global equity markets performance, the iShares MSCI All Country World Index ETF (ACWI.O) experienced its first setback after a lengthy uptrend. I've adjusted the boundary of the trend channel in order to focus on the latter stages of the uptrend. The ETF had difficulty to rebound from last week's sell-off. Close to the end of this week, ACWI ETF tested last week's lows. The daily price chart might be forming a short-term H&S top with this week's price action completing the right shoulder. The neckline is at 79.25 levels. Breakdown below 79.25 levels can extend the correction towards the 200-day average at 74.9 levels. A breach above the high (81.3) of the right shoulder will result in a H&S failure and will suggest higher levels. Please note that this is a short-term chart pattern and the shorter -term the chart pattern the more prone it is to failure or morphing (eventually becoming part of a larger scale chart pattern).

I start my research on Mondays and finalize by end of day Thursday. Friday is dedicated to putting all ideas to the report format. During the week I come across good setups and those are featured in the weekly report. However, there are those that pop during the week and is worth bringing to your attention before the week finalizes. Below are latest additions to Tech Charts watchlist in case they experience breakouts in the last day of the week. These charts will also be included in the weekly update. (Data as of September 11, 2020, CET 07:45 AM)
Re-entry, Volatility & ATR based stop-loss - September 2020 Tech Charts Webinar
We are continuing our Member webinar series with several important and frequently asked topics. In the following webinar, we will follow a different approach. Given that the topics are different concepts in technical analysis/classical charting and trading, each section will have a +/- 10 min presentation followed by Q&A on that section.
Webinar Outline
Live questions from Members
Concept One 2:27
Concept Two 27:52
Helpful video links:
Concept Three 40:53
Additional Questions
Recorded live 09.03.2020
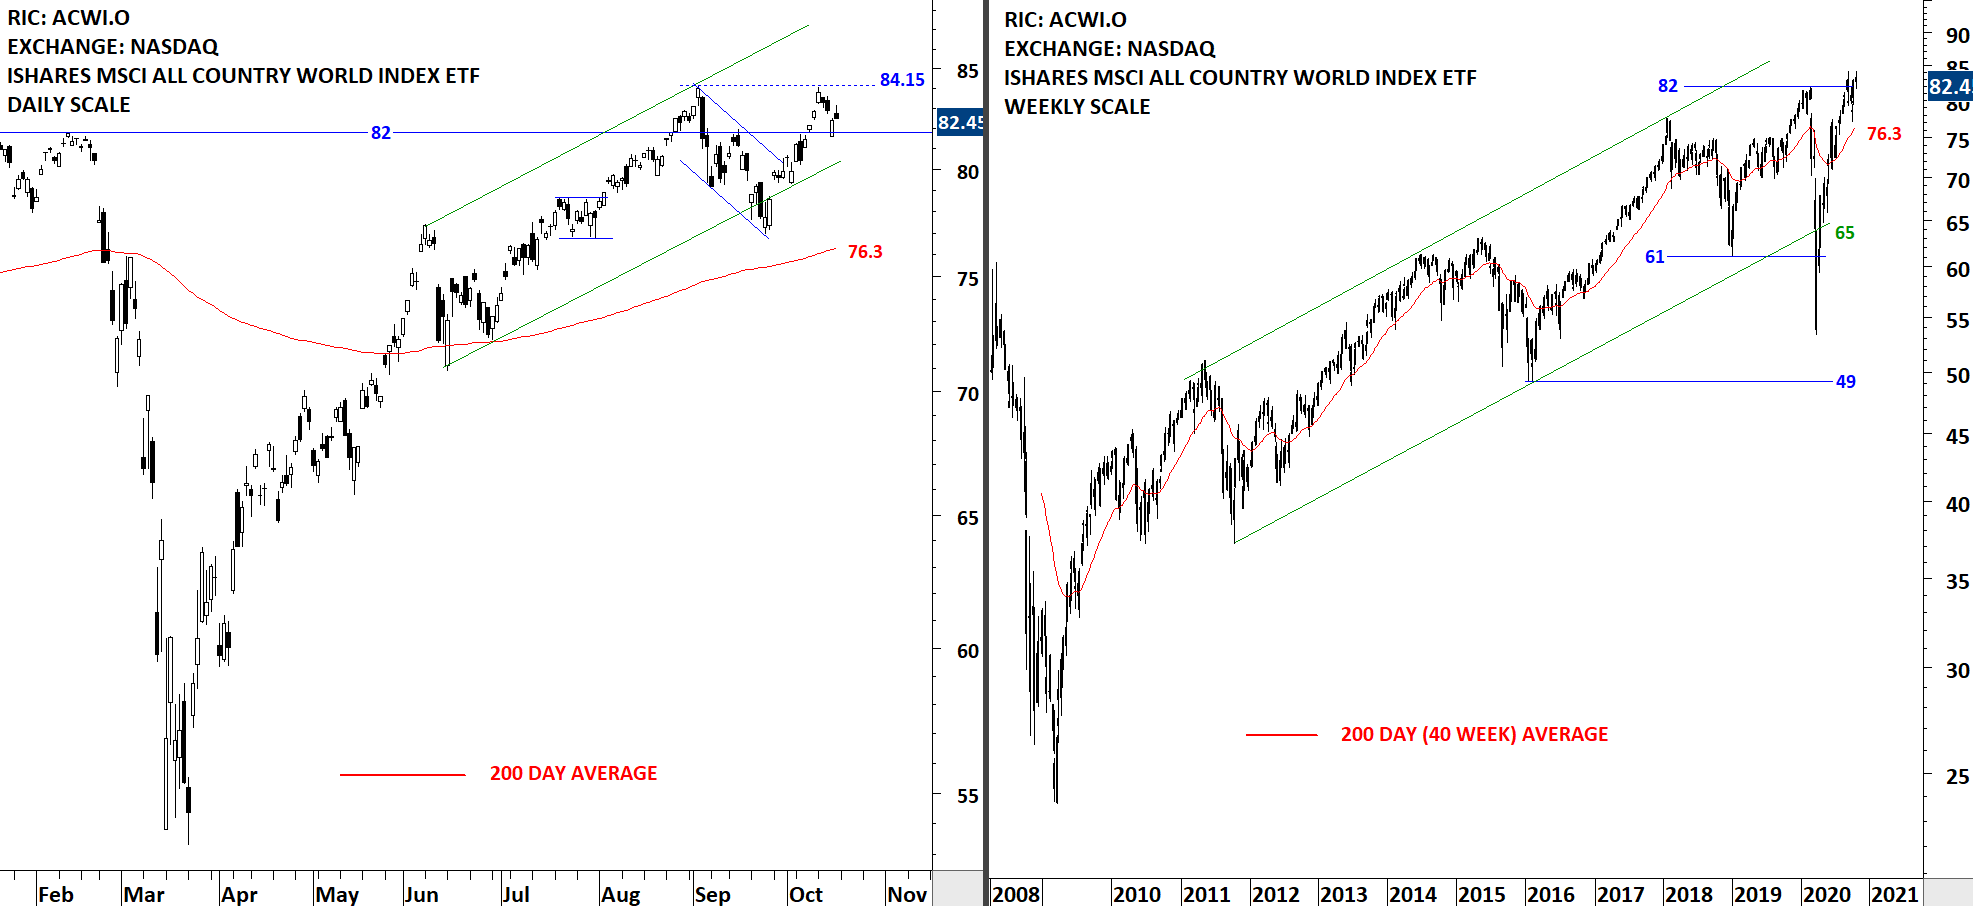
The benchmark for the Global equity markets performance, the iShares MSCI All Country World Index ETF (ACWI.O) experienced its first setback after a lengthy uptrend. I've adjusted the boundary of the trend channel in order to focus on the latter stages of the uptrend. Friday's candlestick formed long spindle suggesting buyers stepped in at the possible lower boundary. 82 is an important level to watch. I don't think the ETF cleared the resistance at 82. The breach was premature to call it a breakout. So I still monitor 82 as the resistance. The 200-day moving average is forming support at 74.9 levels. Breakdown below Friday's low (79.3) and the lower boundary of the 3 month-long trend channel can result in a sharp correction towards the 200-day average. Sideways consolidation around 82 levels and inside the green trend channel will be positive in the short-term.

Every week Tech Charts Global Equity Markets report features some of the well-defined, mature classical chart patterns under a lengthy watchlist and the chart pattern breakout signals that took place during that week. Global Equity Markets report covers single stocks from developed, emerging and frontier markets, ETF’s and global equity indices. The report starts with […]
Dear Tech Charts Members,
We are continuing our Member webinar series with several important and frequently asked topics. In the following webinar, we will follow a different approach. Given that the topics are different concepts in technical analysis/classical charting and trading, each section will have a +/- 10 min presentation followed by Q&A on that section.
Scheduled for: Thursday, September 3rd, 8:30 am mountain (register below)
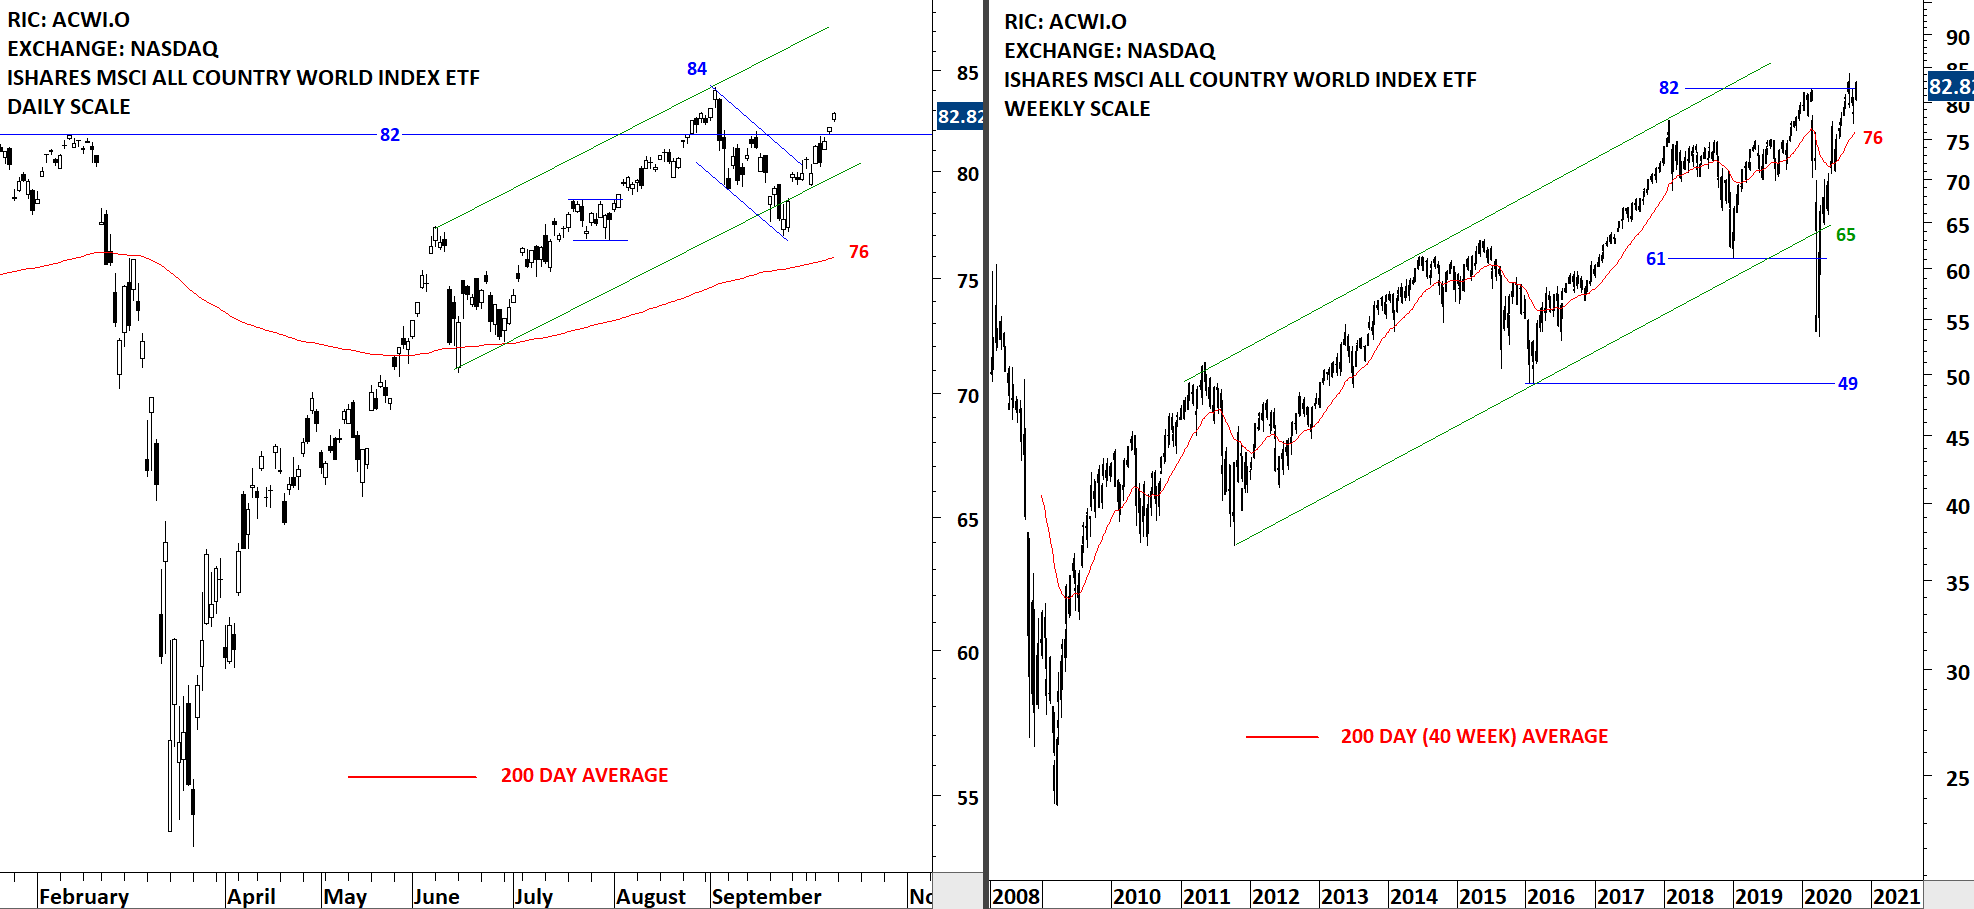
The benchmark for the Global equity markets performance, the iShares MSCI All Country World Index ETF (ACWI.O) resumed its uptrend. Last three month's price action can be identified as a rising channel. Price is trying to remain inside the trend channel and so far the price remained above the 200-day average. Uptrend is intact. The 200-day moving average is forming support at 74.4 levels. Breakdown below the lower boundary of possible trend channel can result in a pullback towards the 200-day average at 74.4 levels. Volatility is low and we can expect another trend period soon. If it is a correction with the breakdown of the trend channel, it should develop fast, towards 74.4 levels. The ETF breached its pre-pandemic high at 82 levels. Though it could be early to call this a breakout.

Every week Tech Charts Global Equity Markets report features some of the well-defined, mature classical chart patterns under a lengthy watchlist and the chart pattern breakout signals that took place during that week. Global Equity Markets report covers single stocks from developed, emerging and frontier markets, ETF’s and global equity indices. The report starts with […]
I start my research on Mondays and finalize by end of day Thursday. Friday is dedicated to putting all ideas to the report format. During the week I come across good setups and those are featured in the weekly report. However, there are those that pop during the week and is worth bringing to your attention before the week finalizes. Below are latest additions to Tech Charts watchlist that may experience breakouts over the next few trading days. These charts will also be included in the weekly update. (Data as of August 25, 2002, CET 13:05 PM)