Morphology and Cup & Handle continuation
This content is for members only


This content is for members only
I start my research on Mondays and finalize by end of day Thursday. Friday is dedicated to putting all ideas to the report format. During the week I come across good setups and those are featured in the weekly report. However, there are those that pop during the week and is worth bringing to your attention before the week finalizes. Below are latest additions to Tech Charts watchlist from ASIA equities, in case they experience breakouts during the week. These charts will also be included in the weekly update.
I start my research on Mondays and finalize by end of day Thursday. Friday is dedicated to putting all ideas to the report format. During the week I come across good setups and those are featured in the weekly report. However, there are those that pop during the week and is worth bringing to your attention before the week finalizes. Below are latest additions to Tech Charts watchlist in case they experience breakouts during the week. These charts will also be included in the weekly update. I will send a separate interim update on Asia opportunities once those exchanges are closed.
Every week Tech Charts Global Equity Markets report features some of the well-defined, mature classical chart patterns under a lengthy watchlist and the chart pattern breakout signals that took place during that week. Global Equity Markets report covers single stocks from developed, emerging and frontier markets, ETF’s and global equity indices. The report starts with […]
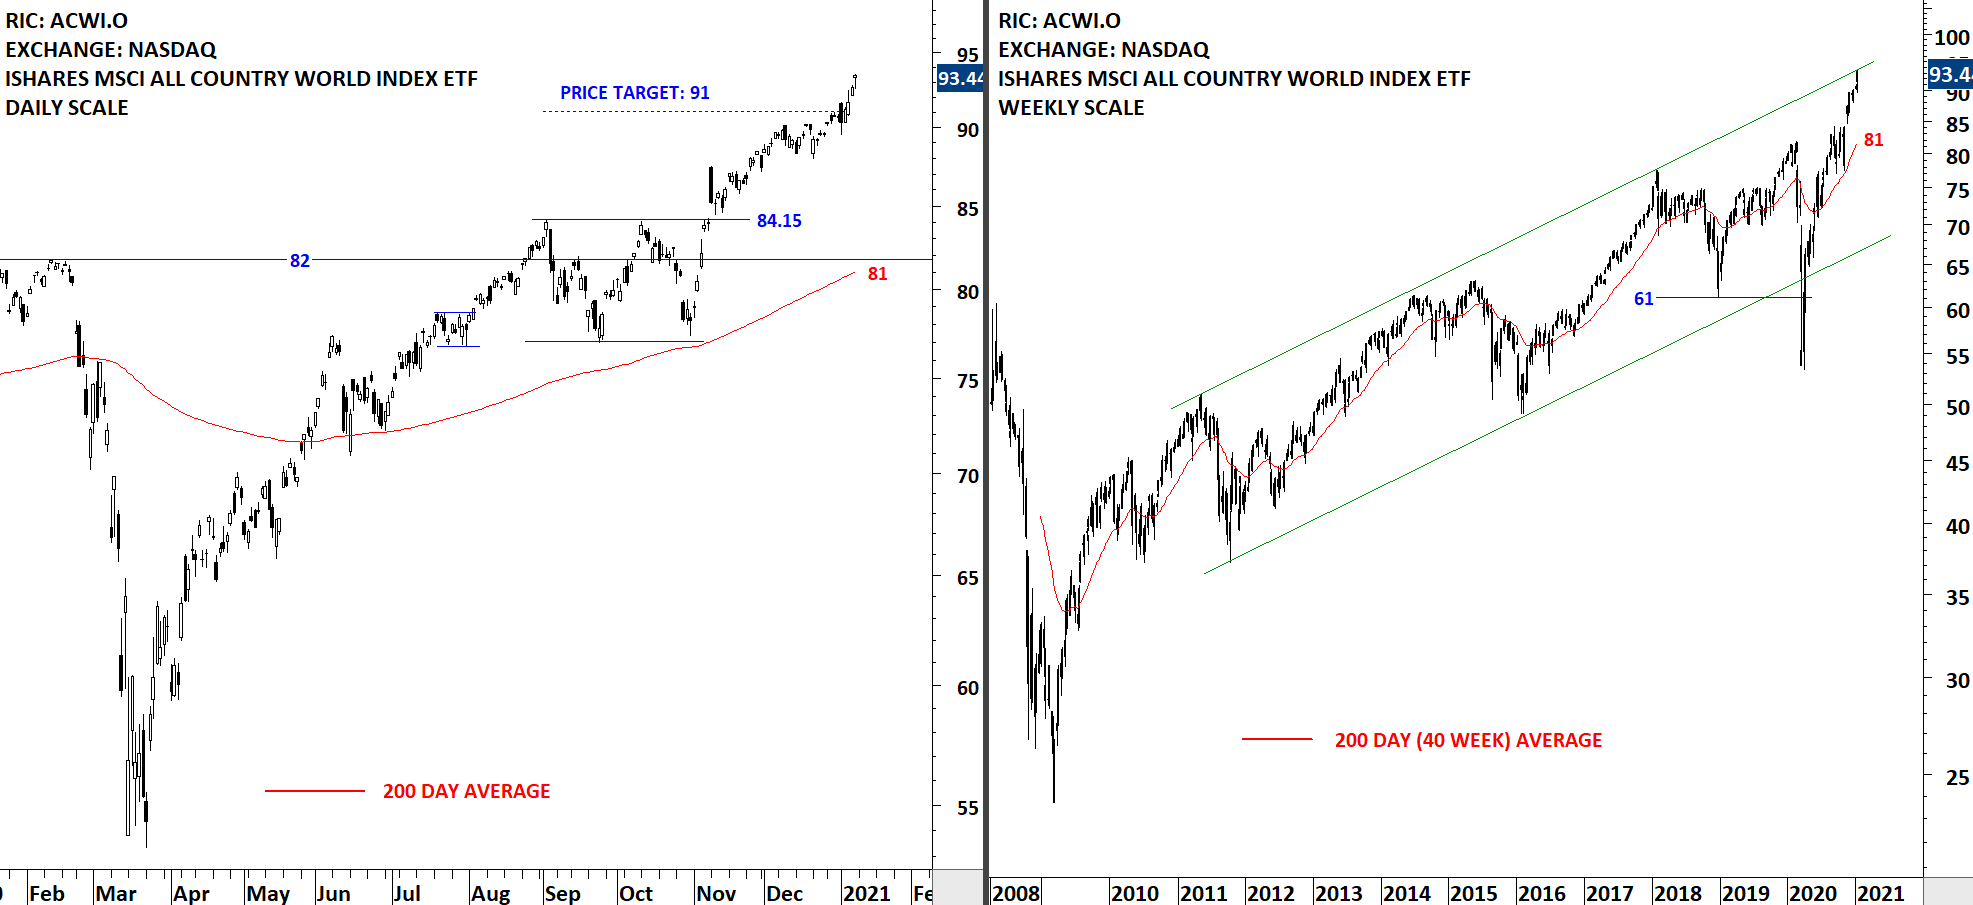
The benchmark for the Global equity markets performance, the iShares MSCI All Country World Index ETF (ACWI.O) resumed its uptrend past the rectangle chart pattern price target at 91 levels. On the weekly scale price chart of the ETF is also close to the upper boundary of the long-term uptrend channel. During any pullback 84.15 will act as support. The 200-day moving average, which I utilize as a trend filter, is rising as well, now at 81 levels. Volatility is picking up from low levels. Volatility does not have direction. Acceleration of the uptrend or a sharp correction; both can result in an increase in volatility. Uptrend is intact and there is no reversal chart pattern on daily scale price chart.
I start my research on Mondays and finalize by end of day Thursday. Friday is dedicated to putting all ideas to the report format. During the week I come across good setups and those are featured in the weekly report. However, there are those that pop during the week and is worth bringing to your attention before the week finalizes. Below are latest additions to Tech Charts watchlist in case they experience breakouts during the last day of the week. These charts will also be included in the weekly update.
Every week Tech Charts Global Equity Markets report features some of the well-defined, mature classical chart patterns under a lengthy watchlist and the chart pattern breakout signals that took place during that week. Global Equity Markets report covers single stocks from developed, emerging and frontier markets, ETF’s and global equity indices. The report starts with […]
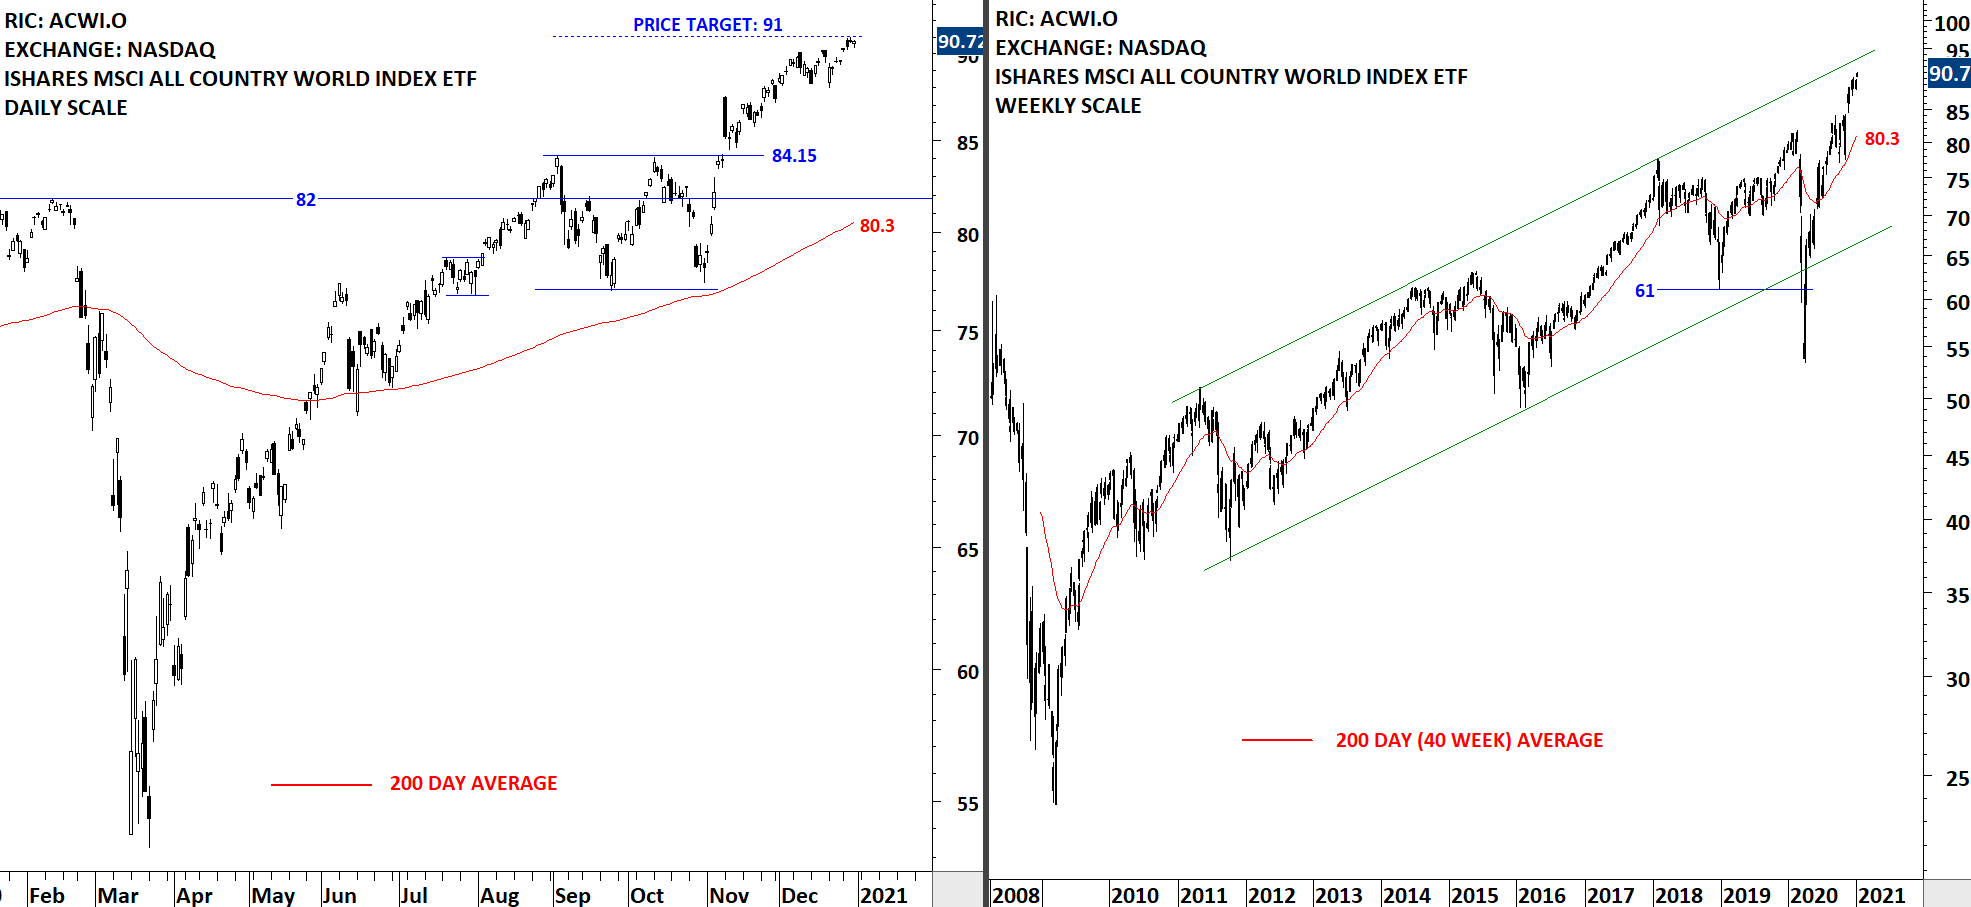
The benchmark for the Global equity markets performance, the iShares MSCI All Country World Index ETF (ACWI.O) reached its chart pattern price target after completing a rectangle chart pattern. On the weekly scale price chart of the ETF is also close to the upper boundary of the long-term uptrend channel. During any pullback 84.15 will act as support. The 200-day moving average, which I utilize as a trend filter, is rising as well, now at 80.3 levels. Volatility is at low levels and this suggests an increase in volatility in the coming days. Volatility does not have direction. Acceleration of the uptrend or a sharp correction; both can result in an increase in volatility.
This content is for members only
We always include in our wishes “health” but sometimes we take it for granted. 2020 has been one of those years that we have realized that nothing should be taken for granted. I hope you and your families have been safe & healthy during these difficult times. I wish everyone a HEALTHY new year with […]