GLOBAL EQUITY MARKETS – December 25, 2021
This content is for members only
This author has not written his bio yet.
But we are proud to say that Aksel Kibar contributed 1457 entries already.
This content is for members only
Several cryptocurrency pairs came under pressure. Below charts are covering those that have well-defined consolidation ranges and candidates for rebounds from lower boundaries as well as those that can breakout to new highs.
Two Different Strategies for Trading Classical Chart Patterns - December 2021 Tech Charts Webinar
We are continuing our Member webinar series with chart pattern reliability and how the latest market conditions have impacted success rates on different chart patterns.
Webinar Outline
This content is for members only
Every week Tech Charts Global Equity Markets report features some of the well-defined, mature classical chart patterns under a lengthy watchlist and the chart pattern breakout signals that took place during that week. Global Equity Markets report covers single stocks from developed, emerging and frontier markets, ETF’s, select commodities, cryptocurrencies and global equity indices. Below […]
Dear Tech Charts Members,
We are continuing our Member webinar series with chart pattern reliability and how the latest market conditions have impacted success rates on different chart patterns.
Scheduled for: Thursday, December 16, 8:30 am mountain (register below)
Dear Tech Charts Members,
We are continuing our Member webinar series with chart pattern reliability and how the latest market conditions have impacted success rates on different chart patterns.
Scheduled for: Thursday, December 16, 8:30 am mountain (register below)
Every week Tech Charts Global Equity Markets report features some of the well-defined, mature classical chart patterns under a lengthy watchlist and the chart pattern breakout signals that took place during that week. Global Equity Markets report covers single stocks from developed, emerging and frontier markets, ETF’s, select commodities, cryptocurrencies and global equity indices. Below […]
The sharp correction in cryptocurrencies put more pressure on BTC than many other pairs. After a sell-off like this our attention should be on the price charts that managed to remain strong and close to their resistance levels. Usually those that hold well will be the ones to recover to new highs when momentum returns.
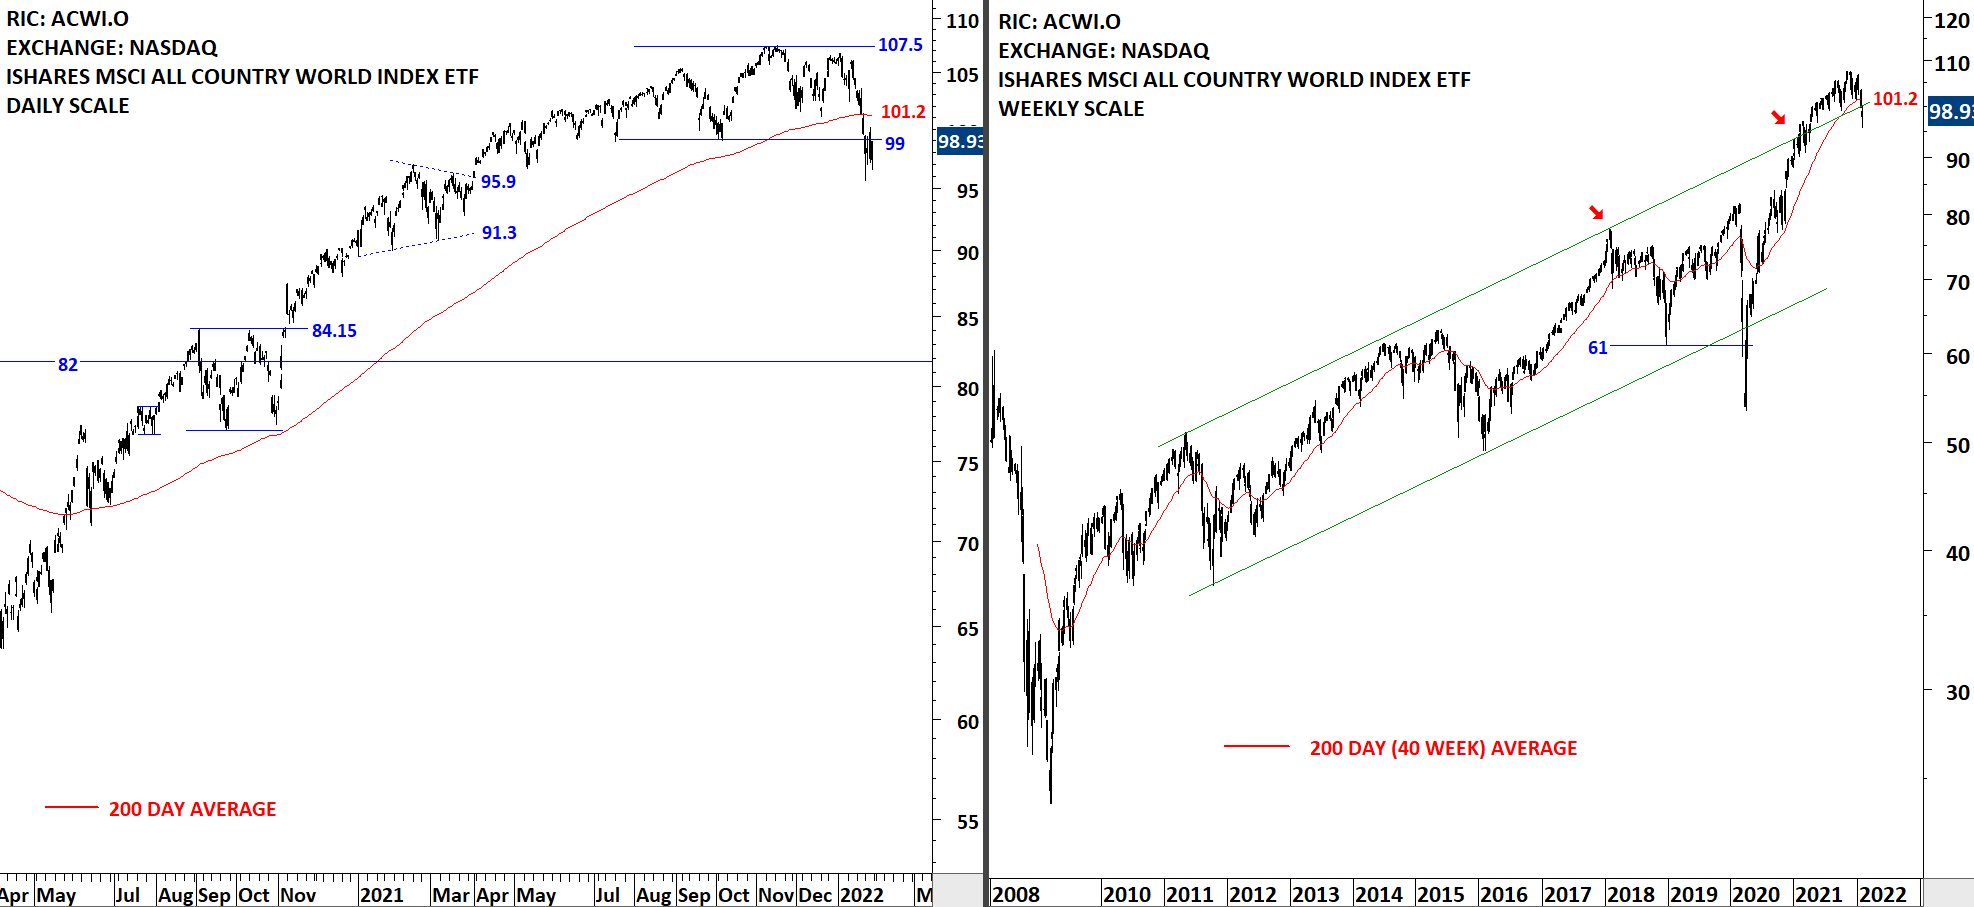
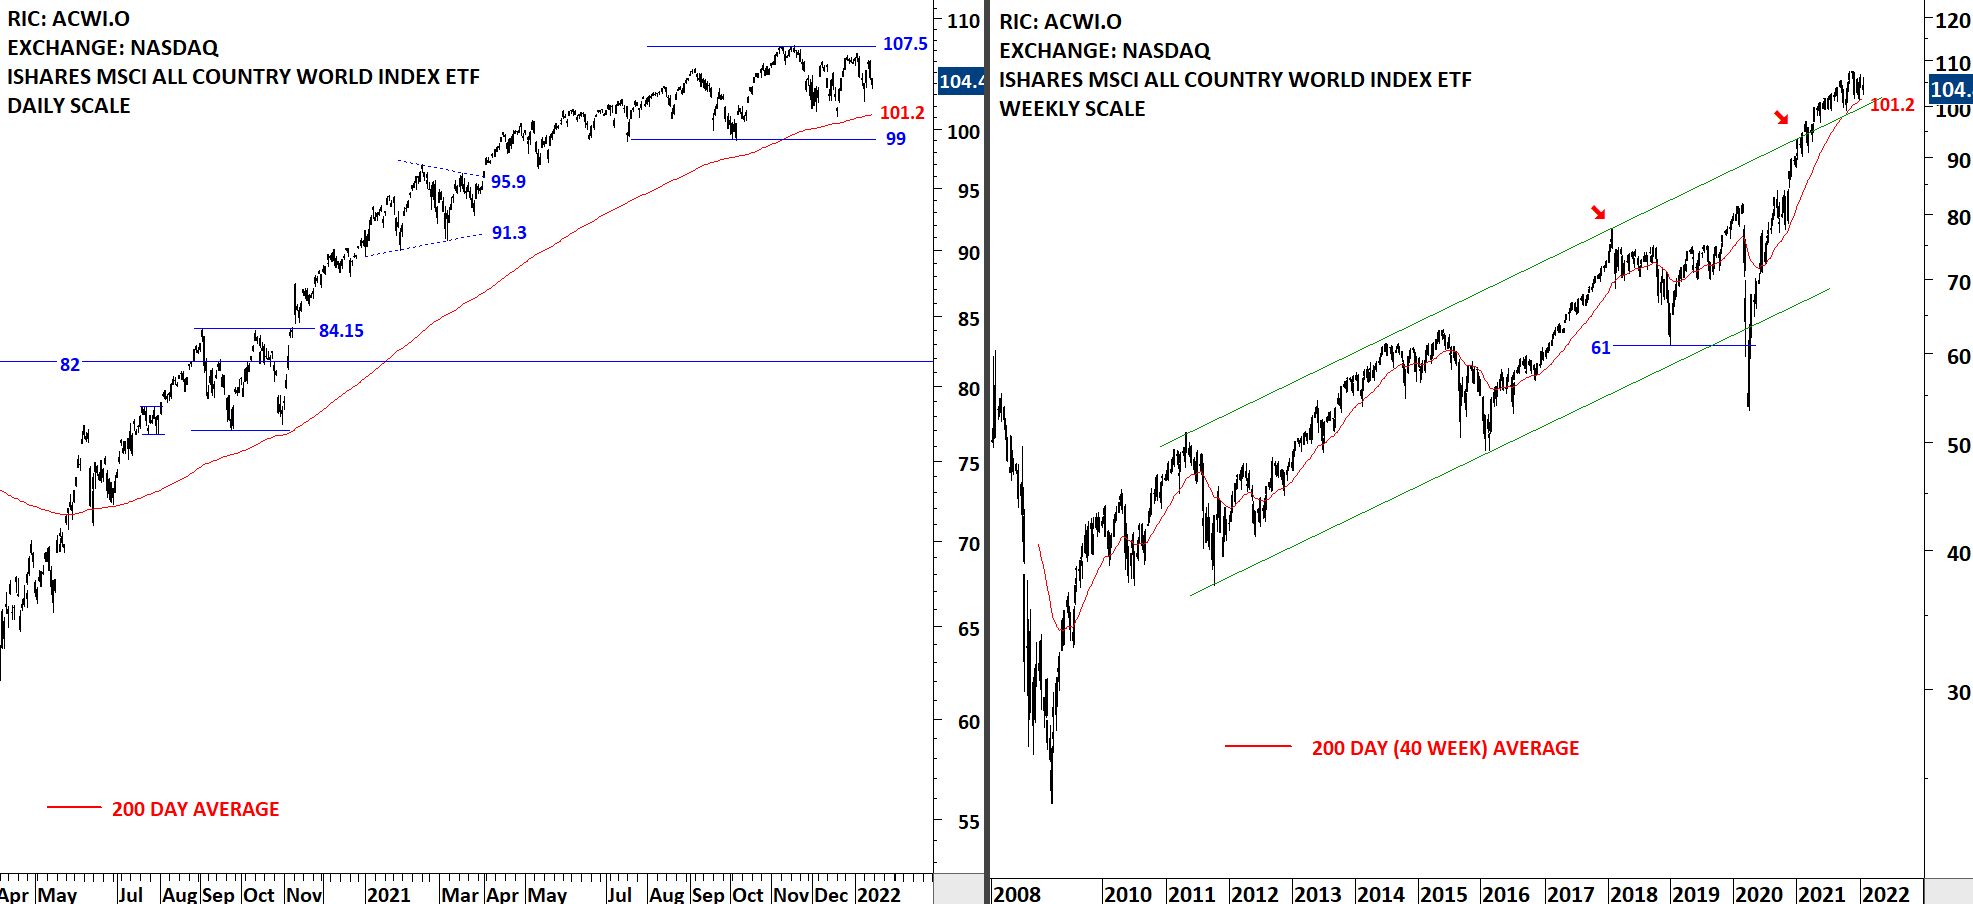
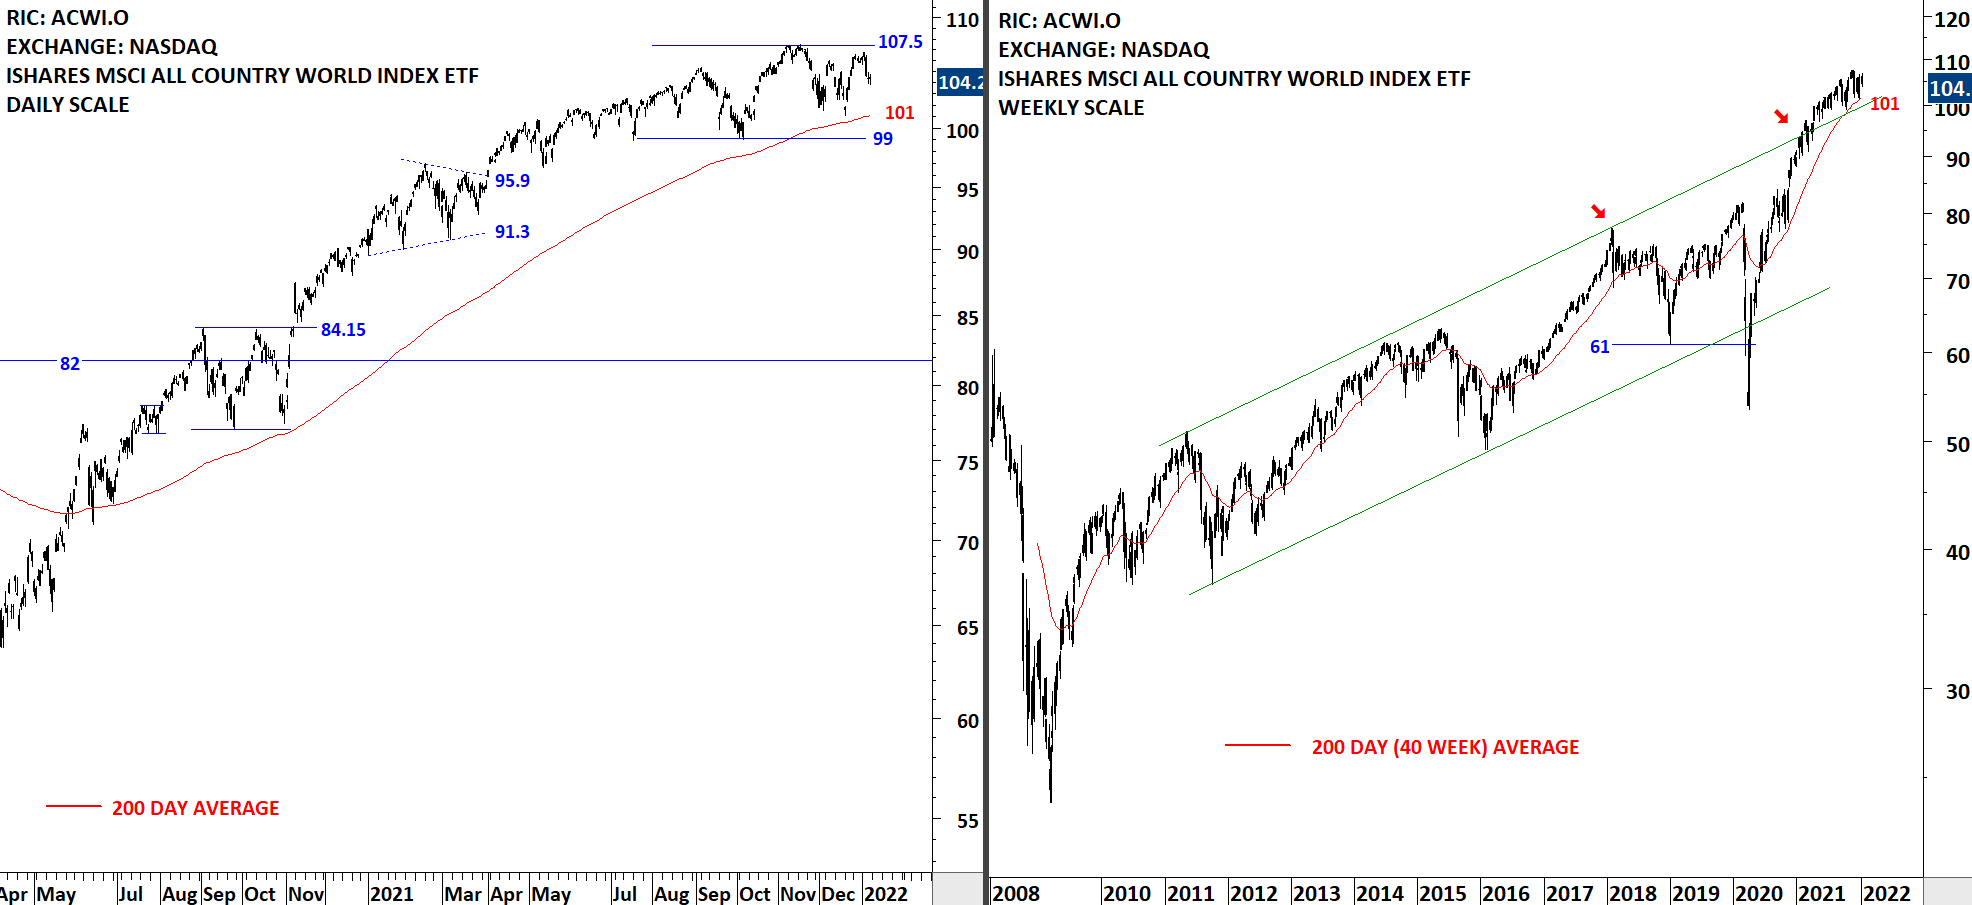
The benchmark for the Global equity markets performance, the iShares MSCI All Country World Index ETF (ACWI.O) is in an uptrend. Failure to hold above 105.5 levels resulted in a failed breakout and is now pulling the price towards the long-term average at 100 levels. Another horizontal support is standing at 99 levels, making the range 99-100; the next possible strong support area. 105.5 becomes resistance again. So far, price action looks like a reversion to the mean.

