GLOBAL EQUITY MARKETS – March 25, 2017
Global equity markets continue to offer great opportunities and text book chart pattern developments. In this update I bring to your attention well-defined chart patterns from Asia, Europe, North America and Emerging Markets that are candidates for possible breakouts and I also report fresh breakout alerts. Before we move on to equity markets, I want to draw your attention to a possibility developing in the interest rates and bonds market. During the weekly review of financial markets, I spotted the similar chart development on almost all kinds of bond market ETFs.
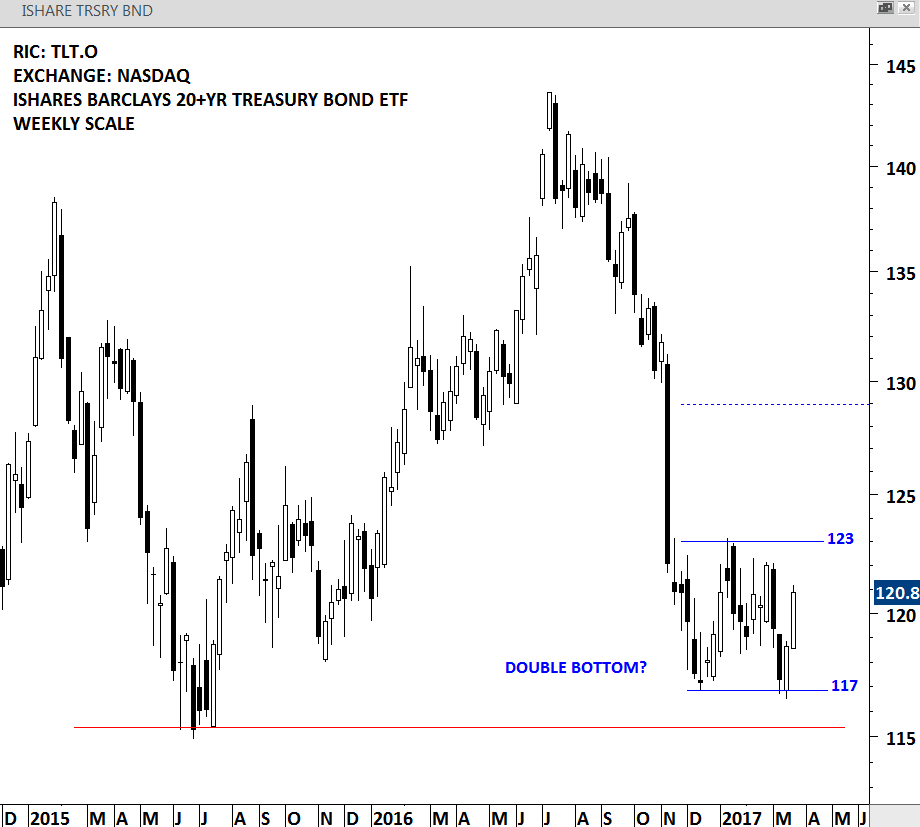
ISHARES BARCLAYS 20+YR TREASURY BOND ETF (TLT.O)
ISHARES BARCLAYS 20+YR TREASURY BOND ETF is an exchange traded fund listed on the Nasdaq Stock Exchange. The Fund seeks investment results that correspond generally to the price and yield performance of the long-term sector of the U.S. Treasury market as defined by the Barclays Capital 20+ Year Treasury Index. Price chart of this ETF is possibly forming a 4 month-long double bottom. This chart pattern is still at its early stages. The short-term consolidation remains between 117 and 123 levels. The low for the year 2015 stands at 115 as an other important medium/long-term support level. The latest chart development suggests that in the short/medium-term bonds might be finding support. Price should either break 117 levels on the downside or 123 levels on the upside for the chart pattern to complete.