

A Framework for Classifying Chart Pattern Breakouts
Extending Peter Brandt’s Last Full Day Low Rule: A Framework for Classifying Chart Pattern Breakouts
Introduction
Peter Brandt is widely recognized for his disciplined approach to classical chart pattern trading. While much attention is given to identifying chart patterns and measuring price objectives, Brandt places equal importance on trade management and risk control. One of the cornerstones of his methodology is the Last Full Day (LFD) Low Rule, which provides an objective reference point for managing risk immediately after a breakout.
Beyond its application as a protective stop, the Last Full Day Low can also serve as an effective tool for evaluating the quality of a breakout. By observing how price behaves relative to this level after a breakout, chart patterns can be classified into four distinct categories ranging from high-momentum breakouts to complete failures.
This article combines Brandt’s original concept with a systematic breakout classification framework.
Peter Brandt’s Last Full Day Low Rule
The Last Full Day (LFD) is defined as the last completed trading day whose entire price bar remains inside the chart pattern before the breakout occurs.
For a long breakout:
-
Identify the final trading day that was completely contained within the pattern.
-
Place the initial protective stop just below that day’s low.
-
Identify the last complete day inside the pattern.
-
Place the initial protective stop just above that day’s high.
The rationale is straightforward. Once a legitimate breakout occurs, price should not retrace deeply back into the completed pattern. If the breakout quickly violates the Last Full Day Low, the probability increases that the breakout has failed or at least lost much of its initial momentum.
Brandt primarily uses this rule as an objective method of initial risk management. As a trade develops, he often advances his stop according to other trailing stop techniques.
Using the Last Full Day Low to Evaluate Breakout Quality
While the Last Full Day Low is an excellent stop-loss reference, it can also reveal valuable information about the strength of the breakout itself.
Not all successful breakouts behave the same way.
Some explode higher without hesitation.
Others pull back to test former resistance before continuing.
Some experience deep shakeouts before eventually reaching their objectives.
Others fail completely.
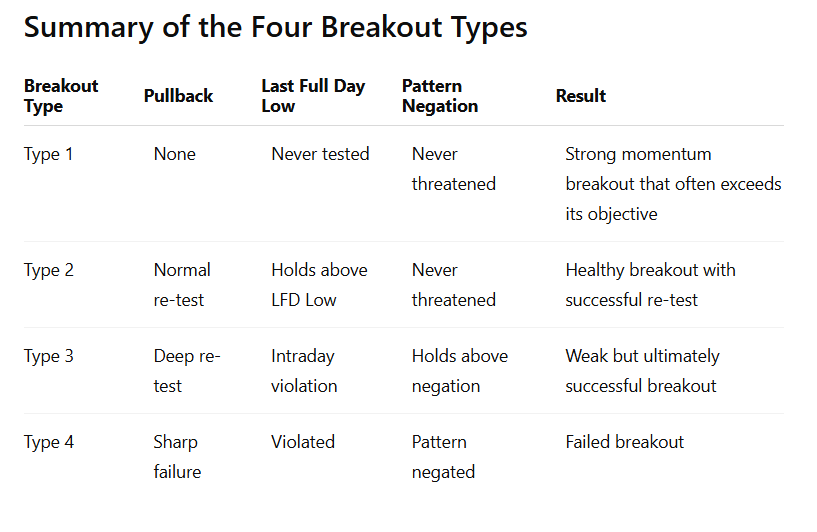
These differences can be organized into four objective breakout types.
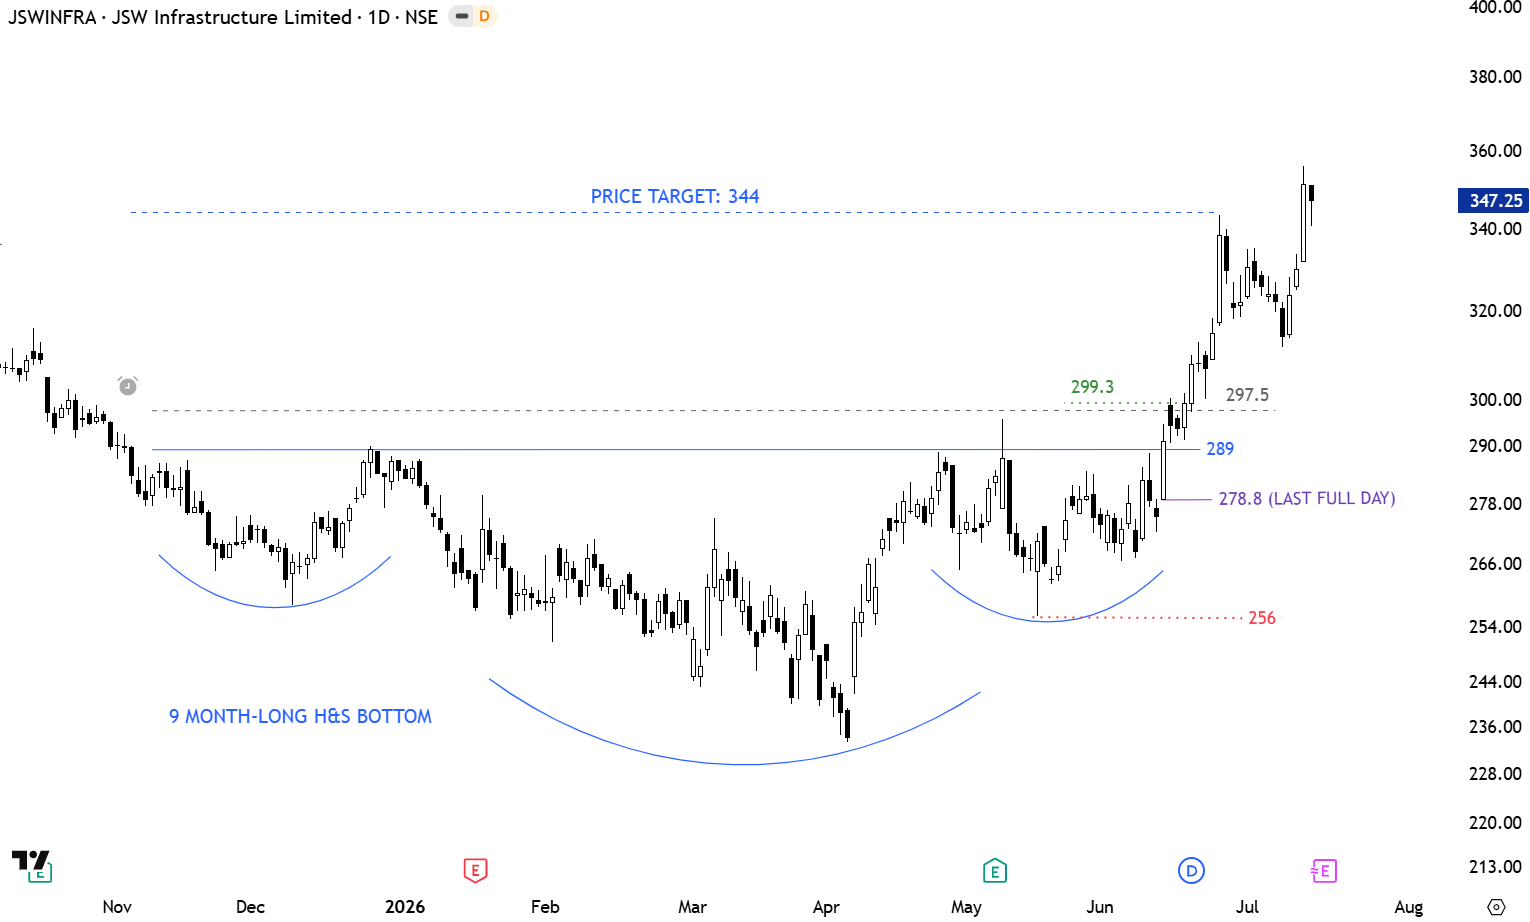
Type 1 – Momentum Breakout
A Type 1 breakout occurs when price breaks out of a chart pattern and rallies directly toward its measured price objective without any meaningful pullback.
Characteristics include:
-
Immediate expansion away from the breakout level
-
No meaningful re-test of the pattern boundary
-
No test of the Last Full Day Low
-
Strong institutional demand
-
Frequently exceeds the measured move objective
These are the strongest breakouts because buyers remain in control from the moment of the breakout.
Type 1 breakouts often occur in leading stocks during strong bull markets.
Type 2 – Standard Re-test Breakout
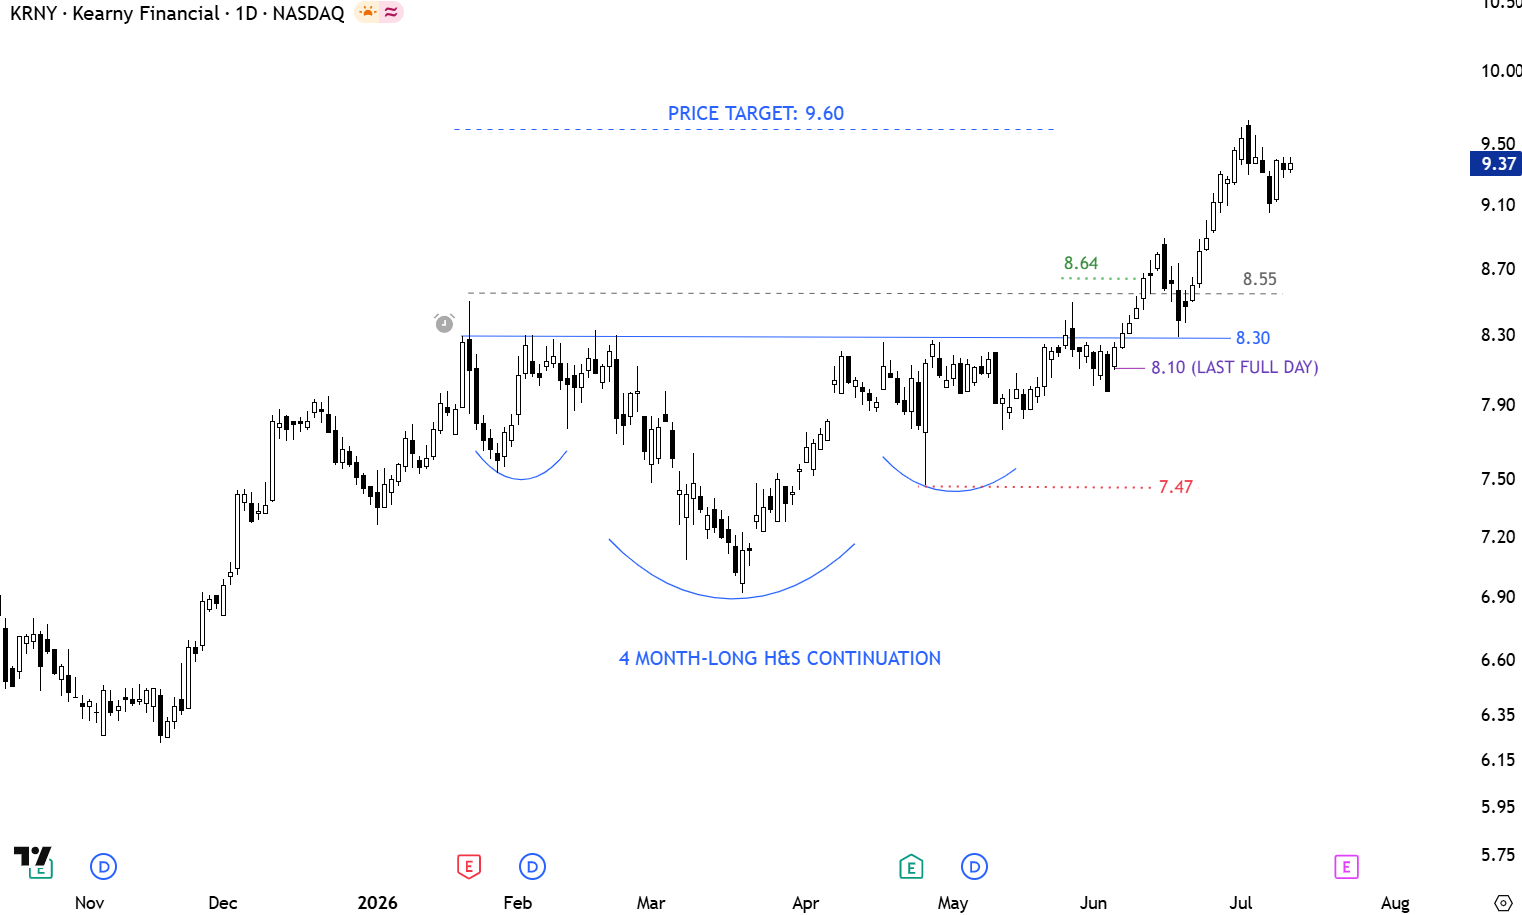
A Type 2 breakout occurs when price breaks out successfully but later returns to test the former resistance level.
During this pullback:
-
Price may touch or slightly penetrate the breakout boundary.
-
The Last Full Day Low remains intact.
-
The violation is judged on an intraday basis, not a closing basis.
-
Buyers quickly regain control.
-
The measured objective is eventually achieved.
This represents the classic “breakout and re-test” behavior frequently observed in healthy trends.
The former resistance successfully becomes new support.
Type 3 – Deep Re-test Breakout
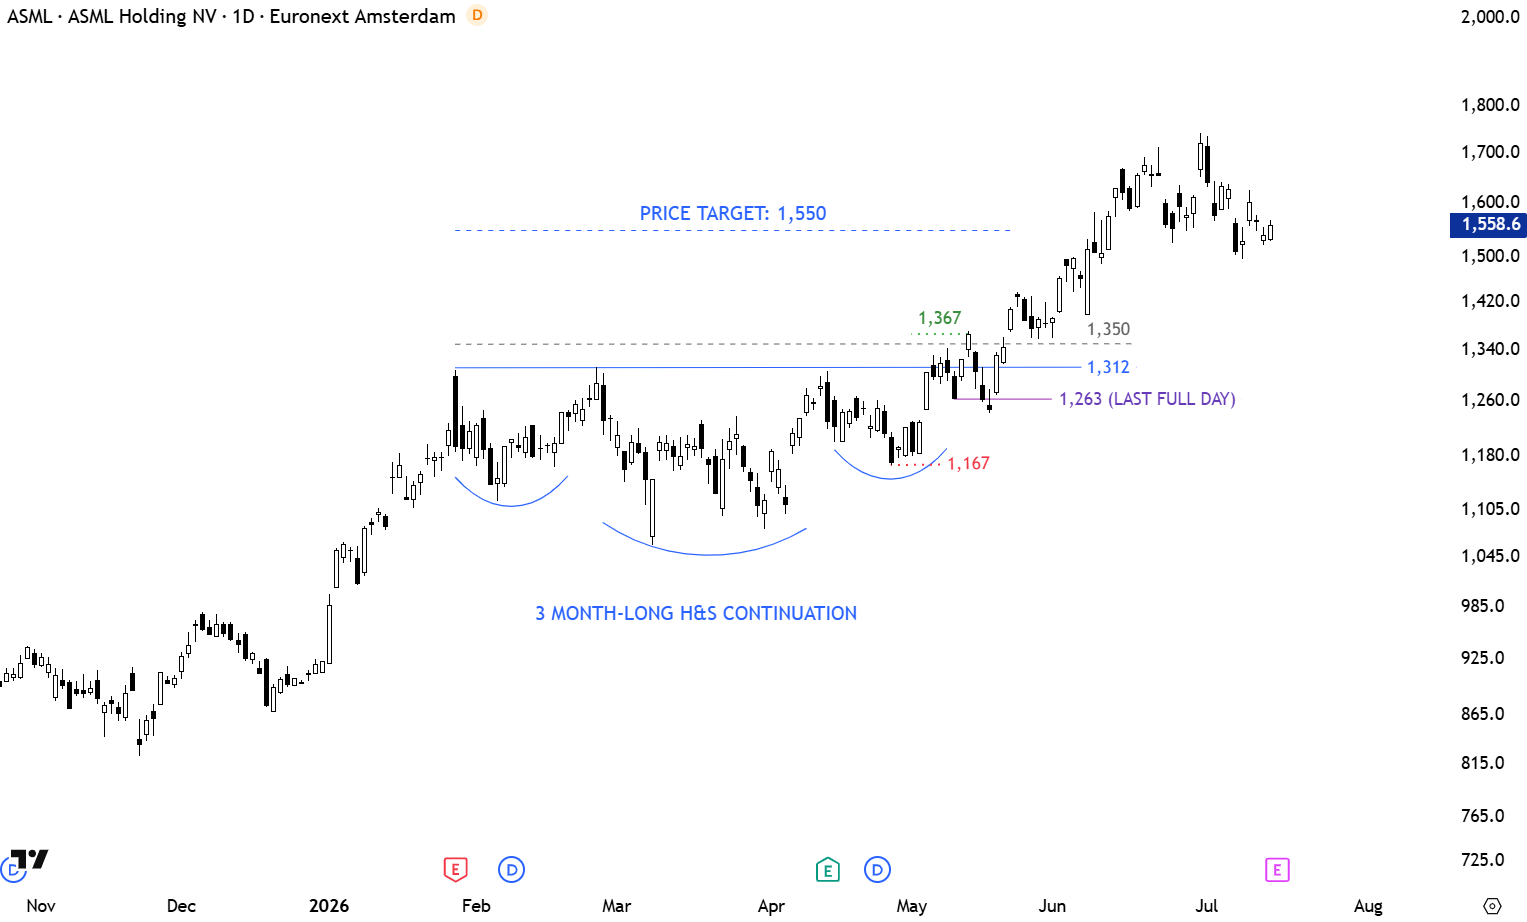
A Type 3 breakout represents a much weaker but still successful breakout.
After the breakout:
-
Price retraces sharply.
-
The pullback violates the Last Full Day Low on an intraday basis.
-
However, price remains above the chart pattern negation level.
-
Buyers eventually regain control.
-
The measured price objective is ultimately reached.
From a risk management perspective, Brandt’s original stop based on the Last Full Day Low would likely have been triggered.
From a chart pattern perspective, however, the pattern itself remains valid because its structural support has not failed.
These breakouts often shake out weaker holders before resuming their advance.
Type 4 – Failed Breakout
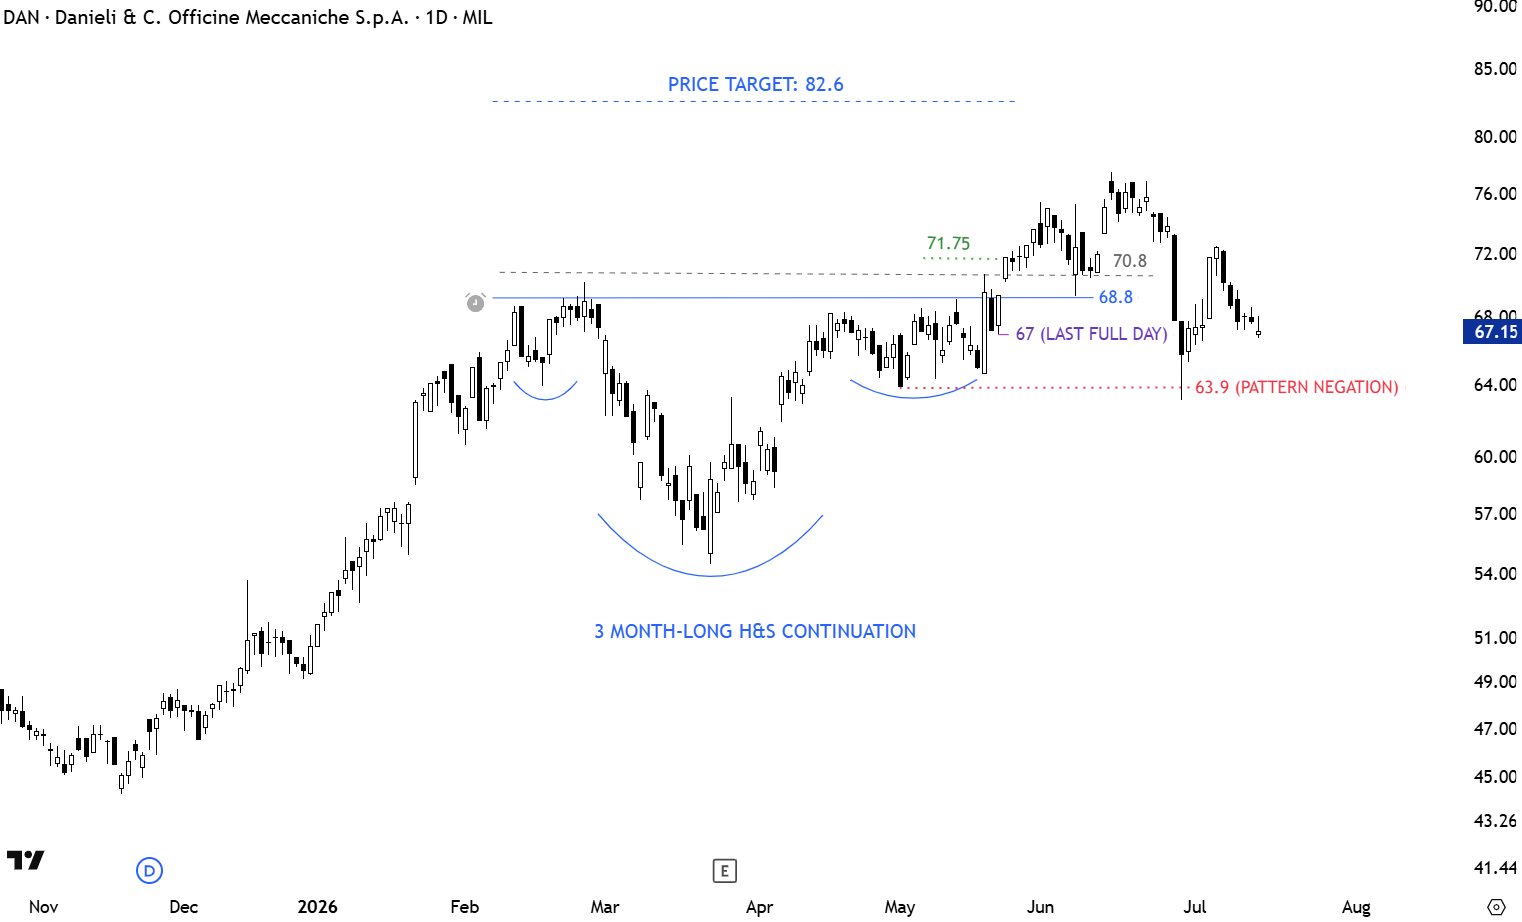
A Type 4 breakout occurs when the breakout cannot be sustained.
Price:
-
Breaks out initially.
-
Pulls back aggressively.
-
Violates the Last Full Day Low.
-
Continues downward until reaching the chart pattern negation level.
-
Invalidates the original chart pattern.
Once the pattern negation level is broken, the original trading thesis no longer exists.
This represents a failed breakout and an unsuccessful chart pattern.
The Relationship Between the Last Full Day Low and Pattern Negation
The Last Full Day Low and the pattern negation level serve different purposes.
The Last Full Day Low measures the quality of the breakout.
The pattern negation level determines whether the chart pattern remains valid.
This distinction creates three progressively weaker classes of successful breakouts before reaching outright failure:
- Type 1: Strongest breakout with uninterrupted momentum.
-
Type 2: Healthy breakout with a controlled re-test.
-
Type 3: Weak breakout that survives a deep shakeout.
-
Type 4: Failed breakout in which the chart pattern is invalidated.
Practical Applications
This framework provides traders with an objective method for evaluating breakout behavior after entry.
It can be used to:
-
Assess the strength of newly emerging trends.
-
Compare the quality of breakouts across different chart patterns.
-
Build historical databases of breakout performance.
-
Study how market conditions influence breakout success.
-
Evaluate the relationship between breakout quality and measured move completion.
Because every category is defined by objective price behavior, the framework is suitable for both discretionary chart analysis and quantitative research.
Tech Charts Chart Pattern Reliability numbers are compiled over the past 9 years for 8 different classical chart patterns in Global Equity Markets.
Conclusion
Peter Brandt’s Last Full Day Low Rule was originally developed as a disciplined method for controlling risk after a breakout. However, the same reference point can also be used to classify breakout quality.
By combining the Last Full Day Low with the chart pattern’s negation level, breakouts naturally fall into four categories—from explosive momentum moves to complete failures. This classification provides a structured way to analyze how breakouts evolve after entry and offers traders a consistent language for describing their behavior.
The result is a practical framework that bridges risk management and post-breakout analysis, allowing traders not only to protect capital but also to better understand the character and reliability of chart pattern breakouts.