Posts

ENDEAVOUR MINING CORP

Every week Tech Charts Global Equity Markets report features some of the well-defined, mature classical chart patterns under a lengthy watchlist and the chart pattern breakout signals that took place during that week. Global Equity Markets report covers single stocks from developed, emerging and frontier markets, ETF’s and global equity indices. The report starts with a review section that highlights the important chart developments on global equity benchmarks. This blog post features from the watchlist section a flag/rectangle chart pattern that is listed on the Toronto Stock Exchange.

ENDEAVOUR MINING CORP (EDV.TO)

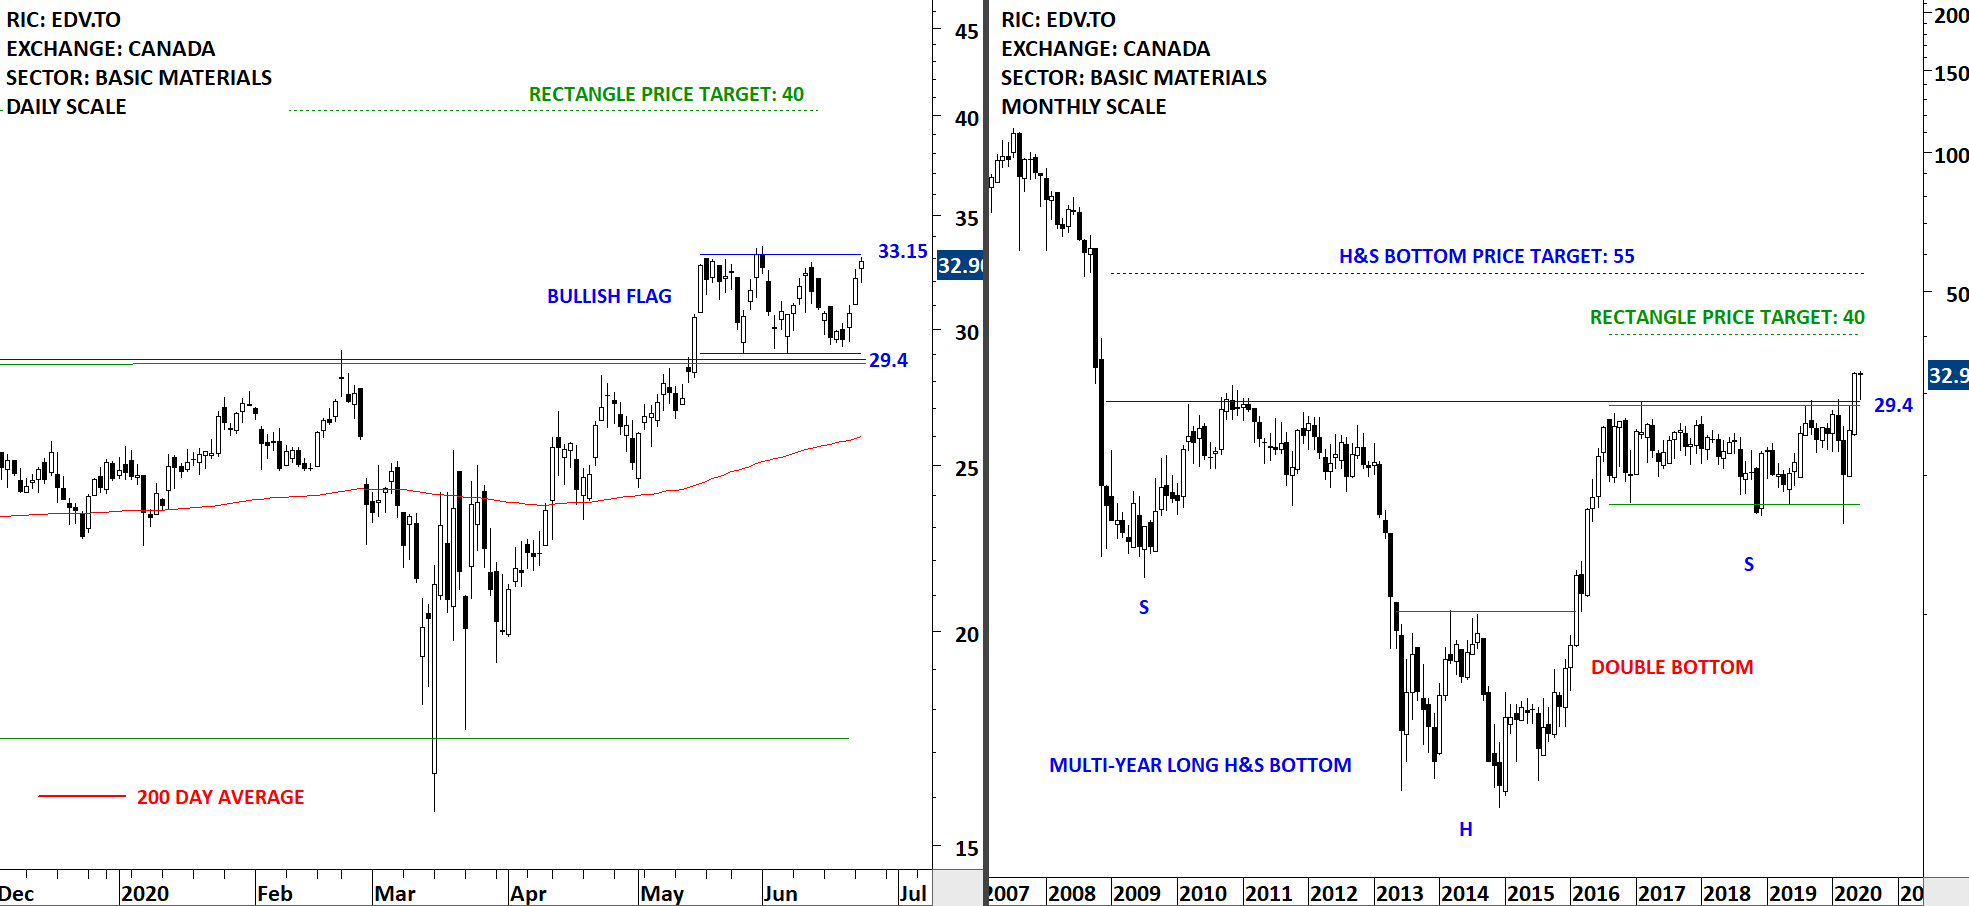
Endeavour Mining Corporation (Endeavour) is an intermediate gold producer. The Company is a gold mining company that operates four mines in Cote d’Ivoire (Agbaou and Ity), Burkina Faso (Karma) and Ghana (Nzema), along with project development and exploration assets. The stock is listed on the Toronto Stock Exchange. I’ve covered Endeavour Mining in the review section of previous reports. The long-term chart completed a multi-year long H&S bottom. The short-term price chart is possibly forming a month-long bullish flag that is acting as a pullback to the previously broken support/resistance. The horizontal boundaries for the bullish flag was tested several times over the course of the chart pattern. Current pullback can offer a new entry for those who missed the May breakout. Given the bullish chart setup on Gold ETF and cash Gold prices, mining companies can benefit from a possible breakout on Gold prices.


Tech Charts Membership

By becoming a Premium Member, you’ll be able to improve your knowledge of the principles of classical charting.

With this knowledge, you can merge them with your investing system. In fact, some investors use my analyses to modify their existing style to invest more efficiently and successfully.

Get Access Now

As a Premium Member of Aksel Kibar’s Tech Charts,

You will receive:

  • Global Equities Report. Delivered weekly.
  • Classical charting principles. Learn patterns and setups.
  • Actionable information. Worldwide indices and stocks of interest.
  • Risk management advice. The important trading points of each chart.
  • Information on breakout opportunities. Identify the ones you want to take action on.
  • Video tutorials. How patterns form and why they succeed or fail.
  • Watch list alerts. As they become available so you can act quickly.
  • Breakout alerts. Usually once a week.
  • Access to everything (now and as it becomes available)
    o Reports
    o Videos and video series
  • Multi-part webinar course. You learn the 8 most common charting principles.
  • Webinars. Actionable and timely advice on breaking out chart patterns.

For your convenience your membership auto renews each year.

Get Access Now

RECTANGLE BREAKOUT OPPORTUNITY

Every week Tech Charts Global Equity Markets report features some of the well-defined, mature classical chart patterns under a lengthy watchlist and the chart pattern breakout signals that took place during that week. Global Equity Markets report covers single stocks from developed, emerging and frontier markets, ETF’s and global equity indices. The report starts with a review section that highlights the important chart developments on global equity benchmarks. This blog post features from the watchlist section a rectangle chart pattern that is listed on the Milan Stock Exchange.

MONCLER SPA (MONC.MI)

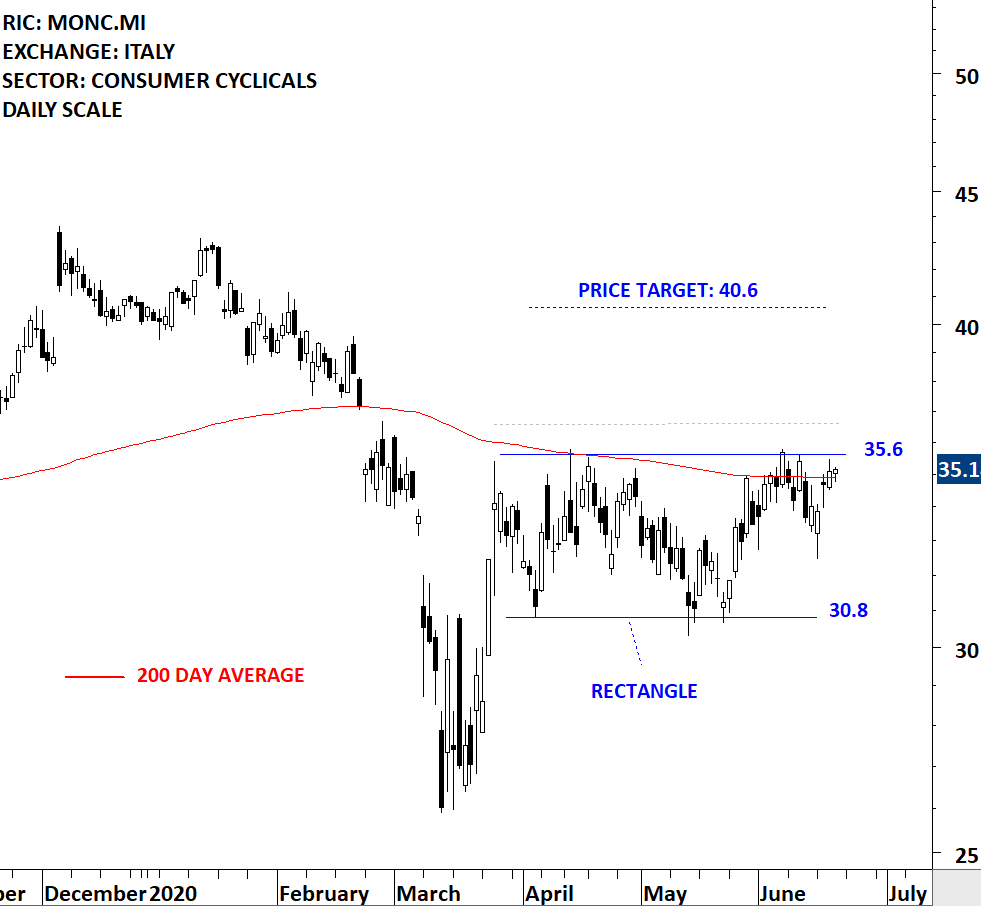
Moncler SpA is an Italy-based company engaged in fashion industry. The Company designs, produces and distributes clothing and accessories through Moncler brand. The stock is listed on the Milan Stock Exchange. Over the past 3 months the stock formed a short-term consolidation between 30.8 and 35.6 levels. The short-term consolidation can be identified as rectangle. A daily close above 36.6 levels will confirm the breakout with the possible chart pattern price target of 40.6 levels. Breakout from the rectangle can also clear the 200-day average which is acting as resistance at the same level. I’ve adjusted the upper boundary of the rectangle to 35.6 levels to better reflect the boundaries of the consolidation range. (Data as of June 18, 2020 CET 10:30 AM) (Learn more: Video Tutorial)


Tech Charts Membership

By becoming a Premium Member, you’ll be able to improve your knowledge of the principles of classical charting.

With this knowledge, you can merge them with your investing system. In fact, some investors use my analyses to modify their existing style to invest more efficiently and successfully.

Get Access Now

As a Premium Member of Aksel Kibar’s Tech Charts,

You will receive:

  • Global Equities Report. Delivered weekly.
  • Classical charting principles. Learn patterns and setups.
  • Actionable information. Worldwide indices and stocks of interest.
  • Risk management advice. The important trading points of each chart.
  • Information on breakout opportunities. Identify the ones you want to take action on.
  • Video tutorials. How patterns form and why they succeed or fail.
  • Watch list alerts. As they become available so you can act quickly.
  • Breakout alerts. Usually once a week.
  • Access to everything (now and as it becomes available)
    o Reports
    o Videos and video series
  • Multi-part webinar course. You learn the 8 most common charting principles.
  • Webinars. Actionable and timely advice on breaking out chart patterns.

For your convenience your membership auto renews each year.

Get Access Now

RECTANGLE BREAKOUT

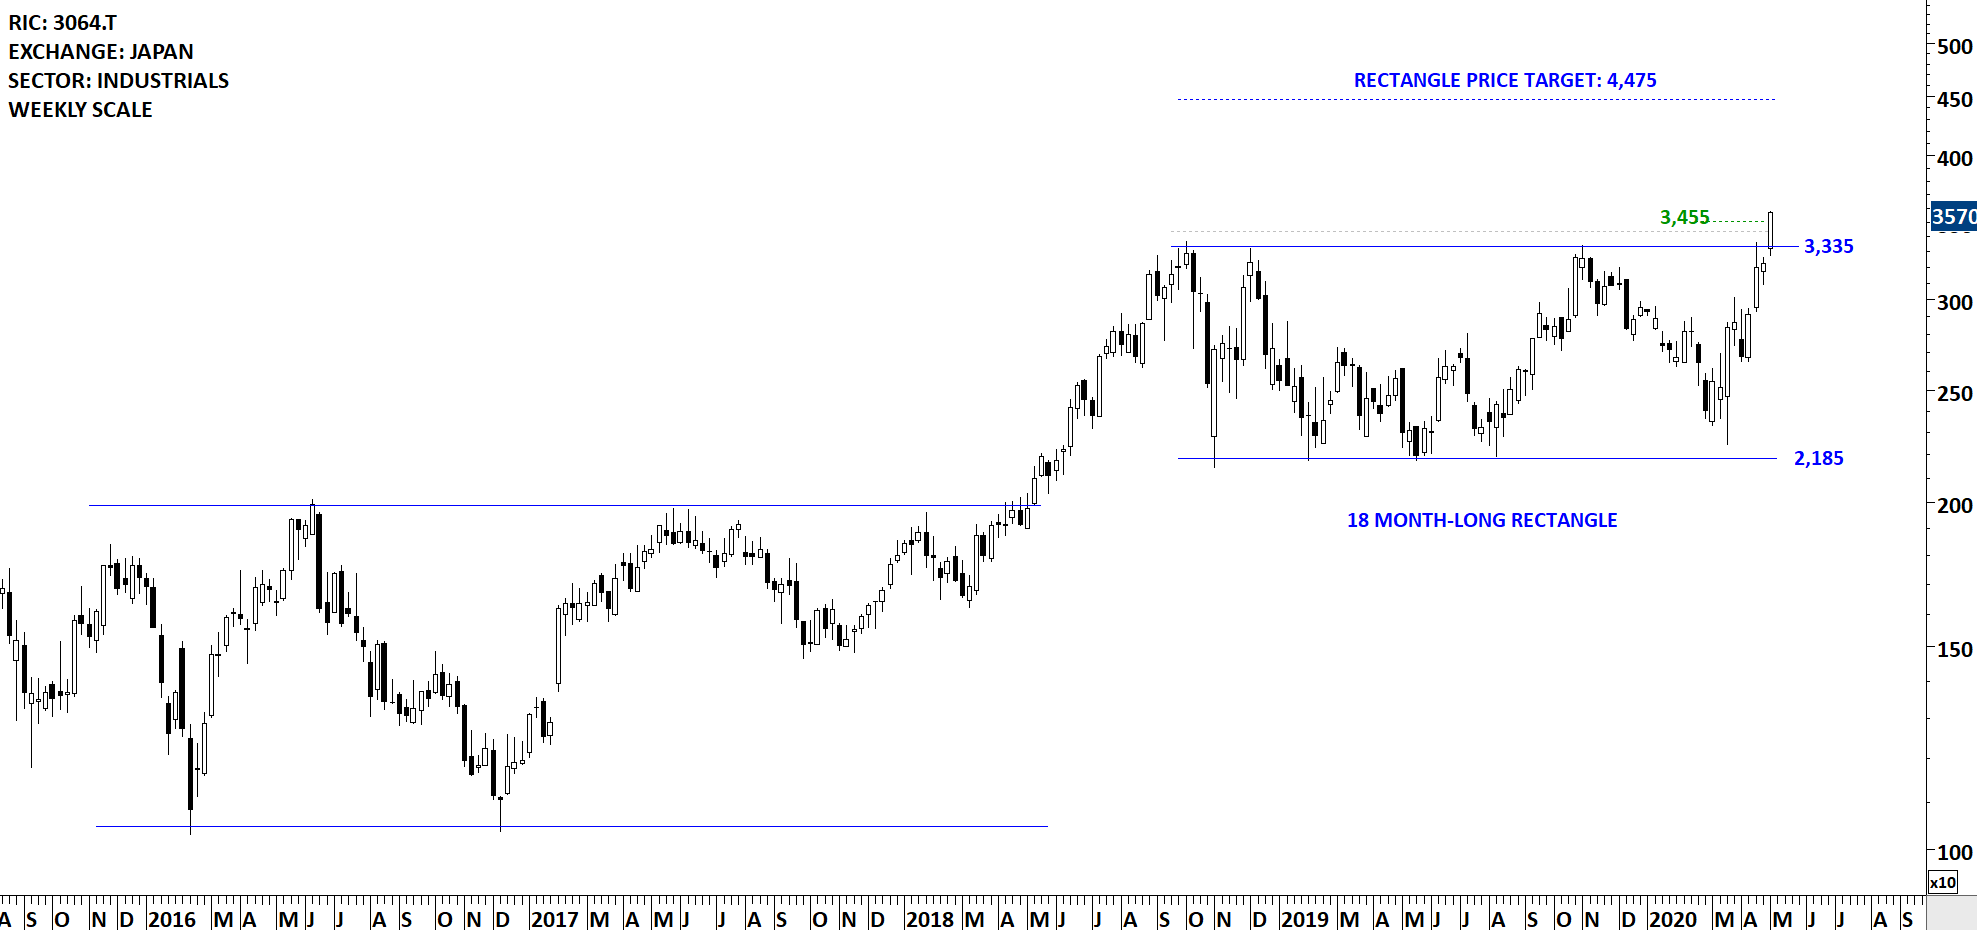
Every week Tech Charts Global Equity Markets report features some of the well-defined, mature classical chart patterns under a lengthy watchlist and the chart pattern breakout signals that took place during that week. Global Equity Markets report covers single stocks from developed, emerging and frontier markets, ETF’s and global equity indices. The report starts with a review section that highlights the important chart developments on global equity benchmarks. This blog post features from the breakout alerts section a rectangle chart pattern that completed on the Nikkei Stock Exchange.

MONOTARO CO LTD (3064.T)

MonotaRO Co.,Ltd. is a Japan-based company principally engaged in the sale of factory indirect materials. The Company sells factory indirect materials to customers, mainly small and medium-sized manufacturing companies in Japan and overseas, by mail order using e-commerce (distribution based on the Internet). The stock is listed on the Tokyo Stock Exchange. Price chart formed an 18 month-long rectangle with the horizontal boundary acting as strong resistance at 3,335.0 levels. The horizontal boundary was tested several times over the course of the chart pattern. The daily close above 3,435.0 levels confirmed the breakout from the 18 month-long rectangle with the possible chart pattern price target of 4,475.0 levels.

Depending on each trader/investor risk profile a stop-loss can be placed below the chart pattern boundary at 3,335 levels. There are different types of breakouts. I discussed 4 types of breakouts in a twitter thread. I also attached it below for your reference.

4 TYPES OF BREAKOUTS


Tech Charts Membership

By becoming a Premium Member, you’ll be able to improve your knowledge of the principles of classical charting.

With this knowledge, you can merge them with your investing system. In fact, some investors use my analyses to modify their existing style to invest more efficiently and successfully.

Get Access Now

As a Premium Member of Aksel Kibar’s Tech Charts,

You will receive:

  • Global Equities Report. Delivered weekly.
  • Classical charting principles. Learn patterns and setups.
  • Actionable information. Worldwide indices and stocks of interest.
  • Risk management advice. The important trading points of each chart.
  • Information on breakout opportunities. Identify the ones you want to take action on.
  • Video tutorials. How patterns form and why they succeed or fail.
  • Watch list alerts. As they become available so you can act quickly.
  • Breakout alerts. Usually once a week.
  • Access to everything (now and as it becomes available)
    o Reports
    o Videos and video series
  • Multi-part webinar course. You learn the 8 most common charting principles.
  • Webinars. Actionable and timely advice on breaking out chart patterns.

For your convenience your membership auto renews each year.

Get Access Now

RECTANGLE BULLISH CONTINUATION

Every week Tech Charts Global Equity Markets report features some of the well-defined, mature classical chart patterns under a lengthy watchlist and the chart pattern breakout signals that took place during that week. Global Equity Markets report covers single stocks from developed, emerging and frontier markets, ETF’s and global equity indices. The report starts with a review section that highlights the important chart developments on global equity benchmarks. This blog post features from the watchlist section a rectangle chart pattern that is listed on the Hong Kong Stock Exchange.

SINO BIOPHARMACEUTICAL LTD (1177.HK)

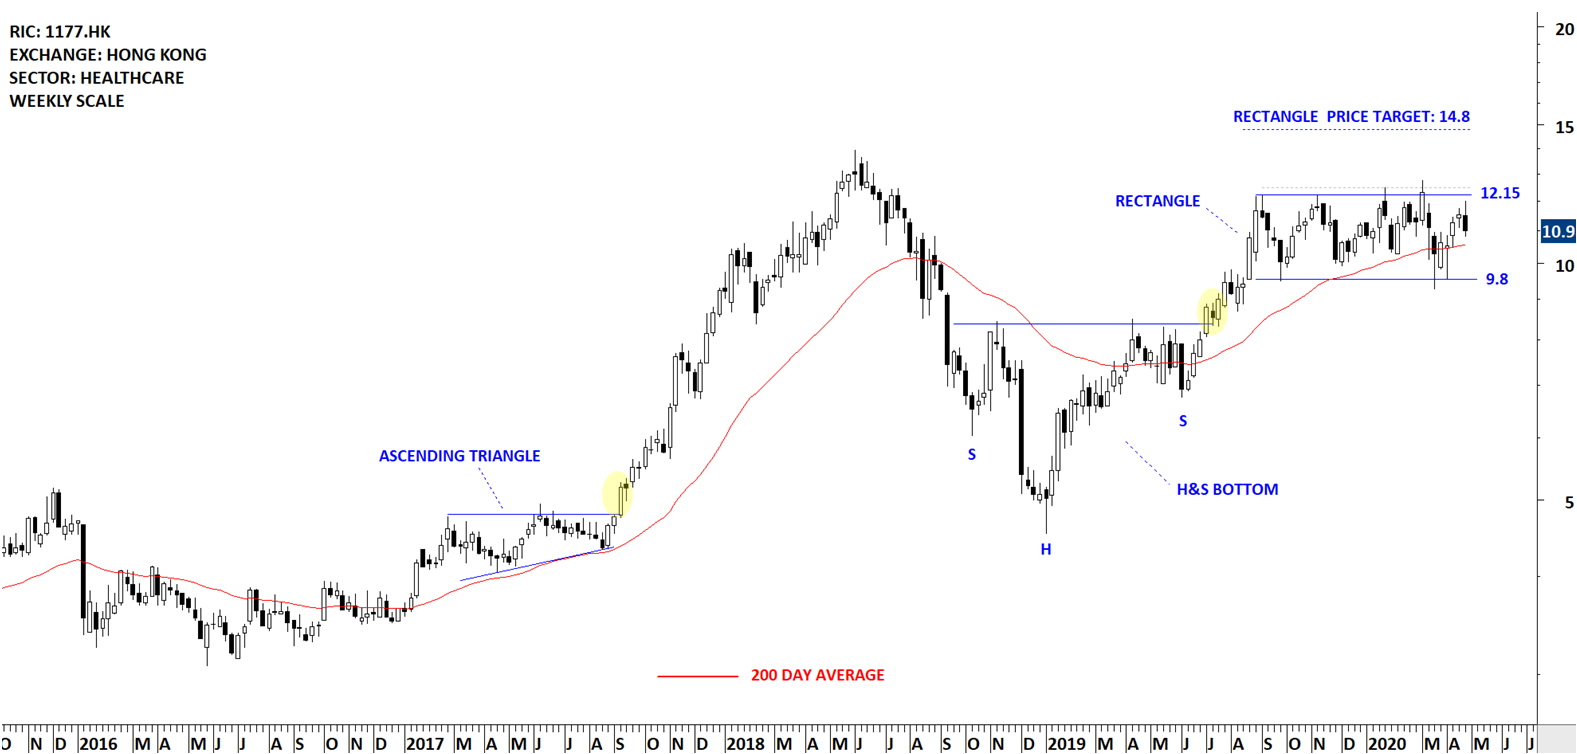
Sino Biopharmaceutical Limited is an investment holding company principally engaged in the medicine products business. The stock is listed on the Hong Kong Stock Exchange. Price chart formed a 6 month-long rectangle with the horizontal boundary acting as strong resistance at 12.15 levels. The horizontal boundary was tested several times over the course of the chart pattern. A daily close above 12.5 levels will confirm the breakout from the 6 month-long rectangle with the possible chart pattern price target at 14.8 levels. Please note that this is a weekly scale price chart and the last weekly candle includes two days of trading. (Data as of April 21, 2020)

The chart below highlights previous well-defined chart patterns and the breakout signals. It is a good case study to go through what I usually look for on price charts.

  • A bullish chart pattern should complete above the 200-day moving average. Likewise a bearish chart pattern should complete below the 200-day moving average. I use 200-day average as a trend filter.
  • Preferably a well-defined chart pattern should have horizontal boundary and the breakout should take place through the horizontal boundary.
  • Before the breakout takes place, the horizontal boundary should be tested several times. Several tests of chart pattern boundary suggests that the technical level is recognized by market participants.
  • Breakout should be taking place from a low volatility condition. Volatility is cyclical. Low volatility is followed by high volatility and vice versa. A low volatility condition presents itself in one of the well-defined classical chart patterns.


Tech Charts Membership

By becoming a Premium Member, you’ll be able to improve your knowledge of the principles of classical charting.

With this knowledge, you can merge them with your investing system. In fact, some investors use my analyses to modify their existing style to invest more efficiently and successfully.

Get Access Now

As a Premium Member of Aksel Kibar’s Tech Charts,

You will receive:

  • Global Equities Report. Delivered weekly.
  • Classical charting principles. Learn patterns and setups.
  • Actionable information. Worldwide indices and stocks of interest.
  • Risk management advice. The important trading points of each chart.
  • Information on breakout opportunities. Identify the ones you want to take action on.
  • Video tutorials. How patterns form and why they succeed or fail.
  • Watch list alerts. As they become available so you can act quickly.
  • Breakout alerts. Usually once a week.
  • Access to everything (now and as it becomes available)
    o Reports
    o Videos and video series
  • Multi-part webinar course. You learn the 8 most common charting principles.
  • Webinars. Actionable and timely advice on breaking out chart patterns.

For your convenience your membership auto renews each year.
Get Access Now

RECTANGLE BULLISH CONTINUATION

Every week Tech Charts Global Equity Markets report features some of the well-defined, mature classical chart patterns under a lengthy watchlist and the chart pattern breakout signals that took place during that week. Global Equity Markets report covers single stocks from developed, emerging and frontier markets, ETF’s and global equity indices. The report starts with a review section that highlights the important chart developments on global equity benchmarks. This blog post features from the watchlist section a rectangle chart pattern that is listed on U.S. Exchange.

MOLINA HEALTHCARE INC (MOH)

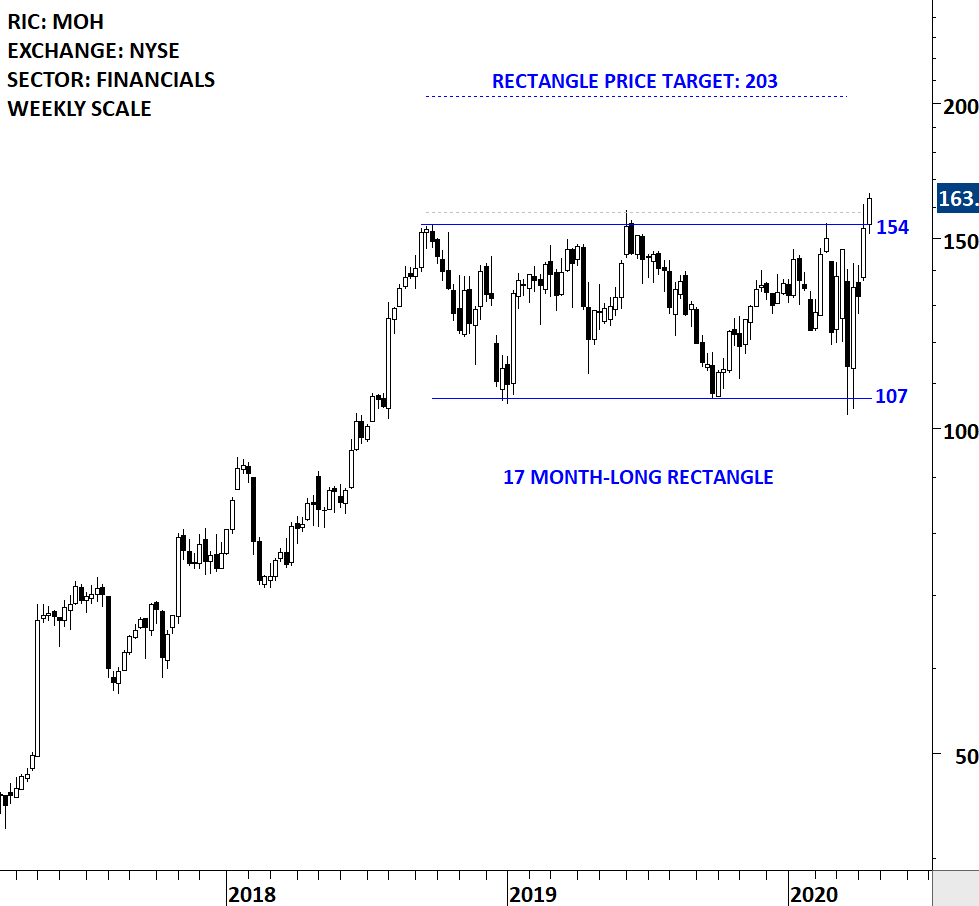
Molina Healthcare, Inc. offers Medicaid-related solutions for low-income families and individuals, and assists government agencies in their administration of the Medicaid program. The stock is listed on the New York Stock Exchange. Price chart formed a 17 month-long rectangle with the horizontal boundary acting as strong resistance at 154.00 levels. The horizontal boundary was tested several times over the course of the chart pattern. The daily close above 158.60 levels confirmed the breakout from the 17 month-long rectangle with the possible chart pattern price target of 203.00 levels. Please note that this is a weekly scale price chart and the last weekly candle includes two days of trading. (Data as of Apr 14, 2020)


Tech Charts Membership

By becoming a Premium Member, you’ll be able to improve your knowledge of the principles of classical charting.

With this knowledge, you can merge them with your investing system. In fact, some investors use my analyses to modify their existing style to invest more efficiently and successfully.

Get Access Now

As a Premium Member of Aksel Kibar’s Tech Charts,

You will receive:

  • Global Equities Report. Delivered weekly.
  • Classical charting principles. Learn patterns and setups.
  • Actionable information. Worldwide indices and stocks of interest.
  • Risk management advice. The important trading points of each chart.
  • Information on breakout opportunities. Identify the ones you want to take action on.
  • Video tutorials. How patterns form and why they succeed or fail.
  • Watch list alerts. As they become available so you can act quickly.
  • Breakout alerts. Usually once a week.
  • Access to everything (now and as it becomes available)
    o Reports
    o Videos and video series
  • Multi-part webinar course. You learn the 8 most common charting principles.
  • Webinars. Actionable and timely advice on breaking out chart patterns.

For your convenience your membership auto renews each year.
Get Access Now

SUPPORT & RESISTANCE

Every week Tech Charts Global Equity Markets report features some of the well-defined, mature classical chart patterns under a lengthy watchlist and the chart pattern breakout signals that took place during that week. Global Equity Markets report covers single stocks from developed, emerging and frontier markets, ETF’s and global equity indices. The report starts with a review section that highlights the important chart developments on global equity benchmarks. This blog post features from the watchlist section a rectangle chart pattern that is listed on U.S. Exchange. The well-defined range can be utilized for trading opportunity between the boundaries until price experiences a confirmed breakout/breakdown. A link is provided here to learn more about Support and Resistances.

KULICKE AND SOFFA INDUSTRIES INC (KLIC.O)

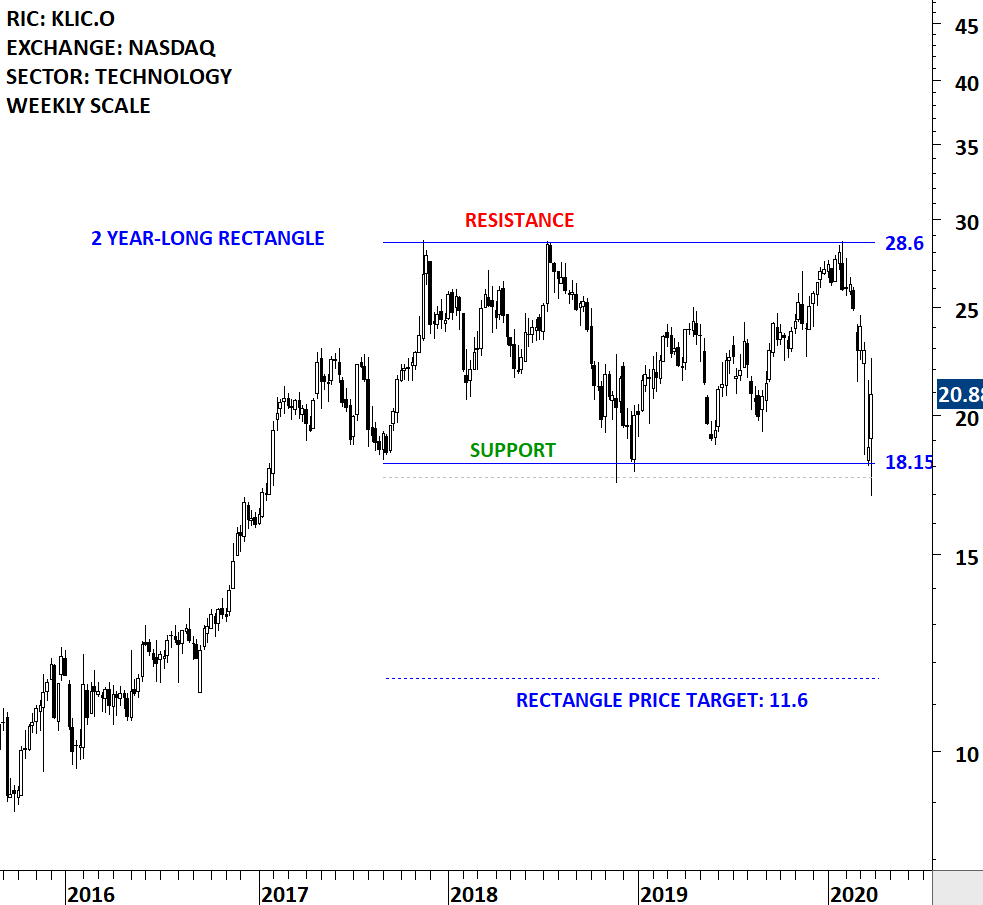
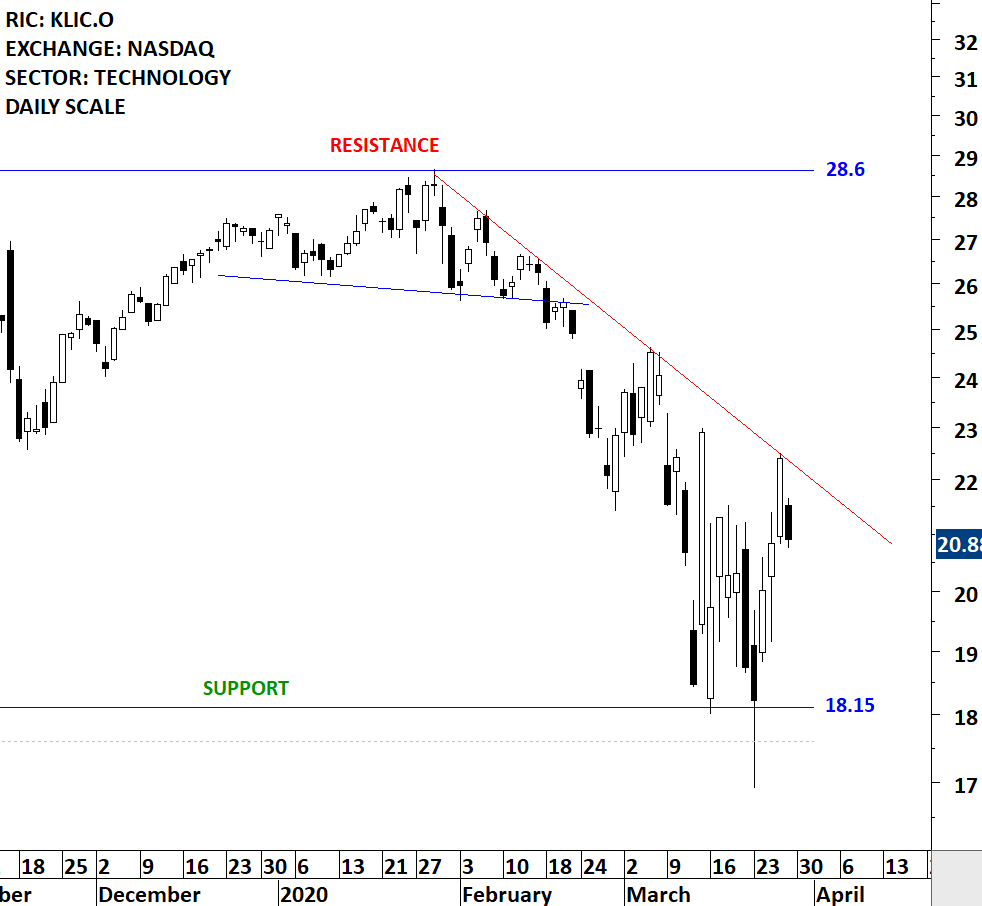
Kulicke and Soffa Industries, Inc. designs, manufactures and sells capital equipment and expendable tools used to assemble semiconductor devices, including integrated circuits (ICs), high and low powered discrete devices, light-emitting diodes (LEDs) and power modules. The stock is listed on the Nasdaq Stock Exchange. Price chart formed a 2 year-long rectangle with the horizontal boundaries acting as strong support at 18.15 levels and resistance at 28.6 levels. Both boundaries were tested several times over the course of the chart pattern. A daily close below 17.6 levels will confirm the breakdown from the 2 year-long rectangle with the possible chart pattern price target of 11.6 levels. Until a breakdown takes place the stock can offer a trading opportunity between the wide range 18.15-28.6. A re-test of the previous low and the support area can form a short-term reversal chart pattern. The daily chart is added below. (Data as of March 27, 2020)


Tech Charts Membership

By becoming a Premium Member, you’ll be able to improve your knowledge of the principles of classical charting.

With this knowledge, you can merge them with your investing system. In fact, some investors use my analyses to modify their existing style to invest more efficiently and successfully.

Get Access Now

As a Premium Member of Aksel Kibar’s Tech Charts,

You will receive:

  • Global Equities Report. Delivered weekly.
  • Classical charting principles. Learn patterns and setups.
  • Actionable information. Worldwide indices and stocks of interest.
  • Risk management advice. The important trading points of each chart.
  • Information on breakout opportunities. Identify the ones you want to take action on.
  • Video tutorials. How patterns form and why they succeed or fail.
  • Watch list alerts. As they become available so you can act quickly.
  • Breakout alerts. Usually once a week.
  • Access to everything (now and as it becomes available)
    o Reports
    o Videos and video series
  • Multi-part webinar course. You learn the 8 most common charting principles.
  • Webinars. Actionable and timely advice on breaking out chart patterns.

For your convenience your membership auto renews each year.

Get Access Now

RECTANGLE – BREAKOUT ALERTS

Every week Tech Charts Global Equity Markets report features some of the well-defined, mature classical chart patterns under a lengthy watchlist and the chart pattern breakout signals that took place during that week. Global Equity Markets report covers single stocks from developed, emerging and frontier markets, ETF’s and global equity indices. The report starts with a review section that highlights the important chart developments on global equity benchmarks. This blog post features from the breakout section two rectangle breakout opportunities that are listed on U.S. Exchanges. The first chart is a breakout on a weekly scale and the second is a shorter-term duration chart pattern breakout taking place on a daily scale.

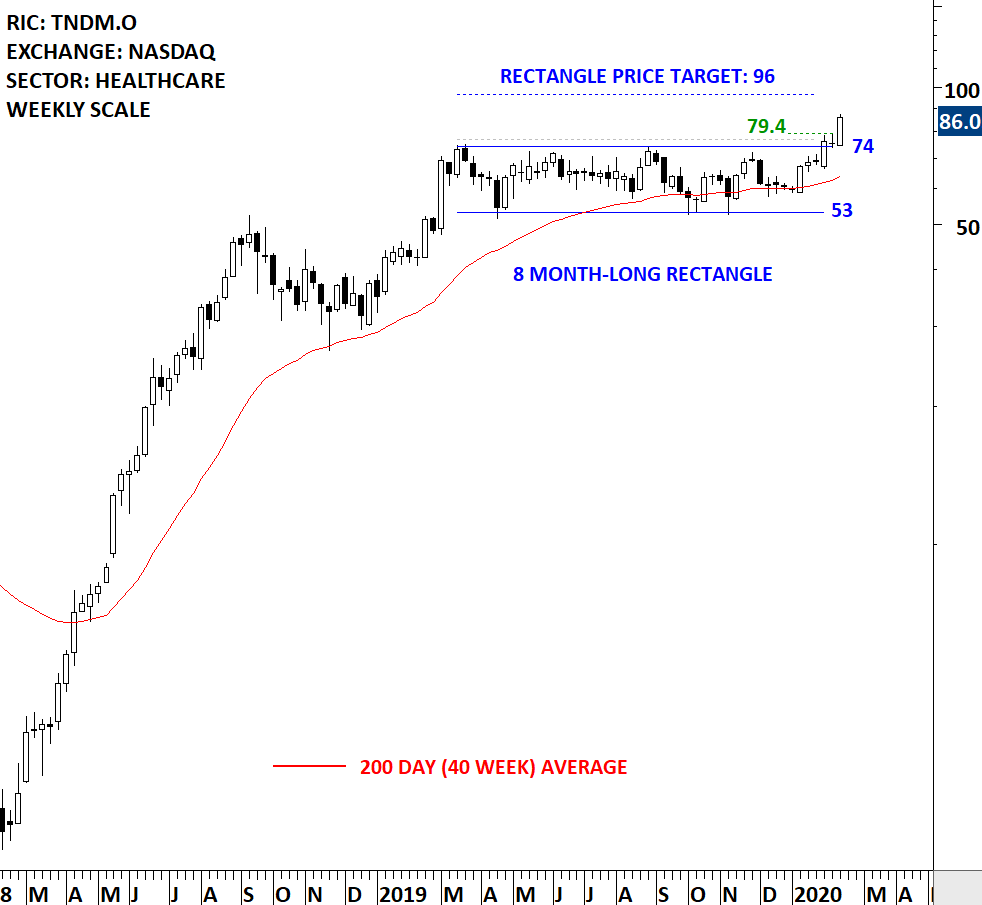
TANDEM DIABETES CARE INC (TNDM.O)

Tandem Diabetes Care, Inc. is a medical device company. The Company is engaged in designing, developing and commercializing products for people with insulin-dependent diabetes. The stock is listed on the Nasdaq Stock Exchange. Price chart formed an 8 month-long rectangle with the horizontal boundary acting as strong resistance at 74.0 levels. The horizontal boundary was tested several times over the course of the chart pattern. The daily close above 77.0 levels confirmed the breakout from the 8 month-long rectangle with the possible chart pattern price target of 96.00 levels. Tight and lengthy consolidations like these can have 2x or even 3x price targets. 2x price target stands at 118 levels (not shown on the chart)

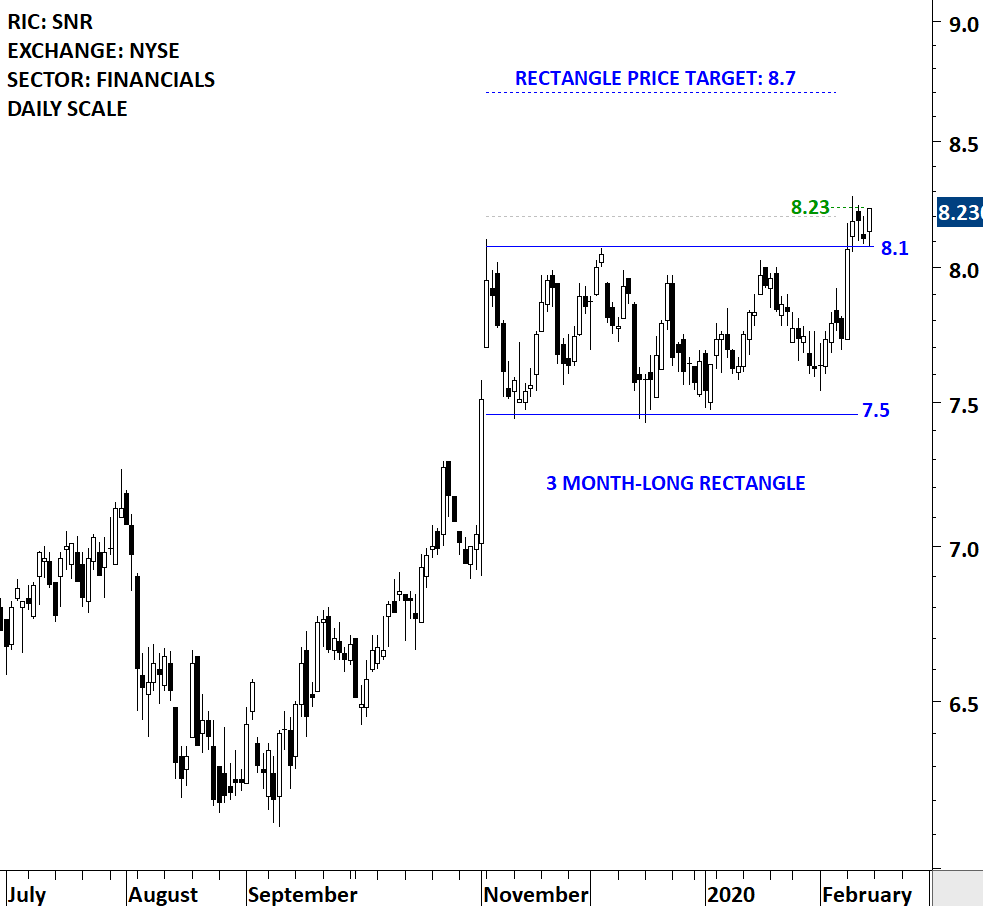
NEW SENIOR INVESTMENT GROUP INC (SNR)

New Senior Investment Group Inc. is a real estate investment trust with a diversified portfolio of primarily private pay senior housing properties located across the United States. The stock is listed on the New York Stock Exchange. Price chart formed a 3 month-long rectangle with the horizontal boundary acting as strong resistance at 8.10 levels. The daily close above 8.20 levels confirmed the breakout from the 3 month-long rectangle with the possible chart pattern price target of 8.70 levels.


Tech Charts Membership

By becoming a Premium Member, you’ll be able to improve your knowledge of the principles of classical charting.

With this knowledge, you can merge them with your investing system. In fact, some investors use my analyses to modify their existing style to invest more efficiently and successfully.

Get Access Now

As a Premium Member of Aksel Kibar’s Tech Charts,

You will receive:

  • Global Equities Report. Delivered weekly.
  • Classical charting principles. Learn patterns and setups.
  • Actionable information. Worldwide indices and stocks of interest.
  • Risk management advice. The important trading points of each chart.
  • Information on breakout opportunities. Identify the ones you want to take action on.
  • Video tutorials. How patterns form and why they succeed or fail.
  • Watch list alerts. As they become available so you can act quickly.
  • Breakout alerts. Usually once a week.
  • Access to everything (now and as it becomes available)
    o Reports
    o Videos and video series
  • Multi-part webinar course. You learn the 8 most common charting principles.
  • Webinars. Actionable and timely advice on breaking out chart patterns.

For your convenience your membership auto renews each year.
Get Access Now

RECTANGLE – HORIZONTAL CHART PATTERN

Every week Tech Charts Global Equity Markets report features some of the well-defined, mature classical chart patterns under a lengthy watchlist and the chart pattern breakout signals that took place during that week. Global Equity Markets report covers single stocks from developed, emerging and frontier markets, ETF’s and global equity indices. The report starts with a review section that highlights the important chart developments on global equity benchmarks. This blog post features from the watchlist section a rectangle breakout opportunity that is listed on Australia Stock Exchange.

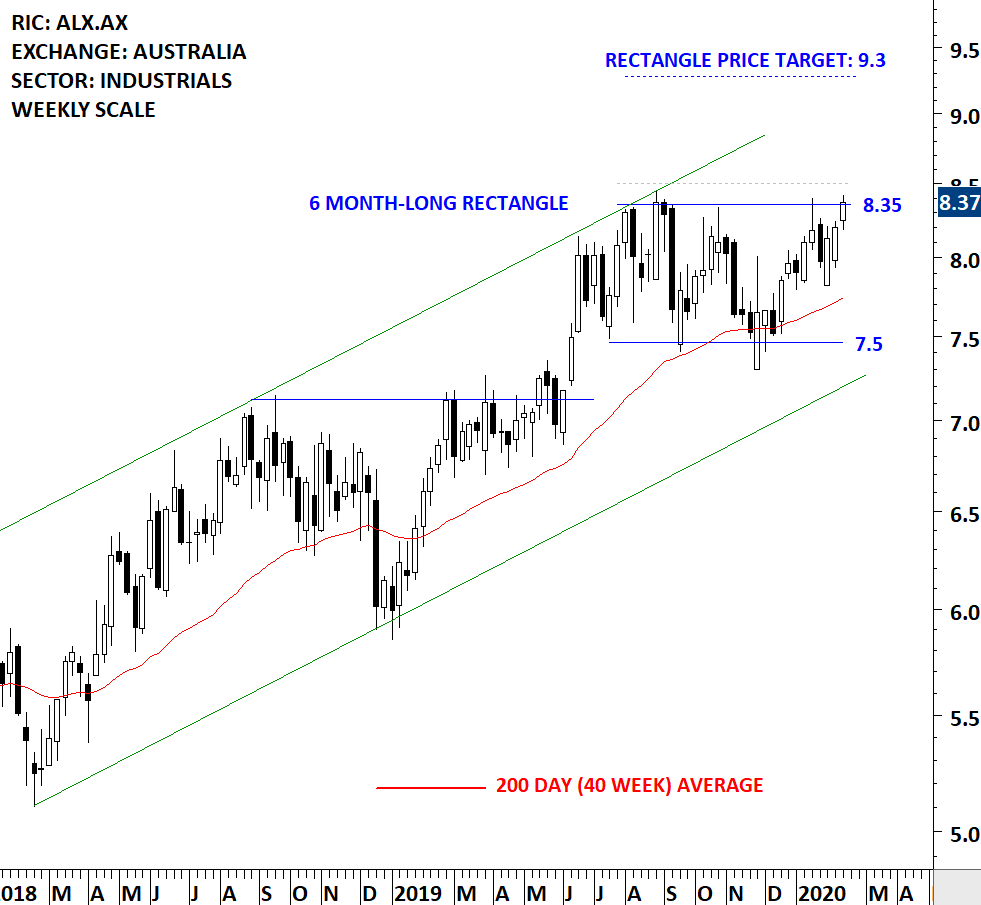
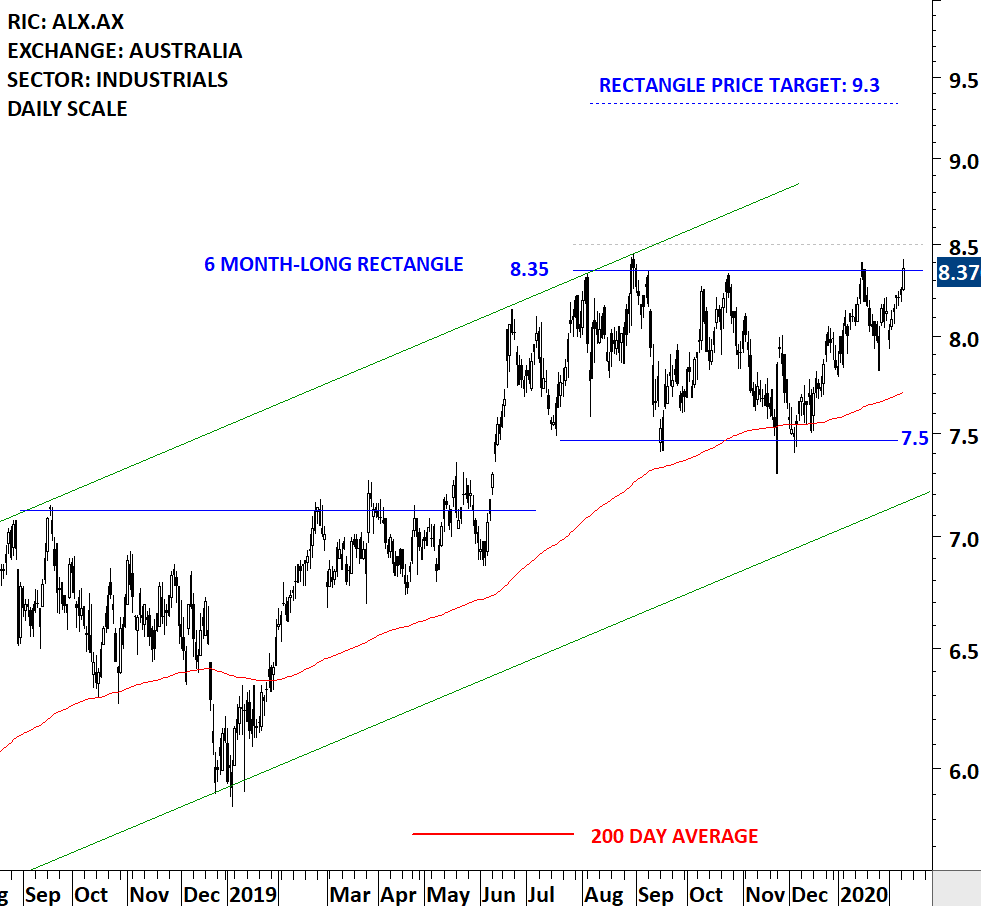
ATLAS ARTERIA GROUP (ALX.AX)

Atlas Arteria Group, formerly Macquarie Atlas Roads Group, is an Australia-based global infrastructure developer, operator and investor. The stock is listed on the Australia Stock Exchange. Price chart formed a 6 month-long rectangle with the horizontal boundary acting as strong resistance at 8.35 levels. The horizontal boundary was tested several times over the course of the chart pattern. A daily close above 8.5 levels will confirm the breakout from the 6 month-long rectangle with the possible chart pattern price target of 9.3 levels. Data as of Feb 11, 2020. Please note that the last weekly candlestick includes only two days of trading. Below you can also find the daily scale price chart.


Tech Charts Membership

By becoming a Premium Member, you’ll be able to improve your knowledge of the principles of classical charting.

With this knowledge, you can merge them with your investing system. In fact, some investors use my analyses to modify their existing style to invest more efficiently and successfully.

Get Access Now

As a Premium Member of Aksel Kibar’s Tech Charts,

You will receive:

  • Global Equities Report. Delivered weekly.
  • Classical charting principles. Learn patterns and setups.
  • Actionable information. Worldwide indices and stocks of interest.
  • Risk management advice. The important trading points of each chart.
  • Information on breakout opportunities. Identify the ones you want to take action on.
  • Video tutorials. How patterns form and why they succeed or fail.
  • Watch list alerts. As they become available so you can act quickly.
  • Breakout alerts. Usually once a week.
  • Access to everything (now and as it becomes available)
    o Reports
    o Videos and video series
  • Multi-part webinar course. You learn the 8 most common charting principles.
  • Webinars. Actionable and timely advice on breaking out chart patterns.

For your convenience your membership auto renews each year.

Get Access Now

Rectangle – Bullish Continuation

This content is for members only