Posts

GLOBAL EQUITY MARKETS – October 27, 2018

REVIEW


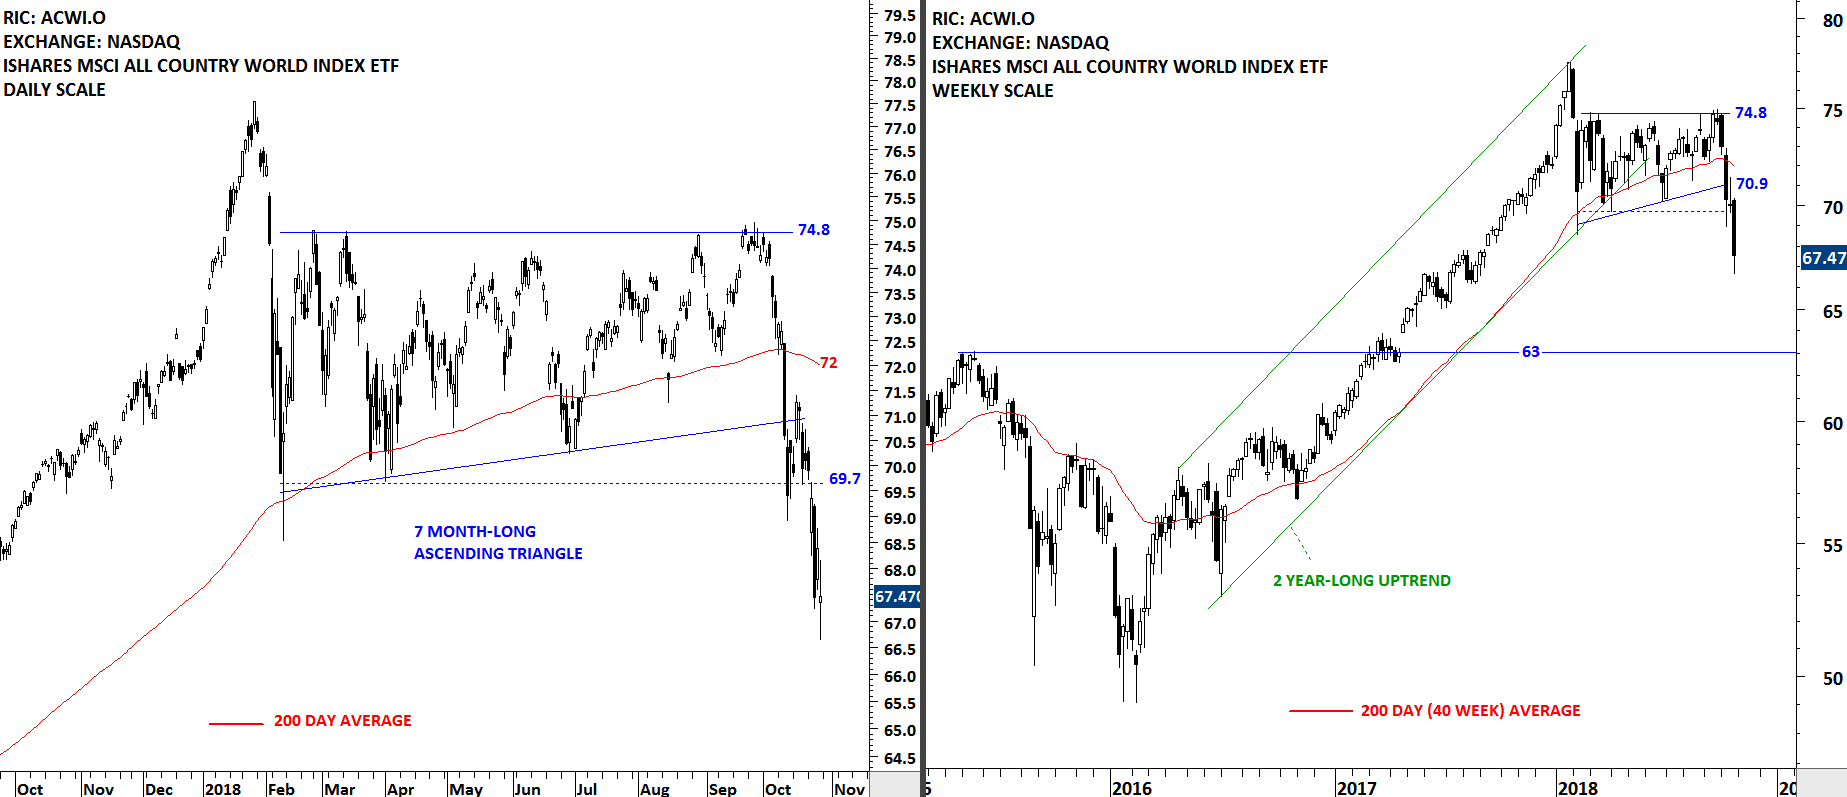
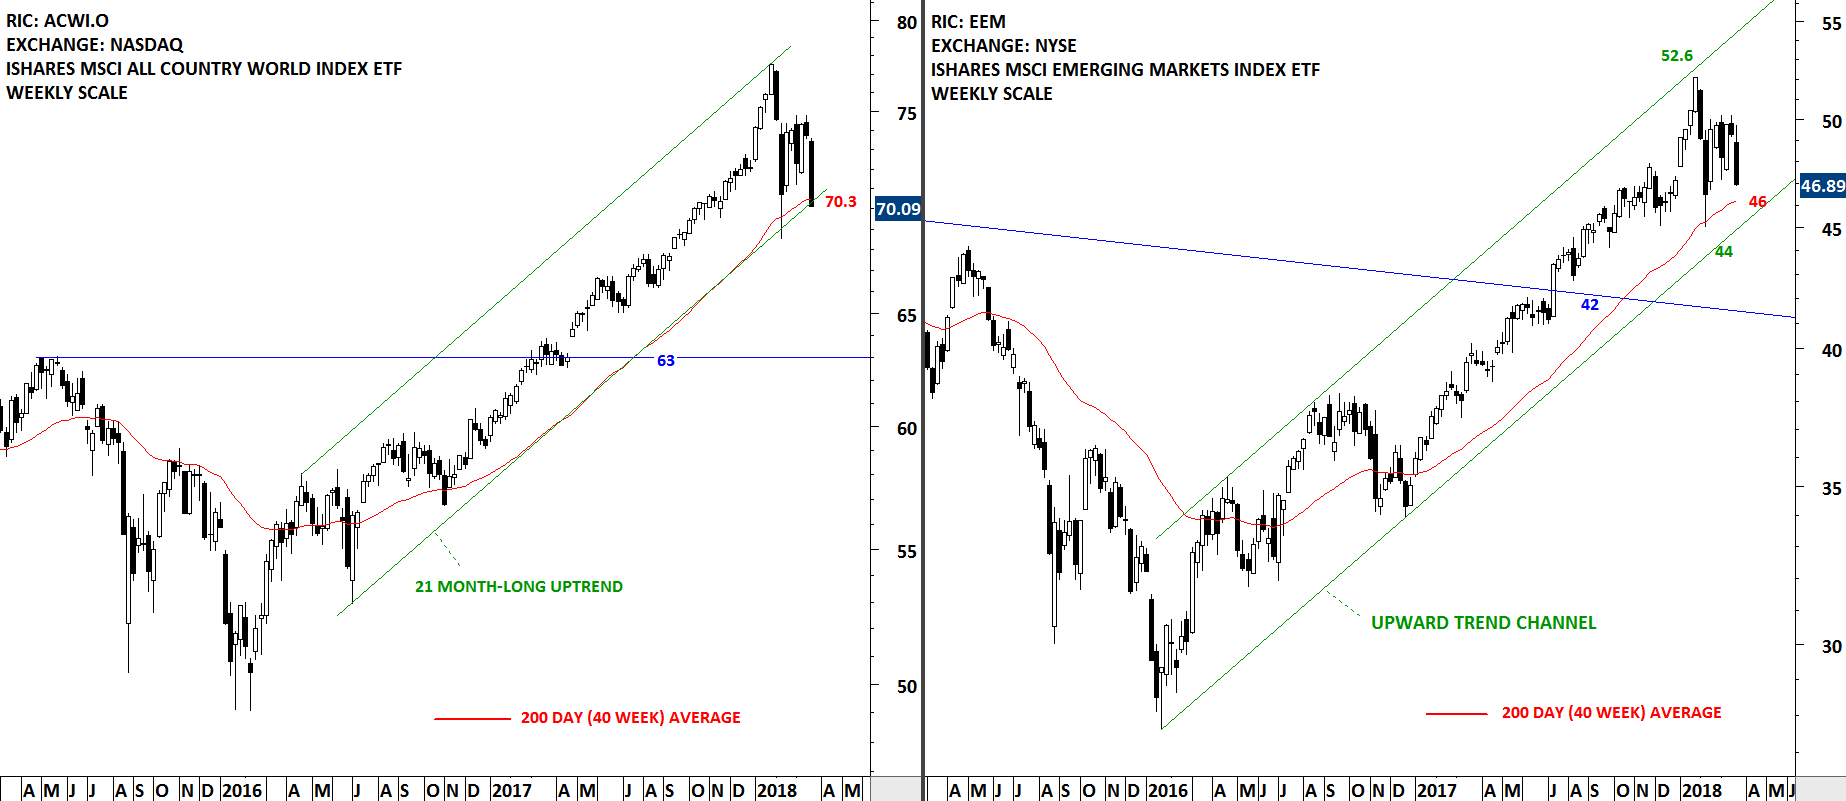
The benchmark for Global equity markets performance, iShares MSCI All Country World Index ETF (ACWI.O) broke down its February lows with a long weekly candle. The ACWI ETF is now clearly below its long-term 200-day moving average. February low at 69.7 levels will become the new strong resistance. Next support area for the ACWI ETF is between 63 and 65. In the short-term the daily chart needs to form some sort of a reversal chart pattern to conclude that the downtrend is over. The iShares MSCI All Country World Index ETF (ACWI.O) is in a downtrend.

Read More

GERMANY DAX 30 INDEX

Every week Tech Charts Global Equity Markets report features some of the well-defined, mature classical chart patterns under a lengthy watchlist and the chart pattern breakout signals that took place during that week. Global Equity Markets report covers single stocks from developed, emerging and frontier markets, ETF’s and global equity indices. The report starts with a review section that highlights the important chart developments on global equity benchmarks. This blog post features a possible head and shoulder top on Germany XETRA DAX Index.

Read More

GLOBAL EQUITY MARKETS – April 7, 2018

REVIEW


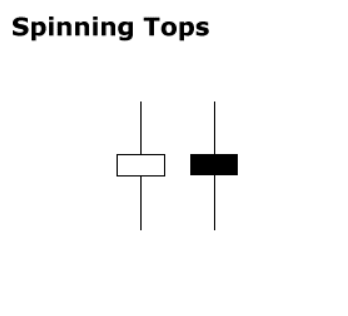
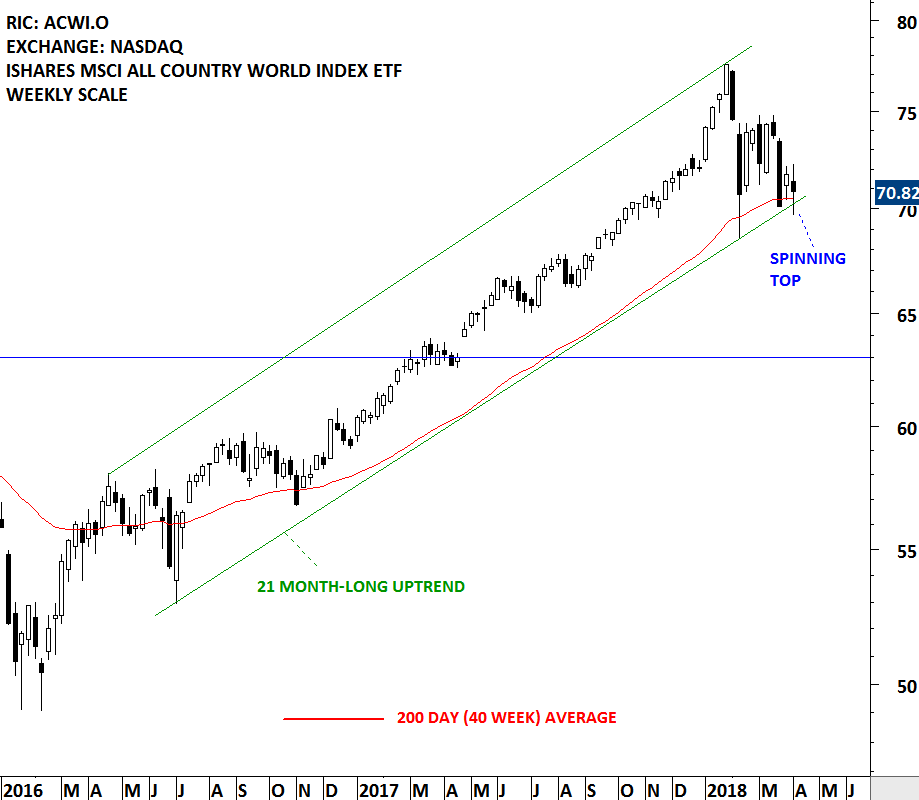
Indecision. Jury is still out. This week's price action is best explained with the help of candlestick patterns definitions. Spinning top is a candlestick with a long upper shadow, long lower shadow, and small real body. One long shadow represents a reversal of sorts; spinning tops represent indecision. The small real body (whether hollow or filled) shows little movement from open to close, and the shadows indicate that both bulls and bears were active during the session. Even though the week opened and closed with little change, prices moved significantly higher and lower in the meantime. Neither buyers nor sellers could gain the upper hand and the result was a standoff. After a long advance or long white candlestick, a spinning top indicates weakness among the bulls and a potential change or interruption in trend. After a long decline (I think this is what we experienced over the past 3 weeks) or long black candlestick, a spinning top indicates weakness among the bears and a potential change or interruption in trend.

Read More

GLOBAL EQUITY MARKETS – March 31, 2018

REVIEW


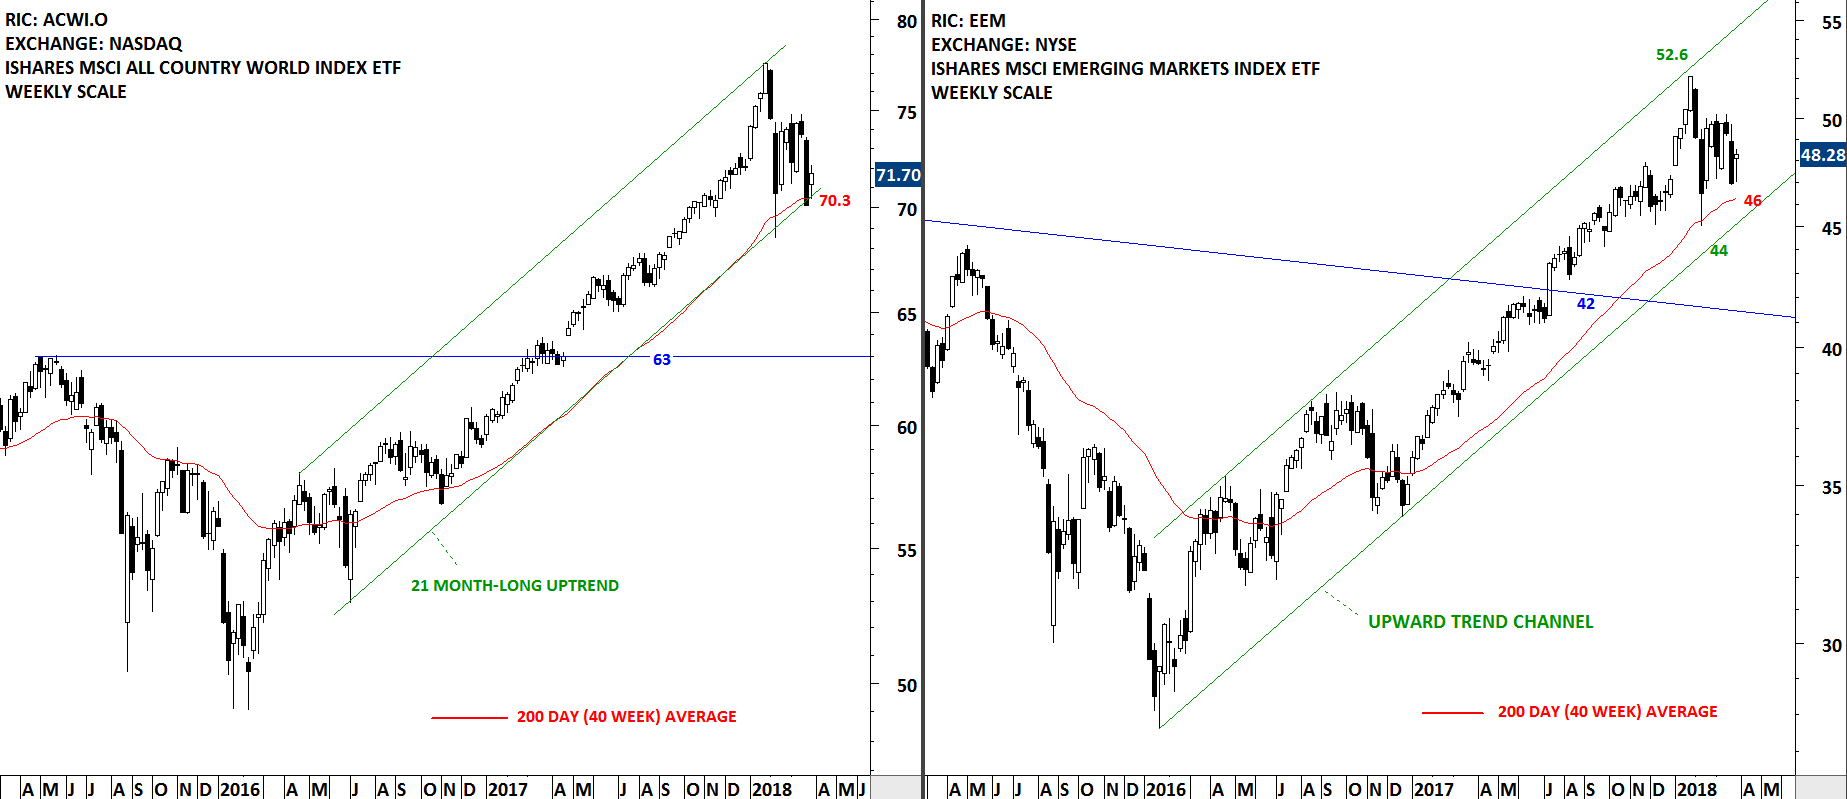
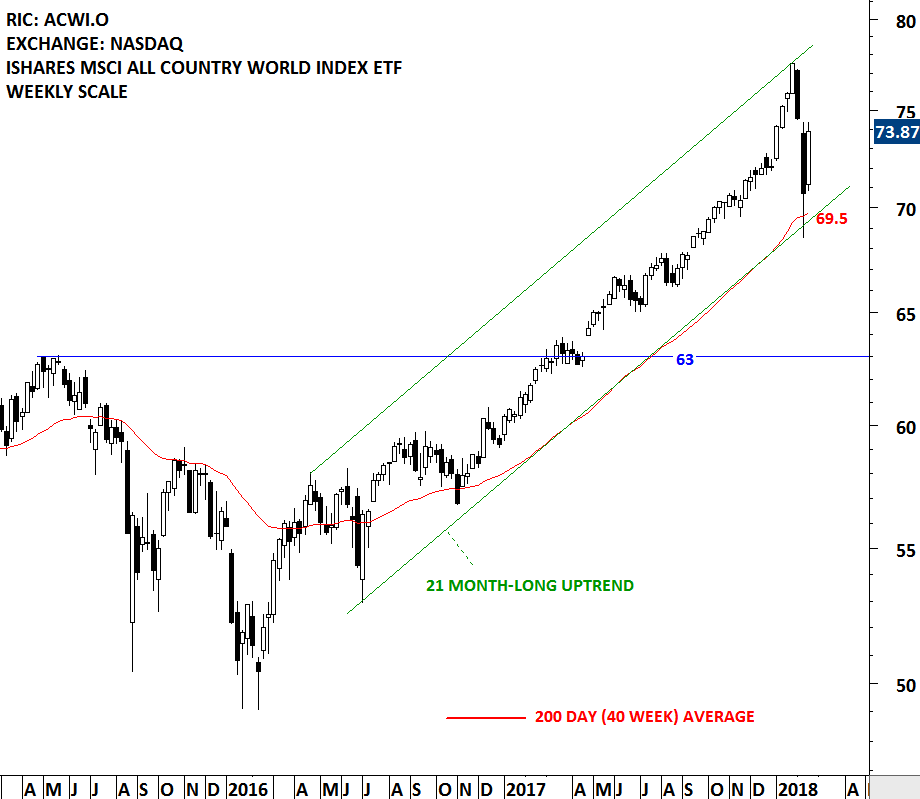
Global equity markets are still holding above their long-term support levels. A benchmark that I'm following for Global equity market performance, the iShares MSCI All Country World Index ETF (ACWI.O) rebounded once again from the 200-day (40 week) moving average and the lower boundary of its 2 year-long trend channel. The benchmark for Emerging Markets equities performance, the iShares MSCI Emerging Markets Index ETF (EEM) is trading above its long-term average and still far from the lower boundary of its multi-month long uptrend. A breakdown below the lower boundary of the trend channel and the 200-day average at 70.3 levels for the ACWI can result in further weakness. Until we see a breakdown, we will expect the uptrends to resume.

Read More

GLOBAL EQUITY MARKETS – March 24, 2018

REVIEW


Both the iShares MSCI All Country World Index ETF and iShares MSCI Emerging Markets Index ETF are headed towards their February lows. Next few weeks will be important as these two Global equity benchmarks will tell us if the 2 year-long uptrend in equities is over or not. Breakdown below long-term averages will also violate the lower boundary of steady upward trend channels. While the iShares MSCI Emerging Markets index has margin towards the strong support area, the iShares MSCI All Country World Index closed the week at the support level. Unless we see a stability above 70 levels, the ETF can correct towards the next support at 63 levels.

Read More

GLOBAL EQUITY MARKETS – March 3, 2018

Reminder on Live Webinar

Due to very positive feedback we got for the last webinar on rectangle chart patterns, we are continuing the webinar series with another reliable horizontal chart pattern; the ascending triangle. Live Webinar and Q&A with Aksel - Thursday, March 8, 11am mountain. You can register here (Register for the Live Webinar)


REVIEW


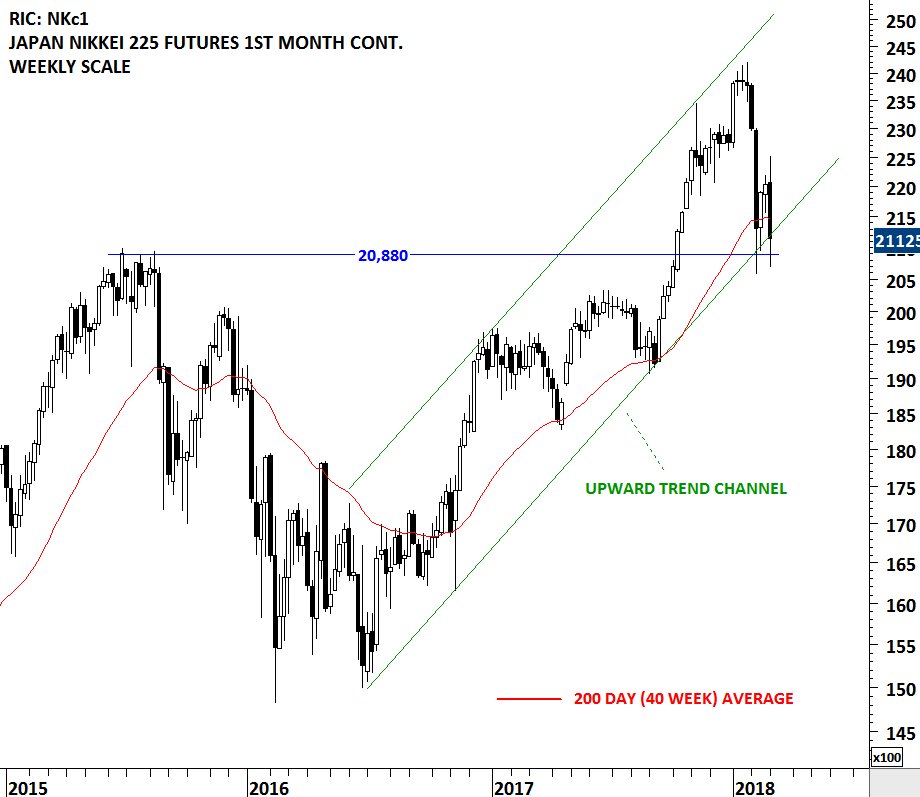
Equity indices that had weak rebound from the lows, tested the same support areas. Japan's Nikkei Index is one of them. On the weekly scale we can see that the upward trend channel is still intact with the support forming at 20,880 levels. On the daily scale price chart (futures price data to capture Friday's close) we can see that the Friday's recovery on U.S. indices helped the Nikkei Futures to form a Doji candlestick at the support. Failure to hold these levels can result in a larger scale correction. In the short-term Japan's Nikkei will try to find support around 20,880 levels and if it succeeds we will possibly label the price action as a double bottom.

Read More

GLOBAL EQUITY MARKETS – February 17, 2018

REVIEW


Global Equity Markets had a strong rebound from their long-term averages. A benchmark for Global equity market performance; the iShares MSCI All Country World Index ETF rebounded from its 200-day (40 week) average and the lower boundary of its multi-month long upward trend channel. Long-term uptrend remains intact. In the following weeks Global equity indices will possibly continue to consolidate in a range until volatility is back to lower levels. In case of a re-test of last week's lows, both the lower boundary of the uptrend and the long-term average will act as strong support levels.

Read More

GERMANY DAX INDEX

GERMANY DAX INDEX - DAILY SCALE

GERMANY DAX INDEX – DAILY SCALE

Germany’s DAX Index breaks out of a 4 month-long rectangle chart pattern with a possible break-away gap. Tech Charts blog drew attention to the developing chart pattern in the last week of November (Germany Dax Index – 20/11/2016). Today’s price action cleared the strong 4 month-long horizontal resistance at 94.60 levels. For common stocks, Edwards and Magee in their book Technical Analysis of Stock Trends suggest that for a breakout confirmation a daily close by a 2.5%-3% margin above resistance level is required. While, this margin can be perfectly fine for stocks, for indices, commodities and currencies it could result in a delayed entry. More appropriate threshold could be a daily close by a margin of 0.5%-1% above the resistance area for indexes, commodities and currencies.

Breakout on Germany’s DAX index cleared that threshold (grey dashed line at 10,910) with a strong daily close and confirmed the breakout from the 4 month-long rectangle chart pattern. Rectangle is a continuation chart pattern. Breakout not only took place with a strong daily close but also with a possible break-away gap. Richard Schabacker in his pioneering research (Technical Analysis and Stock Market Profits) on classical charting, explains break-away gaps as follows:

Break-away gap appears at the beginning of a movement and generally comes at the completion of some definite area formation. It is seldom covered for some time in the future and, when it proceeds from a strong major bottom formation, it may never be covered, or at least not until the return of prices in the next great cycle some years later. The Break-away gap is comparatively uncommon and indicates a definite change in the technical picture…The logical conclusion is, therefore, for a continuation of that strong movement in the direction toward which the gap was made.

As a matter of fact, it is always difficult and frequently impossible to be certain whether a gap is of the Common or Break-away variety at the instant that the gap appears. This is the principal reason why we cannot place too much credence in the various gap theories and why we must consider gaps as of only secondary importance in forecasting. The fact remains that most gaps which lead decisively out of an established pattern are not closed; they become and remain true Break-away gaps. And the wider the Break-away gap at the breakout, the less likely it is to be closed.

In brief, the Break-away gap emphasizes the breakout of prices and indicates a sudden change in the technical picture, but the mere fact that prices have broken decisively out of a technical formation is of greater importance than the gap. When the evidence of the gap is added to all the other evidences of a decisive breakout, we are encouraged to act promptly and decisively.

For stock traders, I attached below the ISHARES DAX UCITS ETF that is listed in Germany. Price chart of the ETF is very similar to the index as it tracks the performance of the XETRA DAX index. The upper boundary of the rectangle was standing at 94.60. With the decisive breakout I initiated a long position with a stop-loss slightly below the boundary at 93.30 levels. Rectangle chart pattern price target is at 100 levels for the ISHARES DAX ETF. Tech Charts twitter followers can find chart pattern breakout signals under #TECHCHARTSALERT

ISHARES DAX UCITS ETF - DAILY SCALE

ISHARES DAX UCITS ETF – DAILY SCALE

PORSCHE AUTO HOLDING (PSHG_p.DE)

Strength in European equities can gain momentum. A chart that is currently on my watch list is PORSCHE AUTO HLDG  listed in Germany. Stock is possibly forming a year-long symmetrical triangle that could act as a bottom reversal if the price can clear strong resistance area between 49.65 and 50. A decisive close above 50.85 levels will confirm the breakout from the long-term sideways consolidation. Tech Charts twitter followers can find developing chart patterns under #TECHCHARTSWATCHLIST

PORSCHE AUT HLDG - WEEKLY SCALE

PORSCHE AUT HLDG – WEEKLY SCALE

GERMANY DAX INDEX

Germany’s DAX Index is forming a 4 month-long rectangle chart pattern. Rectangles are classified as continuation chart patterns. Breakouts are usually in the direction of the previous trend. Since the beginning of 2016, DAX index is in a uptrend. Since mid-August the index has been in a sideways consolidation between 10,200 and 10,800. The index tested the upper boundary of the rectangle for four times over the past four months. Breakout above 10,800 will be positive and suggest higher levels. Chart pattern price target stands at 11,400 levels.

WEEKLY SCALE PRICE CHART OF DAX INDEX

WEEKLY SCALE PRICE CHART OF DAX INDEX

DAILY SCALE PRICE CHART OF DAX INDEX

DAILY SCALE PRICE CHART OF DAX INDEX

There are DAX index futures contracts and index ETFs to trade the price action on the possible breakout. Below is the price chart of the Ishares DAX UCITS ETF (in EUR) listed in Germany. It is one of the most liquid instruments that tracks the performance of the DAX 30 index. On the Ishares DAX UCITS ETF, upper boundary of the rectangle stands at 94.60 levels.

DAILY SCALE PRICE CHART OF ISHARES DAX UCITS ETF

DAILY SCALE PRICE CHART OF ISHARES DAX UCITS ETF

BASIC MATERIALS and ENERGY

In the first few months of 2016, strong performance in Gold and Silver resulted in a sharp rally in precious metal stocks. Several oversold gold and silver mining companies had strong performance over the past few months. Similar bullish theme can take place in the basic materials and energy complex. Some of the commodities in the industrial metals and energy group are in the process of forming major long-term bottoms. The same bullish chart set ups can also be seen in the equities of basic materials and energy companies.

LIGHT CRUDE OIL SEP FUTURES

WTI LIGHT CRUDE is possibly forming a H&S bottom with the neckline standing at $50 levels. This chart is still at the early stages of a H&S formation. A few more weeks of strength will complete the right shoulder of a year-long base formation.

BLOOMBERG INDUSTRIAL METAL SUB INDEX

Formerly known as Dow Jones-UBS Industrial Metals Subindex Total Return (DJUBINTR), the index is a commodity group subindex of the Bloomberg CITR. The index is composed of longer-dated futures contract s on aluminum, copper, nickel and zinc. It reflects the return on fully collateralized futures positions and is quoted in USD. This chart has possibly completed a H&S bottom and currently consolidating above the neckline.

BLOOMBERG ALUMINUM SUB INDEX

Formerly known as Dow Jones-UBS Aluminum Subindex Total Return (DJUBALTR), the index is a single commodity subindex of the Bloomberg CI composed of futures contracts on Aluminum. It reflects the return of underlying commodity futures price movements only and is quoted in USD. The neckline of the year-long base formation stands at 28.20 levels.

NMDC LIMITED

NMDC Limited is an India-based company engaged in the mining of iron ore. The Company’s business segments include Iron Ore and Other minerals & services. The Company is also engaged in the exploration of various minerals, including copper, rock phosphate, lime stone, dolomite, gypsum, bentonite, magnesite, diamond, tin, tungsten, graphite and beach sands. A perfect horizontal resistance (neckline) stands at 105 levels. Breakout above this level will complete a year-long base formation.

FREEPORTMCMORAN

Freeport-McMoRan Inc. (FCX) is a natural resource company with a portfolio of mineral assets, and oil and natural gas resources. The Company’s segments include the Morenci, Cerro Verde, Grasberg and Tenke Fungurume copper mines, the Rod & Refining operations and the U.S. Oil & Gas Operations. It has organized its operations into five primary divisions: North America copper mines, South America mining, Indonesia mining, Africa mining and Molybdenum mines. This is another perfect example of a year-long H&S bottom with the neckline standing at 14.20 levels. Breakout above 14.20 will be bullish and possibly target 25 levels.

TECHNIP

Technip SA (Technip) is engaged in project management, engineering and construction for the energy sector. The Company operates through two segments: Subsea, Onshore/Offshore and Corporate. This stock is listed in France. Over the past year, 53 levels acted as strong resistance. Stock might be completing a year-long base.

WACKER CHEMIE

Wacker Chemie AG is a Germany-based company engaged in chemical industry. The Company operates through four business segments: WACKER SILICONES, which produces silicone products, ranging from silanes through silicone fluids, emulsions, elastomers, sealants and resins to pyrogenic silicas; WACKER POLYMERS, which offers a range of polymeric binders and additives; WACKER POLYSILICON, which provides polysilicon, and WACKER BIOSOLUTIONS, which is the life science division of the Company, offers solutions and products for the food, pharmaceutical and agrochemical industries. While this base formation does not have the perfect symmetry between the left and right shoulders, it is clear from the chart that the horizontal resistance at 86 levels will be critical in the coming weeks. Breakout above 86 will be bullish.