GLOBAL EQUITY MARKETS – July 27, 2019
REVIEW
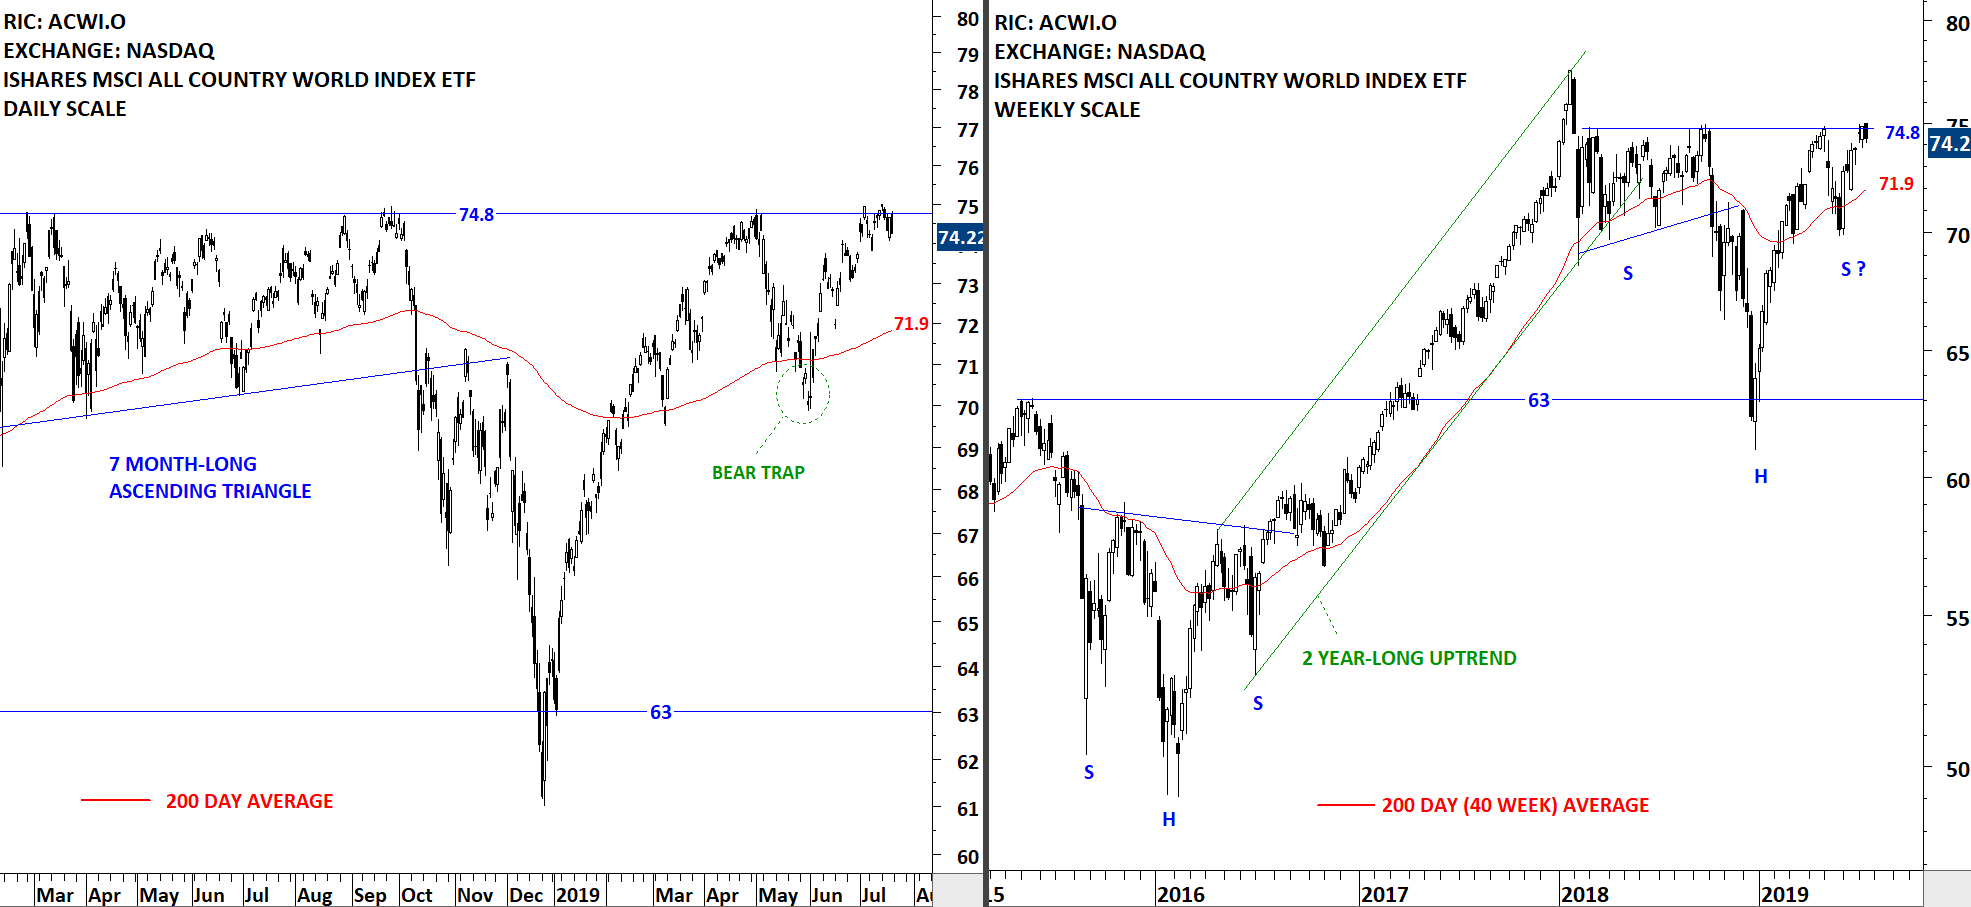
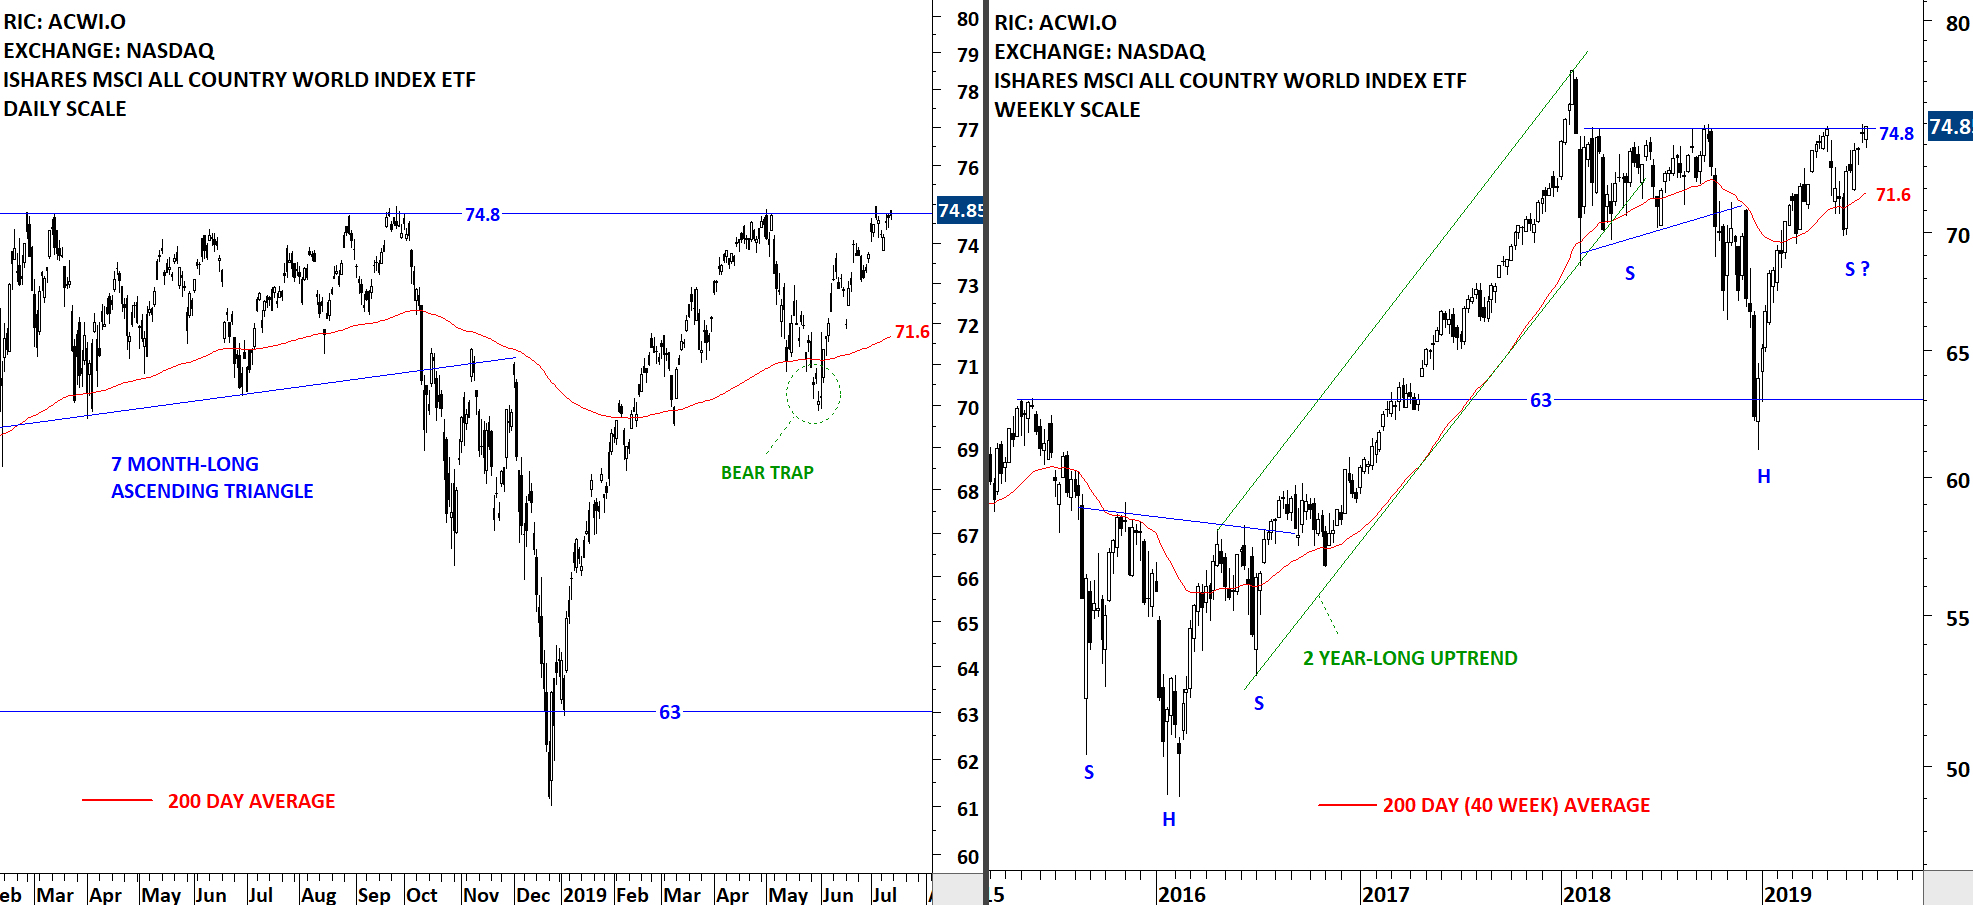
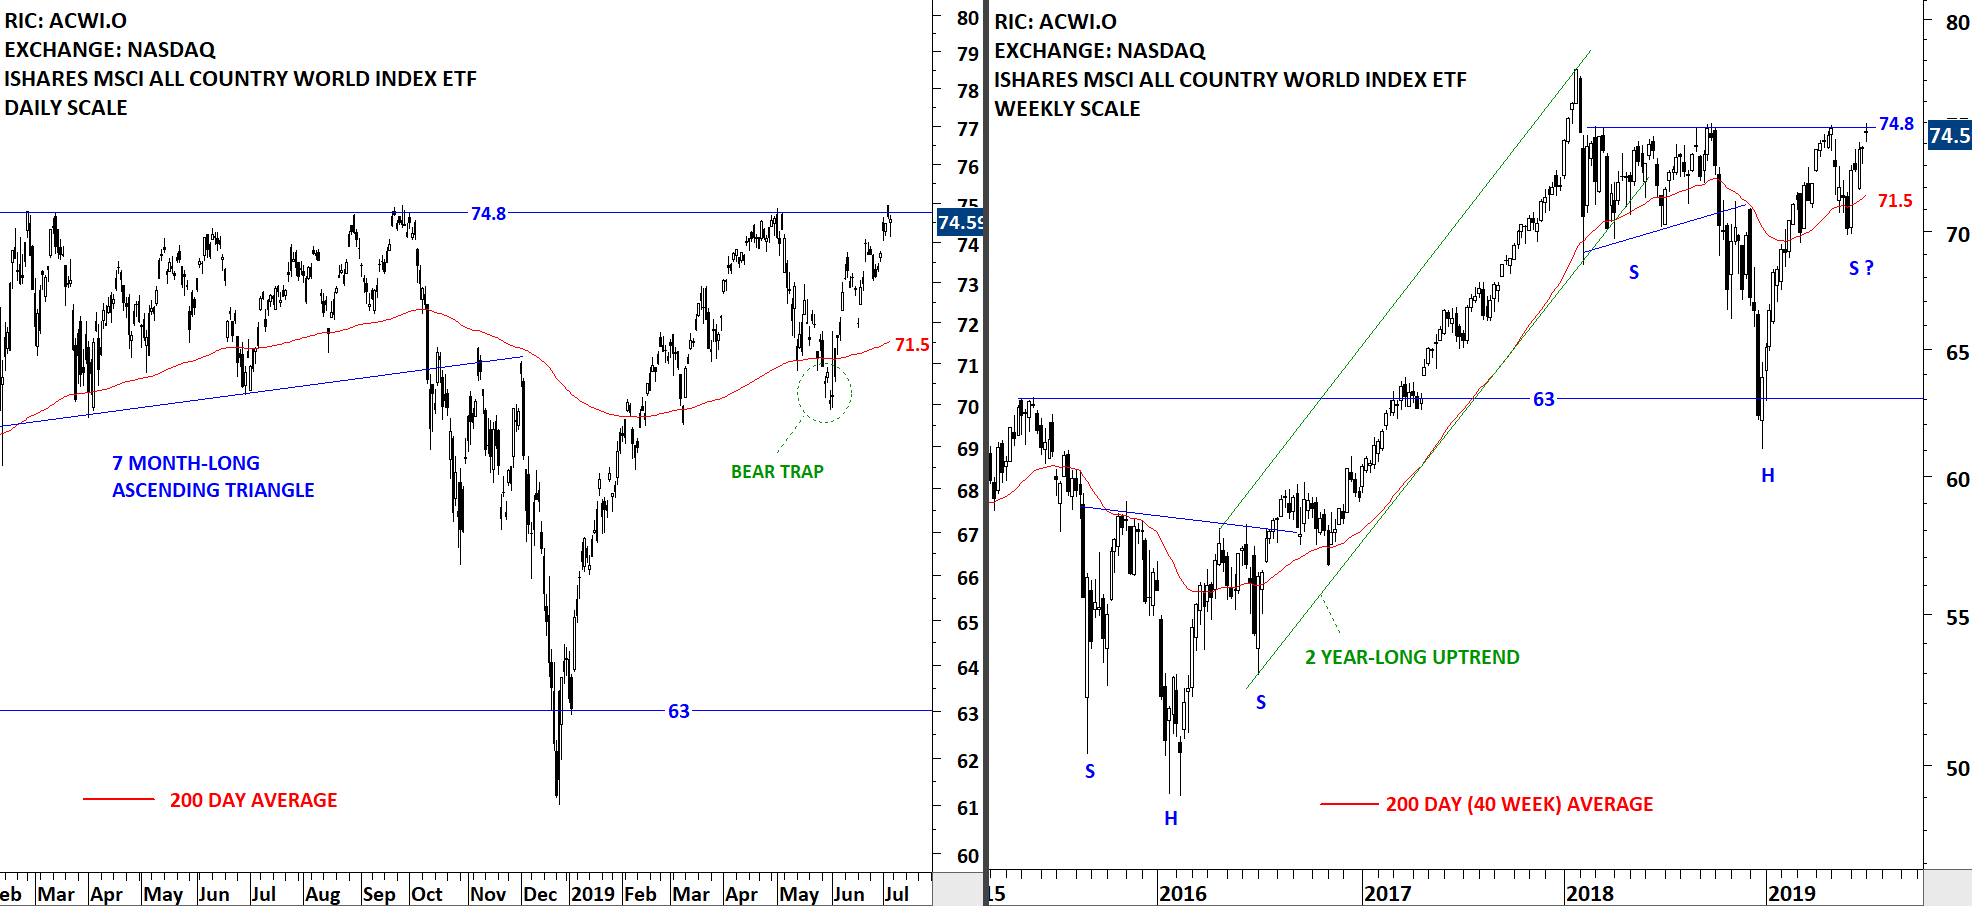
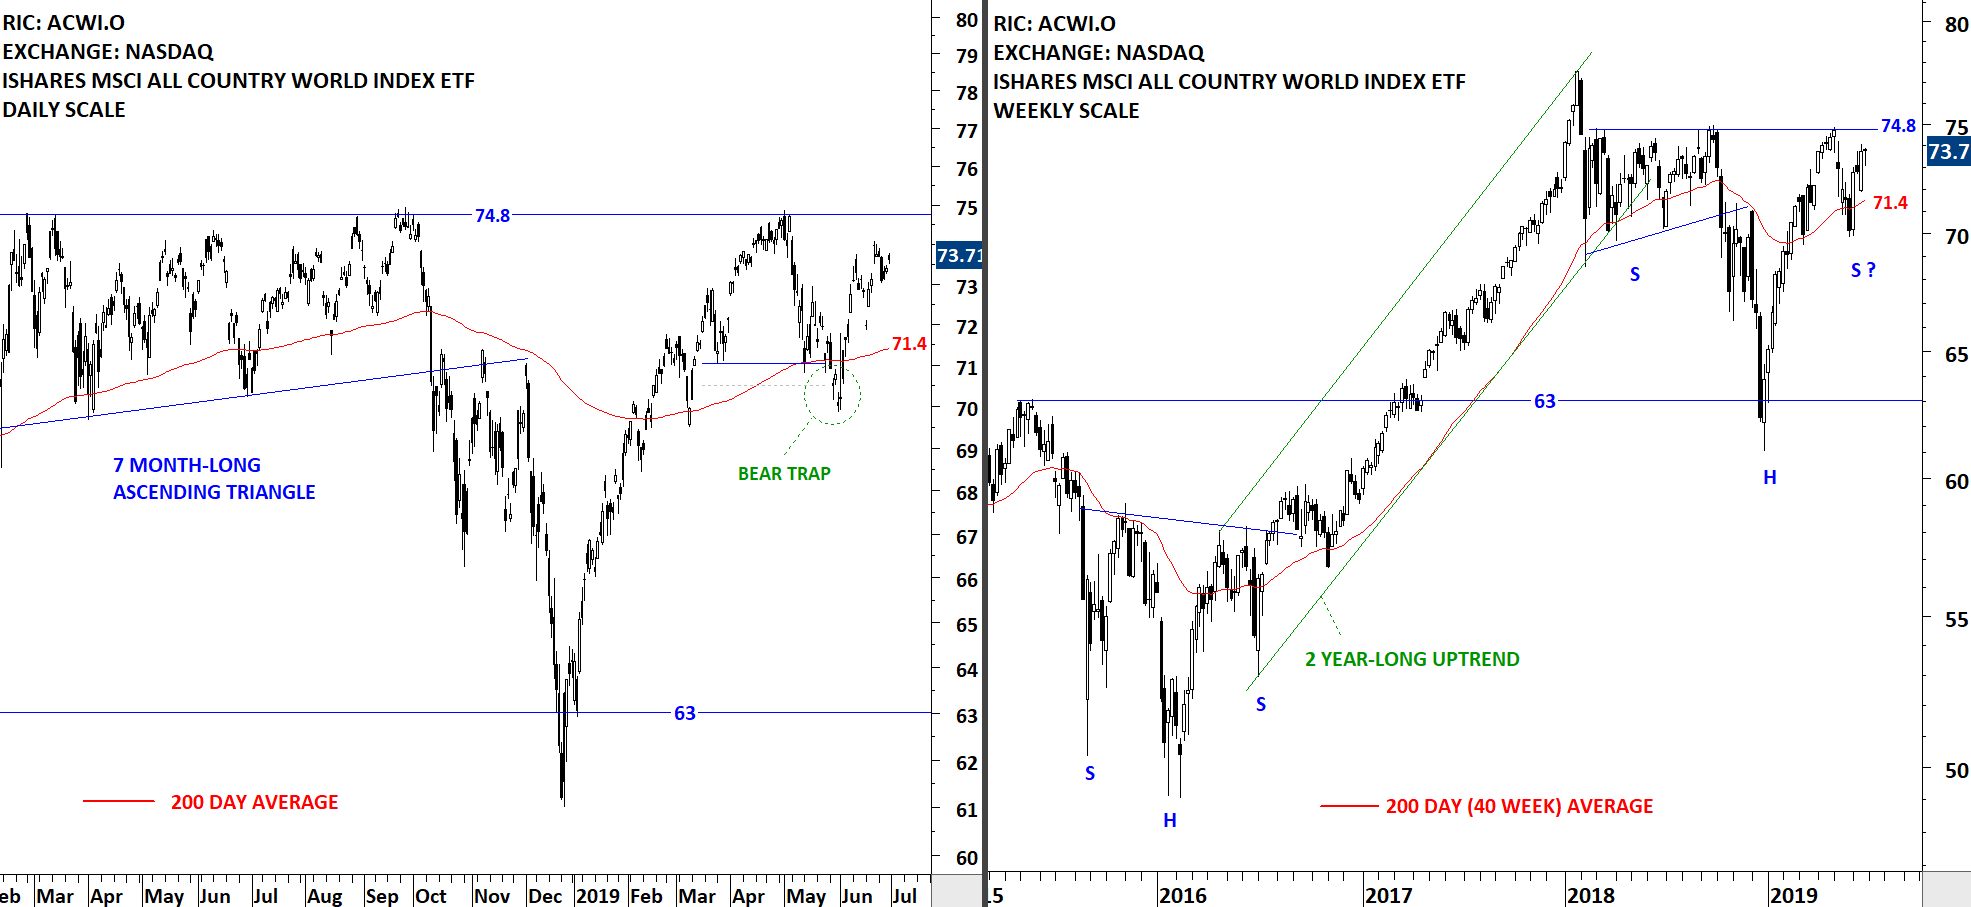
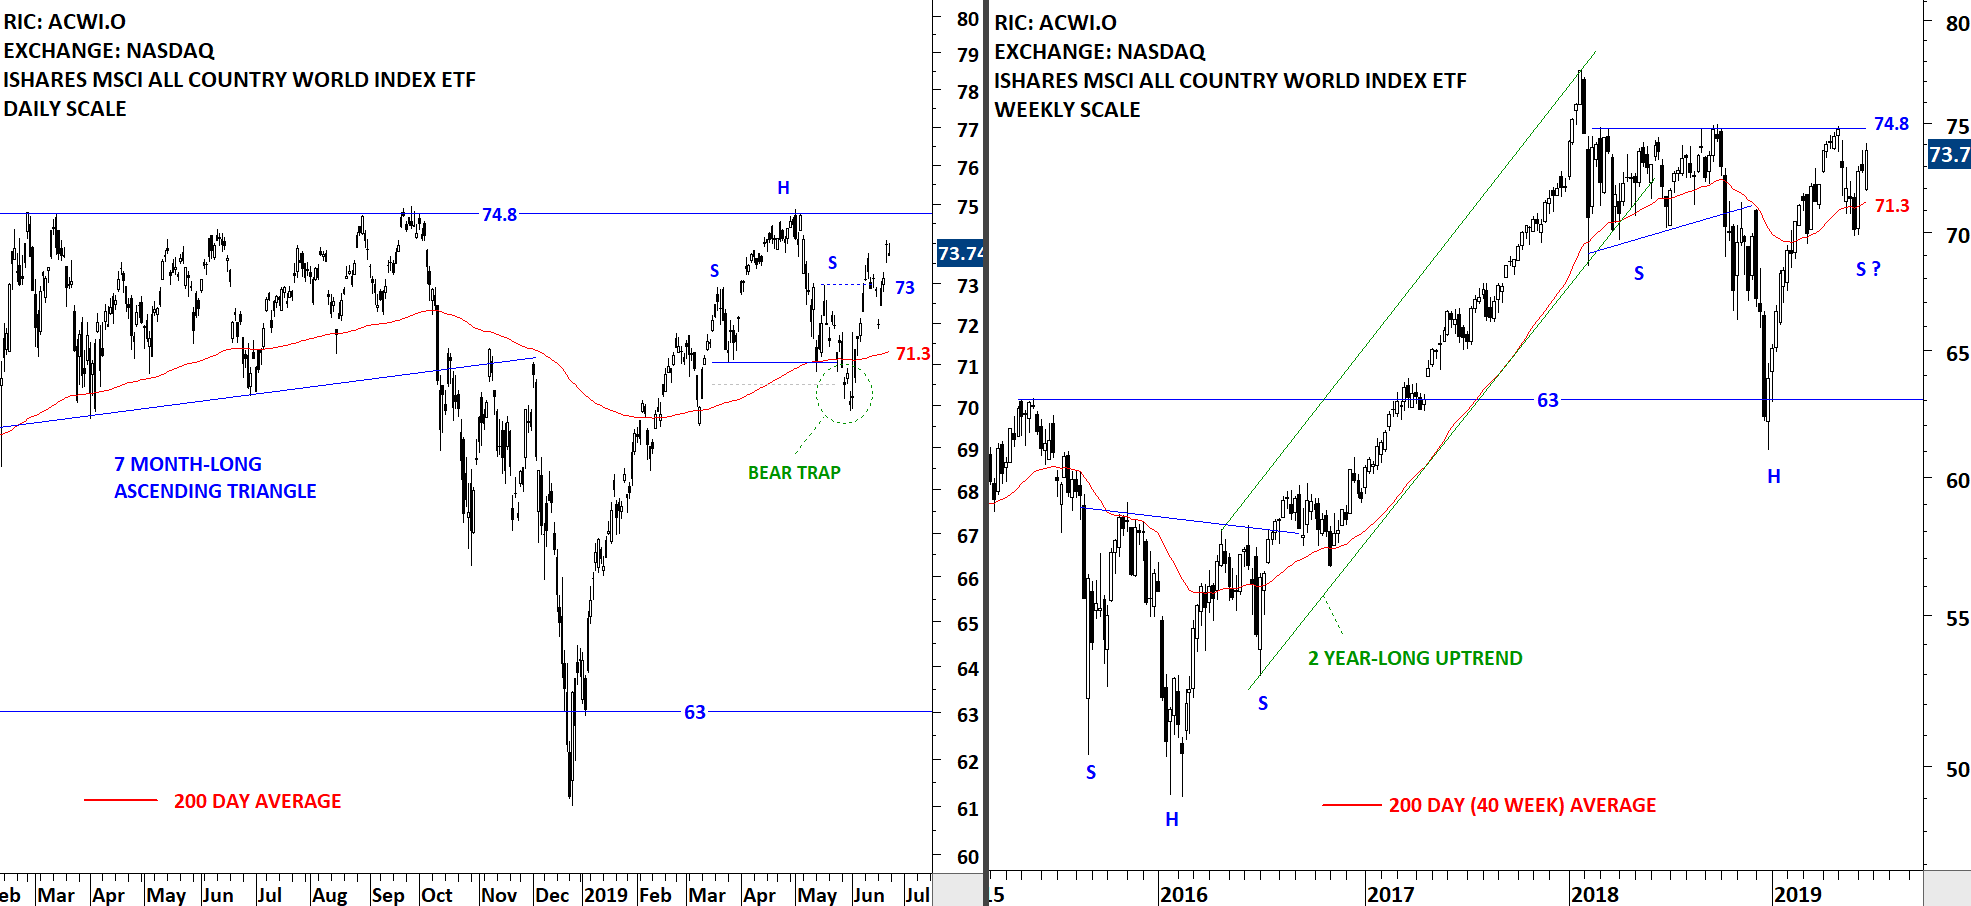
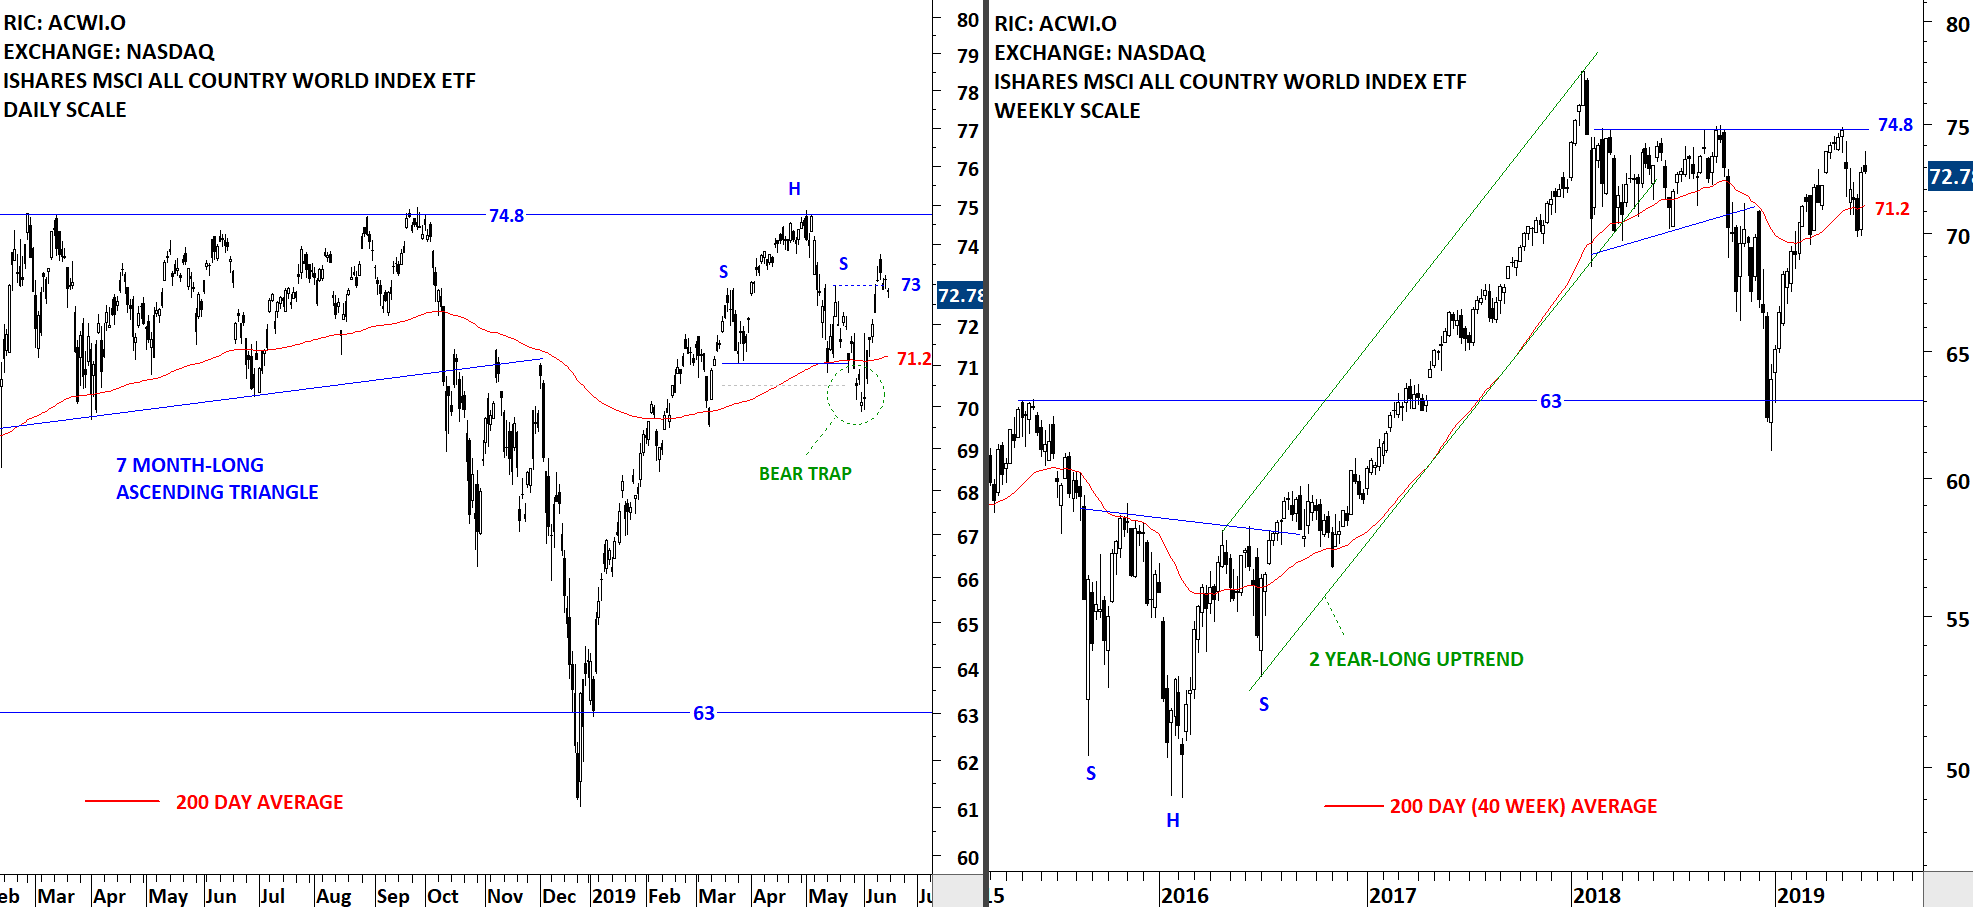
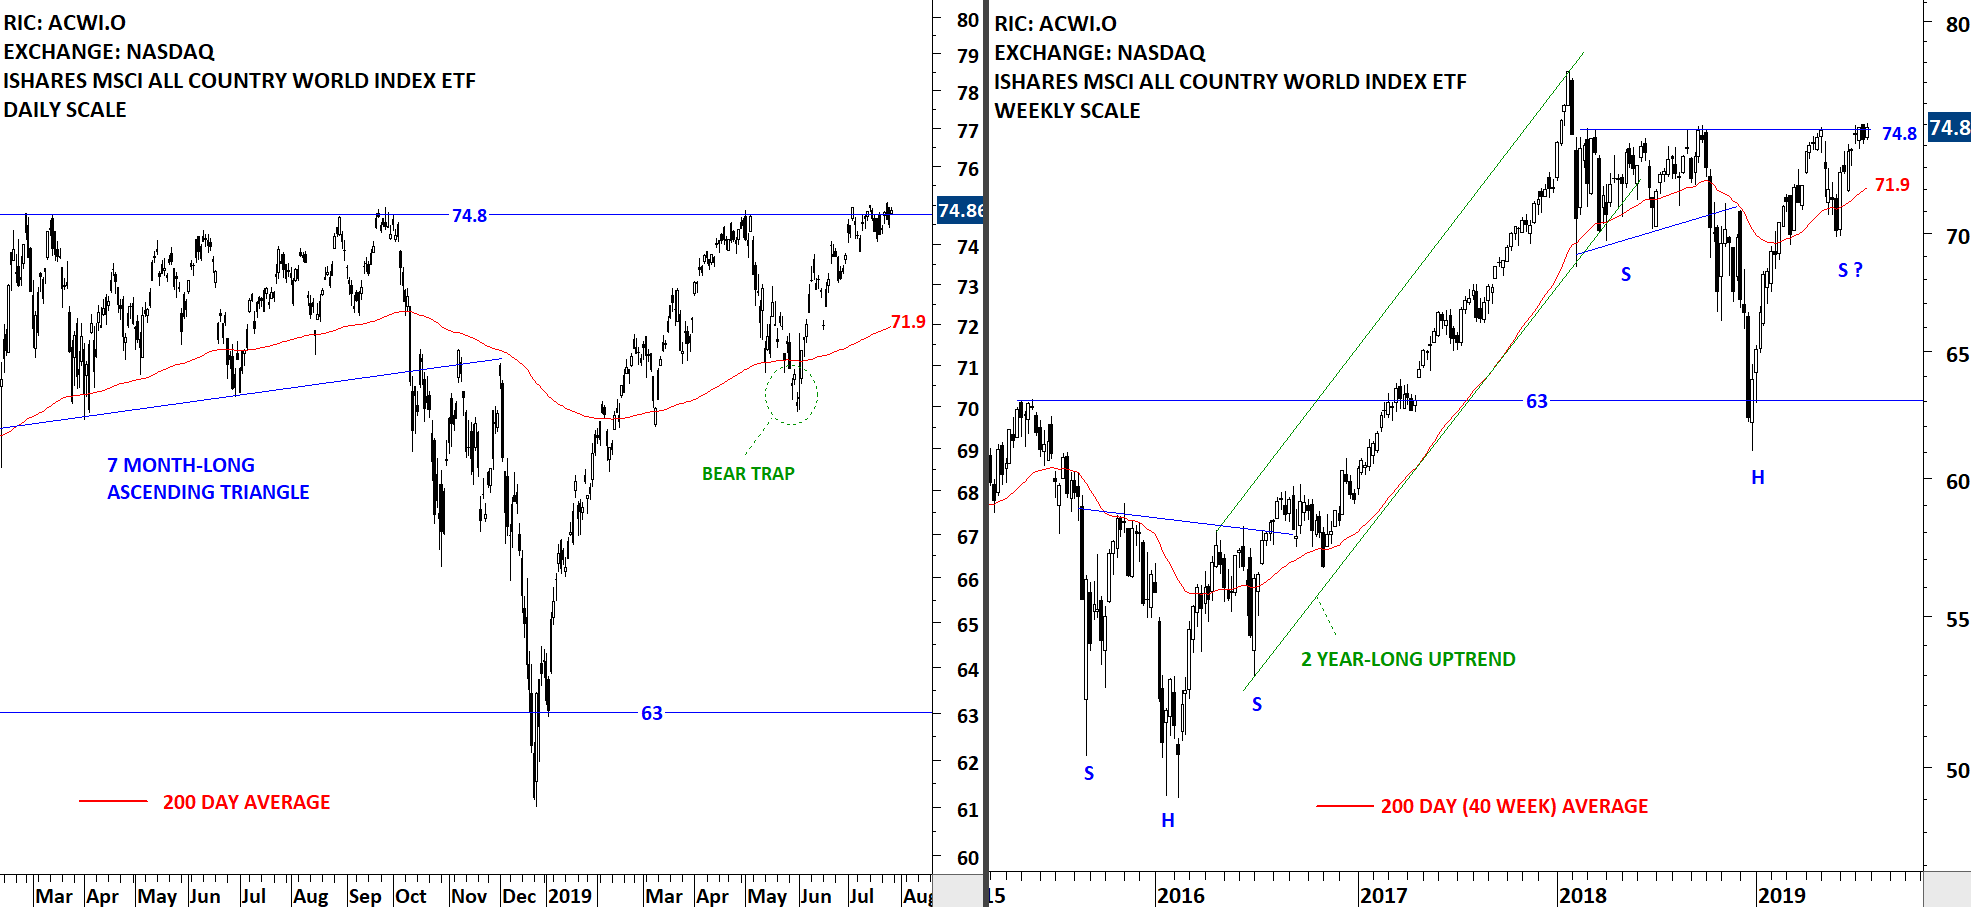
The benchmark for the Global equity markets performance, the iShares MSCI All Country World Index ETF (ACWI.O) continues to challenge the strong horizontal resistance at 74.8 levels. A breakout can be very positive for Global equities. Failure at the strong resistance can result in a pullback towards the long-term average at 71.9 levels.
 Read More