“Demystifying the world of Classical Charting”
– AKSEL KIBAR
Several years ago I came across a website as I was searching for coding a trailing stop-loss on MetaStock. A website called Trader Nexus helped me to better understand what a Chandelier Exit is with several great examples and some sort of a plug in DLL specifically designed for MetaStock formula language. Over the years I made some modifications to the ATR based trailing stop-loss.
Recently I spent couple of long hours on Trading View to understand and formulate the similar ATR based trailing stop by using their formula language, pine script. I think I was able to plot the indicator and I'm sharing it here with out members. I plan to integrate more and more Trading View functionalities to Tech Charts reports and website.
If you are interested in giving the platform a try here is your discounted link (Try Trading View with discount )

I named it ATR Trailing Stop (Long/Short Selectable) because so much more can be done with it by adding different calculations, such as price projections based on the initial risk etc. I will continue to build on this in the following posts. Let's look at the below box for parameters.
Read More
Every week Tech Charts Global Equity Markets report features some of the well-defined, mature classical chart patterns under a lengthy watchlist and the chart pattern breakout signals that took place during that week. Global Equity Markets report covers single stocks from developed, emerging and frontier markets, ETF’s, select commodities, cryptocurrencies and global equity indices. Below chart, BCI ALL COMMODITY STRATEGY ETF is from the review section of the weekly report. It is featuring a possible complex H&S bottom reversal that is ready for breakout after several tests of pattern boundary.
Read MoreSeveral years ago I came across a website as I was searching for coding a trailing stop-loss on MetaStock. A website called Trader Nexus helped me to better understand what a Chandelier Exit is with several great examples and some sort of a plug in DLL specifically designed for MetaStock formula language. Over the years I made some modifications to the ATR based trailing stop-loss.
Recently I spent couple of long hours on Trading View to understand and formulate the similar ATR based trailing stop by using their formula language, pine script. I think I was able to plot the indicator and I'm sharing it here with out members. I plan to integrate more and more Trading View functionalities to Tech Charts reports and website.
If you are interested in giving the platform a try here is your discounted link (Try Trading View with an initial discount)
I named it Simplified ATR Trailing Stop because so much more can be done with it by adding different calculations, such as price projections based on the initial risk etc. I will continue to build on this in the following posts. Let's look at the below box for parameters.
Read More
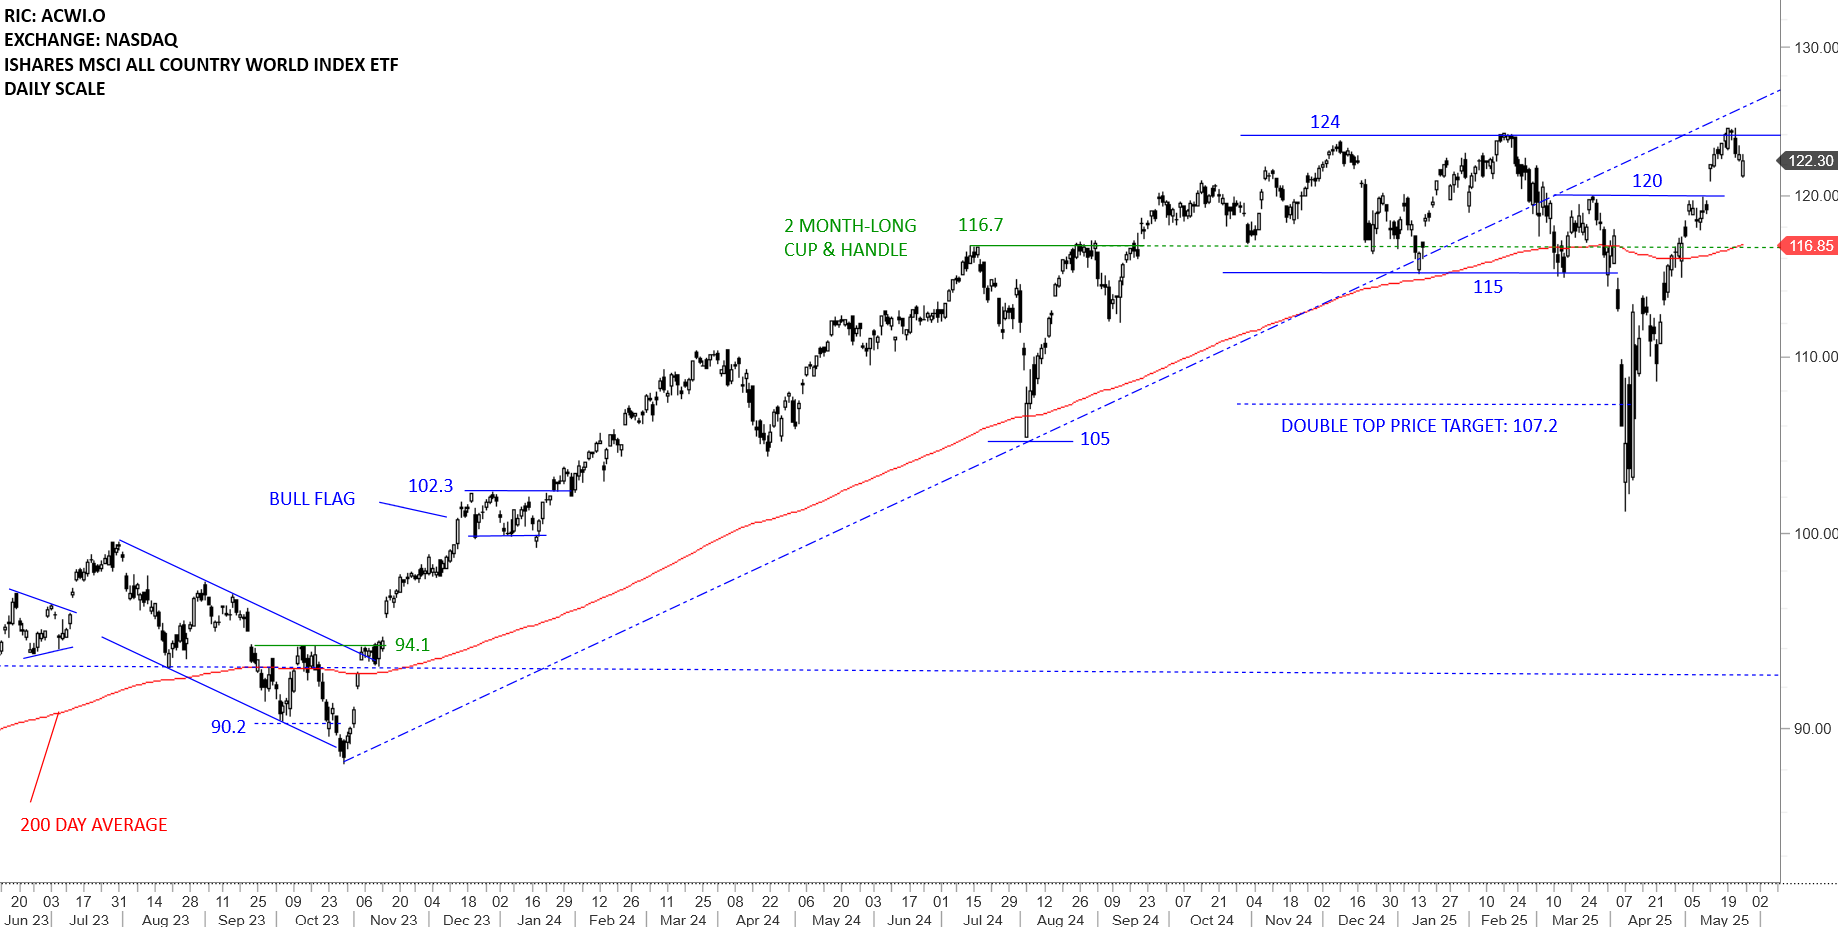
The benchmark for the Global equity markets performance, the iShares MSCI All Country World Index ETF (ACWI.O) did a round trip after the sharp sell-off and reached its all-time highs around 124 levels. The fact that the ETF cleared its 200-day average and moved significantly above it can be analyzed long-term positive as pullbacks and consolidations are likely to find support above the 200-day. I will monitor the ETF to see if it will stabilize above the long-term average in preparation of resuming higher. This can be the short breather after the ETF had a strong rebound. The breather if it forms a higher low above the long-term average in the form of a tight consolidation will increase the conviction on bullish setup, a possible H&S pattern with the neckline at 124 levels. 116.85-120 area will act as support during pullback. Outlook is positive for Global Equities.
 Read More
Every week Tech Charts Global Equity Markets report features some of the well-defined, mature classical chart patterns under a lengthy watchlist and the chart pattern breakout signals that took place during that week. Global Equity Markets report covers single stocks from developed, emerging and frontier markets, ETF’s, select commodities, cryptocurrencies and global equity indices. Below chart, GATX CORP is from the watchlist section of the weekly report. It is featuring a possible H&S continuation that is ready for breakout after several tests of pattern boundary.
Read More
Every week Tech Charts Global Equity Markets report features some of the well-defined, mature classical chart patterns under a lengthy watchlist and the chart pattern breakout signals that took place during that week. Global Equity Markets report covers single stocks from developed, emerging and frontier markets, ETF’s, select commodities, cryptocurrencies and global equity indices. Below chart, Nikkei 225 Index futures is from the review section of the weekly report. It is featuring a possible ascending triangle continuation that is ready for breakout after several tests of pattern boundary.
Read More
Every week Tech Charts Global Equity Markets report features some of the well-defined, mature classical chart patterns under a lengthy watchlist and the chart pattern breakout signals that took place during that week. Global Equity Markets report covers single stocks from developed, emerging and frontier markets, ETF’s, select commodities, cryptocurrencies and global equity indices. Below chart, France CAC40 Index is from the review section of the weekly report. It is featuring a possible double bottom (rectangle) reversal that is ready for breakout after several tests of pattern boundary.
Read More
Every week Tech Charts Global Equity Markets report features some of the well-defined, mature classical chart patterns under a lengthy watchlist and the chart pattern breakout signals that took place during that week. Global Equity Markets report covers single stocks from developed, emerging and frontier markets, ETF’s, select commodities, cryptocurrencies and global equity indices. Below chart, Italy FTSE MIBTEL Index is from the review section of the weekly report. It is featuring a possible H&S continuation setup that is ready for breakout after several tests of pattern boundary.
Read More
Every week Tech Charts Global Equity Markets report features some of the well-defined, mature classical chart patterns under a lengthy watchlist and the chart pattern breakout signals that took place during that week. Global Equity Markets report covers single stocks from developed, emerging and frontier markets, ETF’s, select commodities, cryptocurrencies and global equity indices. Below chart, Russell 2000 Index is from the review section of the weekly report. It is featuring a possible ascending triangle setup that is completing after several tests of pattern boundary.
Read More
Every week Tech Charts Global Equity Markets report features some of the well-defined, mature classical chart patterns under a lengthy watchlist and the chart pattern breakout signals that took place during that week. Global Equity Markets report covers single stocks from developed, emerging and frontier markets, ETF’s, select commodities, cryptocurrencies and global equity indices. Below chart, Boyd Gaming Corporation is from the watchlist section of the weekly report. It is featuring a possible rectangle setup that can breakout to all-time highs.
Read More
