GLOBAL EQUITY MARKETS – April 29, 2017
The first round of the 2017 French presidential election was held on 23 April 2017. As no candidate won a majority, a run-off election between the top two candidates, Emmanuel Macron of En Marche! and Marine Le Pen of the National Front (FN), will be held on 7 May 2017. Global equity markets reacted positively after centrist candidate Emmanuel Macron won the first round of the weekend’s French presidential election. European equities have been performing poorly since the beginning of the global financial crash in 2008. Any positive political and economic development is likely to help European equities to catch up in the relative performance. Though, European equities might need more catalyst than an election result to reverse long-term relationships.
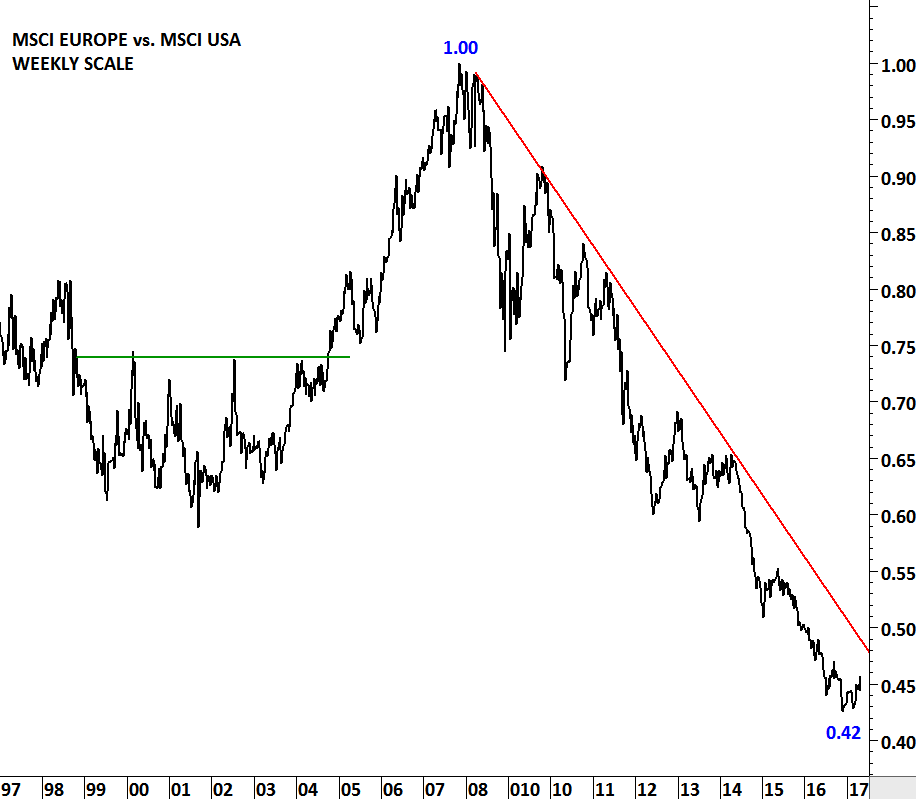
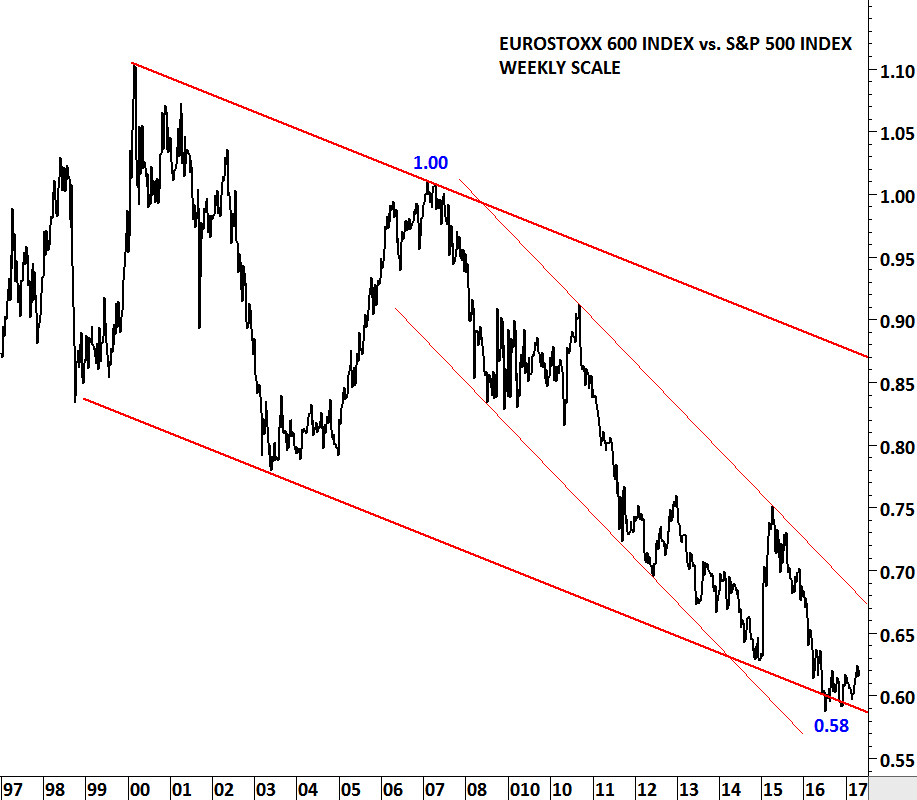
Two charts below show the massive under performance of the European equities vs. the U.S. equities over the past 9 years. Both the relative performance ratio between MSCI EUROPE vs. MSCI U.S. and EUROSTOXX 600 Index vs. S&P 500 Index shows a multi-year downtrend. This long-term relationship is something that we should keep a close eye on, as any major turnaround in European indices performance will result in more breakout opportunities in the European equities.
Relative performance ratio between the two indices is converted into an index to better visualize the change in value in percentage terms. 1.00 is an index value of 100. 0.42 is an index value of 42. The chart shows the index losing more than half of its value from the highest level in 2008. In other words MSCI EUROPE underperformed MSCI USA by 58% over the past 9 years. Data used for MSCI EUROPE and MSCI USA are price index in U.S. Dollar.
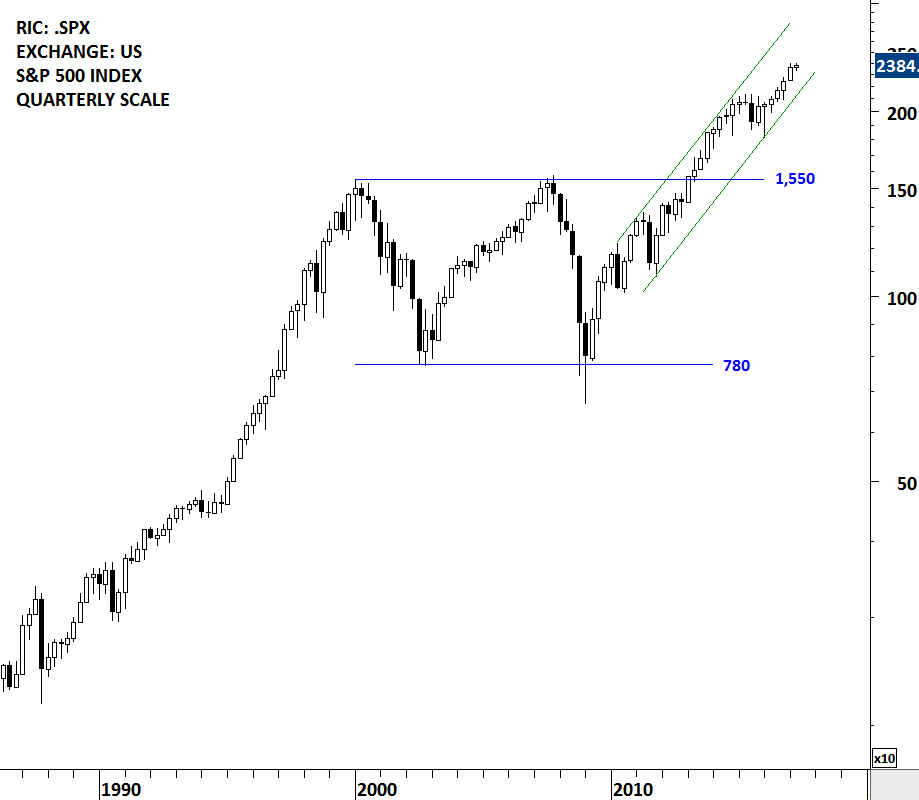
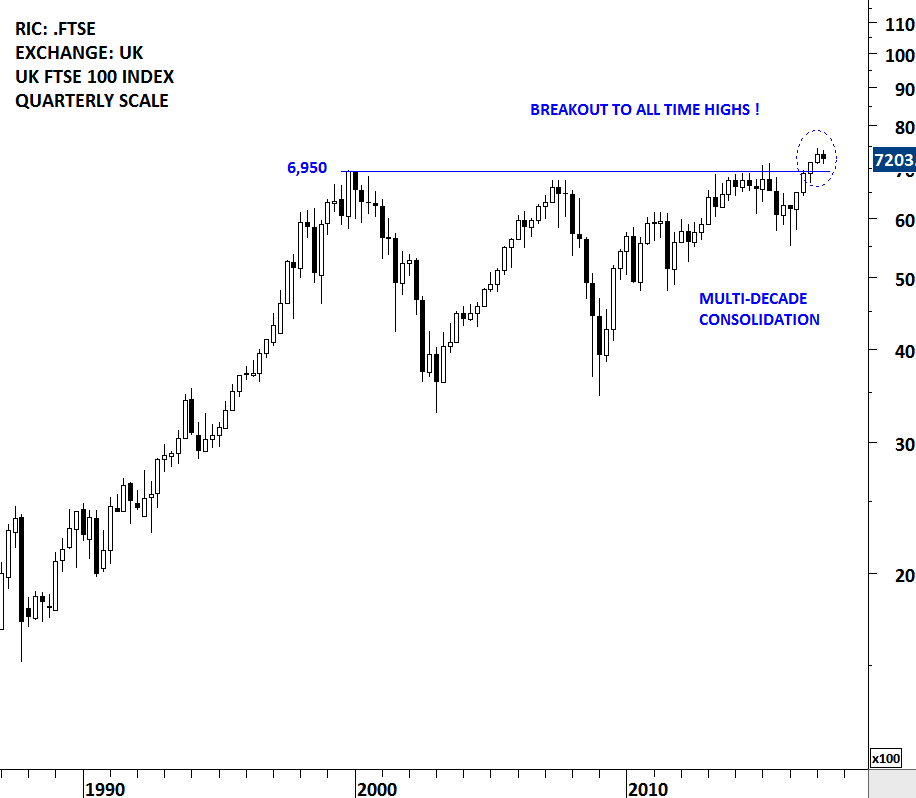
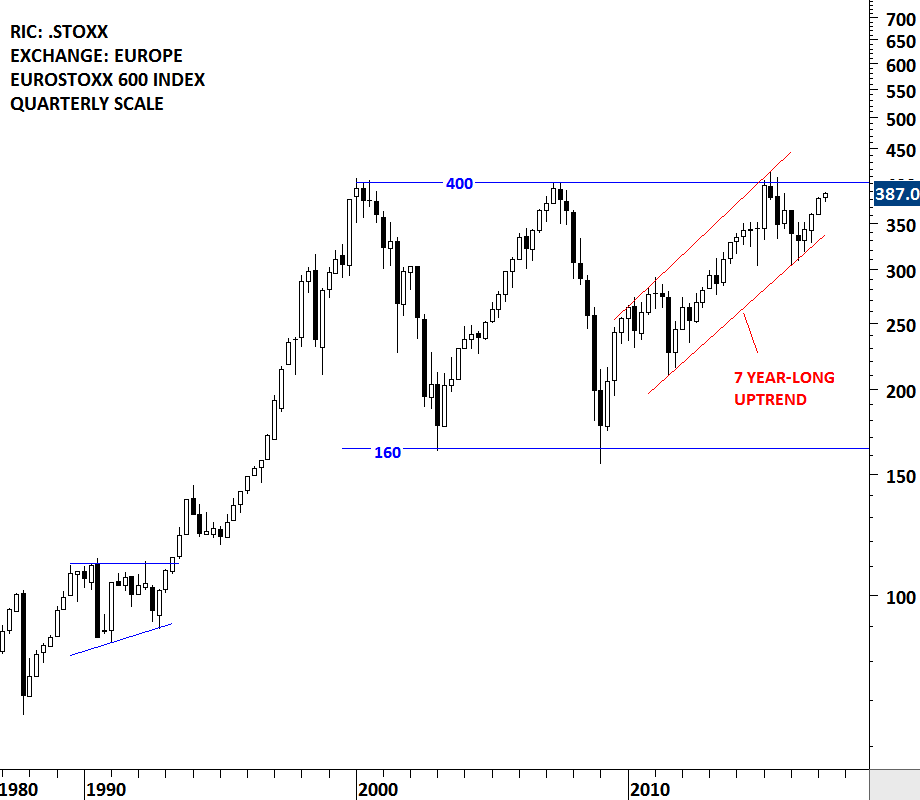
While the S&P 500 index cleared its decade-long resistance in mid-2013 and reached all-time high levels, the UK FTSE 100 index recently breached its strong multi-month long horizontal resistance at 6,950 levels. Breakout to all-time high levels is clearly a bullish signal. The biggest challenge for the European equities as shown here by the EUROSTOXX 600 Index is the 400 levels; a 17 year-long horizontal resistance. The benchmark equity index is now close to testing it for the 4th time. The UK FTSE 100 index should hold above 6,950 levels and the EUROSTOXX 600 Index should eventually breakout above 400 levels for continued long-term strength in the European equities.
Strong Global equity markets performance resulted in 8 new chart pattern breakout signals during the week.
#TECHCHARTSALERT
THALES SA (TCFP.PA)
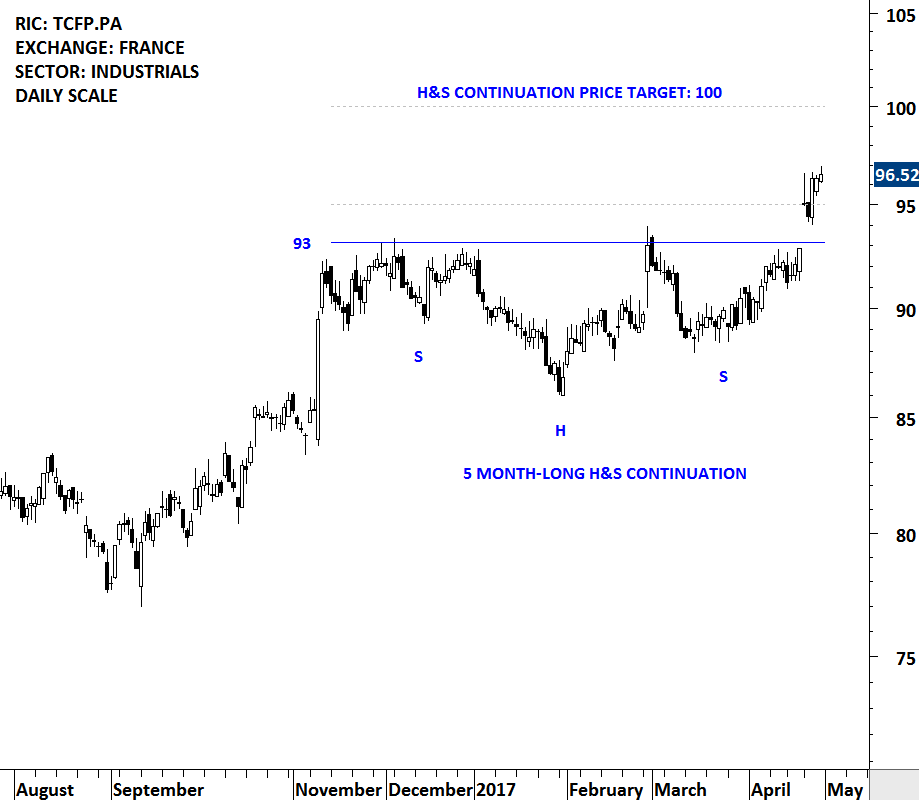
Thales SA is a France-based provider of secure solutions across five markets, such as aeronautics, space, ground transportation, defense and security. It integrates technologies, systems, software, services and equipment. It develops and builds end-to-end solutions. The stock is listed on the Paris Stock Exchange. Price chart formed a 5 month-long H&S continuation chart pattern with the strong horizontal resistance standing at 93 levels. 5 month-long horizontal resistance was tested for four times. The daily close above 95 levels confirmed the breakout from the bullish continuation chart pattern with a possible price target of 100 levels. With the strong breakout and gap opening above horizontal resistance, Thales reached new all-time high levels.
THOMAS COOK GROUP (TCG.L)
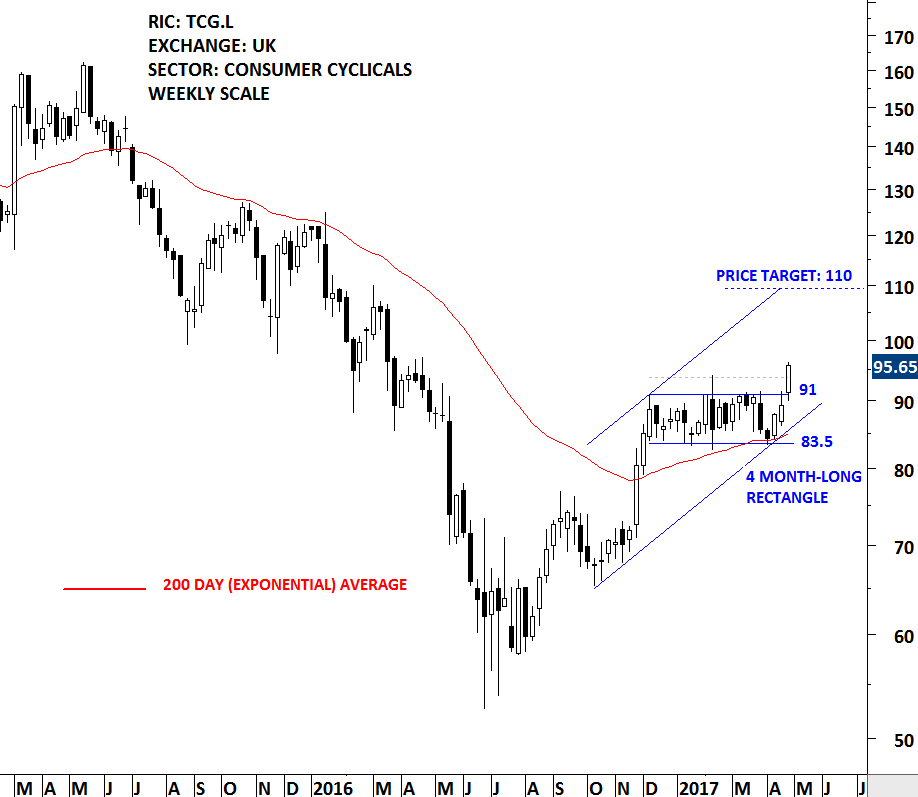
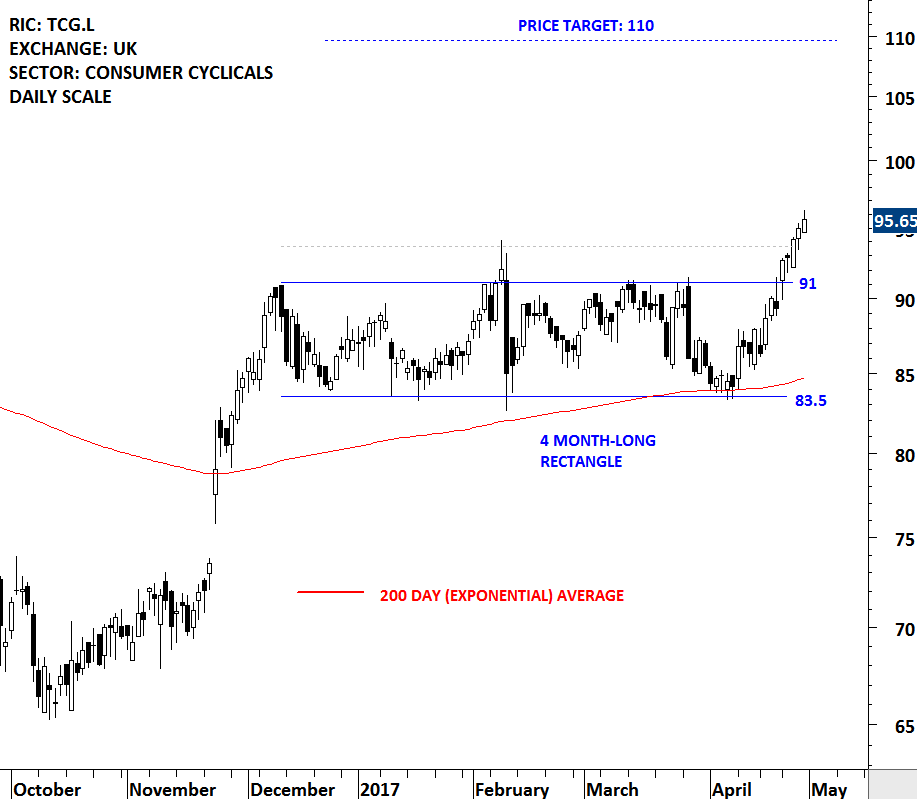
Thomas Cook Group plc is a holiday company. The Company’s segments are United Kingdom, Continental Europe, Northern Europe and Airlines Germany. Its hotels and resort brands include Sentido, Sunprime, Sunwing, Sunconnect, Smartline and Casa Cook. It has airline operations in Belgium, Scandinavia and the United Kingdom. It has a fleet of over 90 aircraft under the Thomas Cook Airlines and Condor brands. It operates from approximately 20 source markets in Europe and China. The stock is listed on the London Stock Exchange. Price chart formed a 4 month-long rectangle. The U.K. listed stock was featured in the April 8, 2017 Global Equity Markets Report when price tested the lower boundary of the 4 month-long sideways consolidation for the 5th time. The lower boundary at 83.50 was also the level for the 200 day average, a widely followed trend indicator. Since then, Thomas Cook Group had a strong rebound. This week with the daily close above 93.70 levels the stock confirmed the breakout from the 4 month-long rectangle with a possible price target of 110 levels.
RYANAIR HOLDINGS PLC (RYA.L)
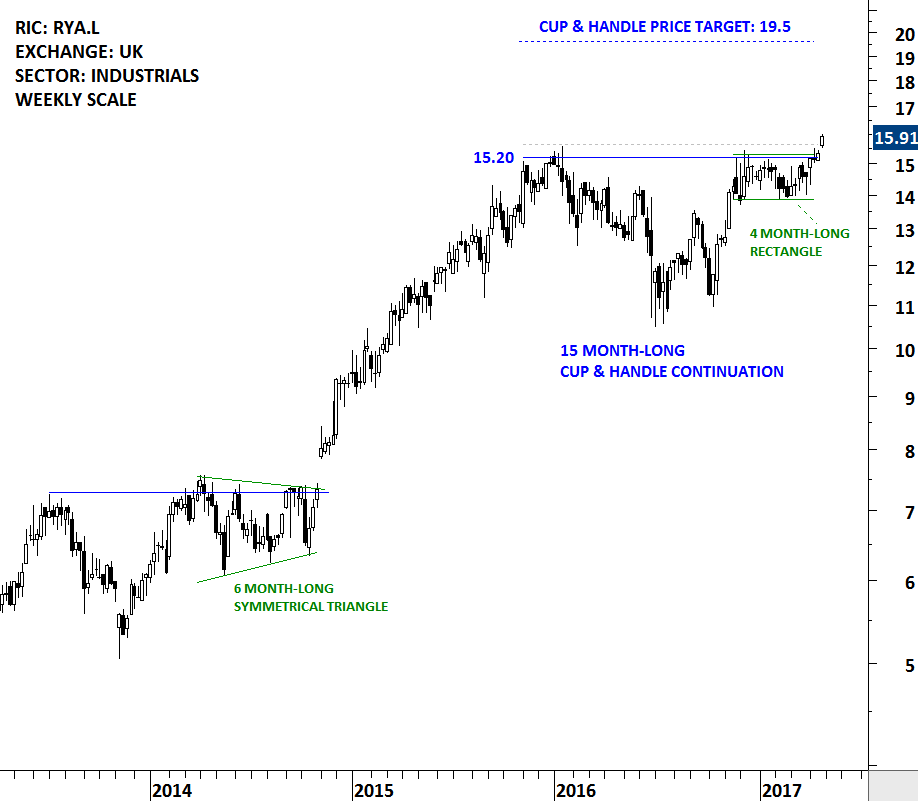
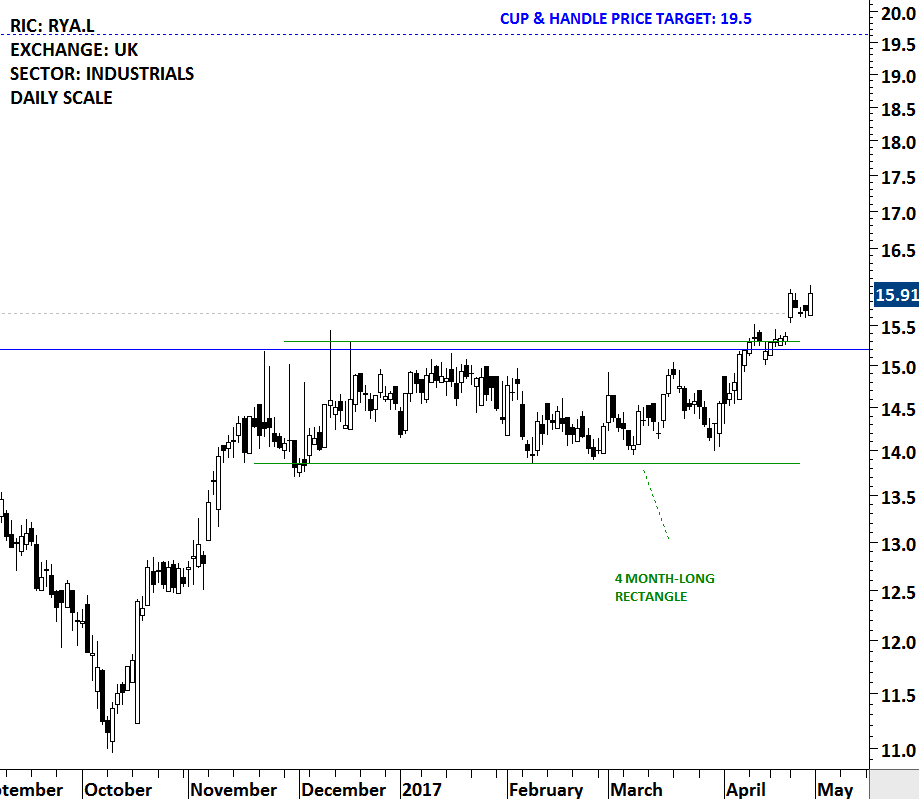
Ryanair Holdings plc (Ryanair Holdings) is a holding company for Ryanair Limited (Ryanair). Ryanair operates an ultra-low fare, scheduled-passenger airline serving short-haul, point-to-point routes between Ireland, the United Kingdom, Continental Europe, Morocco and Israel. The stock is listed on the London Stock Exchange. Price chart formed a 15 month-long cup & handle chart pattern with the strong horizontal resistance standing at 15.20 levels. The handle part of the chart pattern is also a 4 month-long rectangle. Both the rectangle and and the long-term cup & handle chart pattern has bullish implications. The daily close above 15.65 levels confirmed the breakout from both the cup & handle chart pattern and the 4 month-long rectangle with a possible price target of 19.5 levels.
GLOBAL X MSCI GREECE ETF (GREK.K)
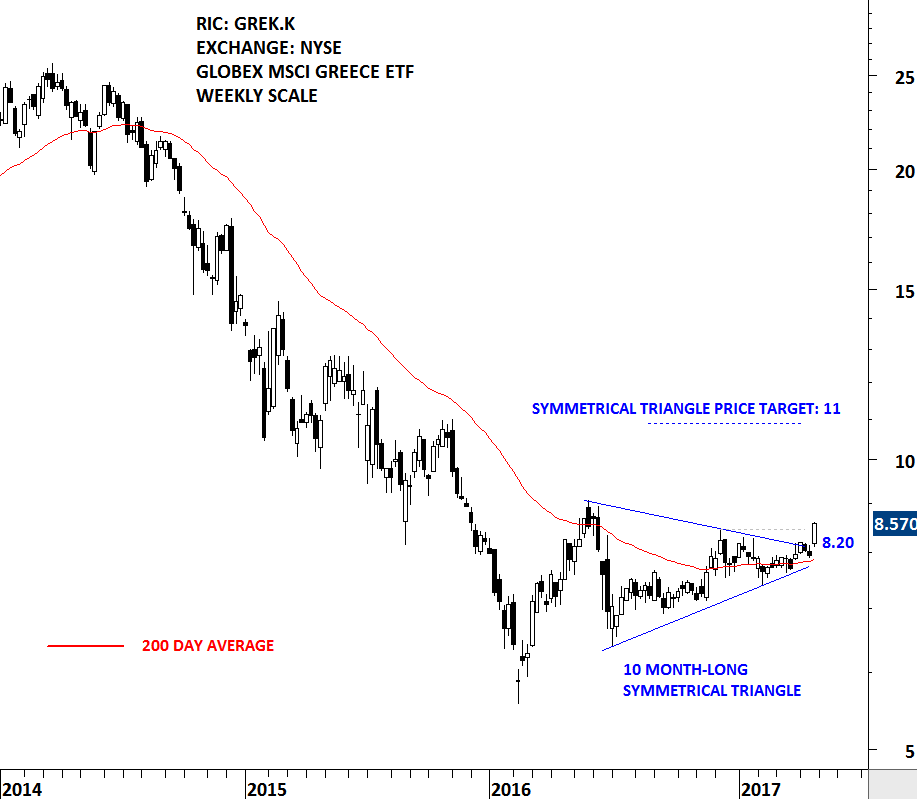
GREK is one of the liquid Greek equity ETF that is listed on the New York Stock Exchange. The Fund seeks to investment results that correspond generally to the price and yield performance of the FTSE/Athex 20 Index. The Index is designed to reflect broad based equity market performance in Greece. The Fund invest at least 80% of its total assets in securities on companies that are domiciled in Greece. Globex MSCI Greece ETF (GREK) formed a 10 month-long symmetrical triangle. After long downtrends, symmetrical triangles can act as bottom reversals. The daily close above 8.45 levels confirmed the breakout from the sideways consolidation with a possible price target of 11 levels. It is important to note that price is settling above the 200 day average, an indication of a uptrend.
BELC CO LTD. (9974.T)
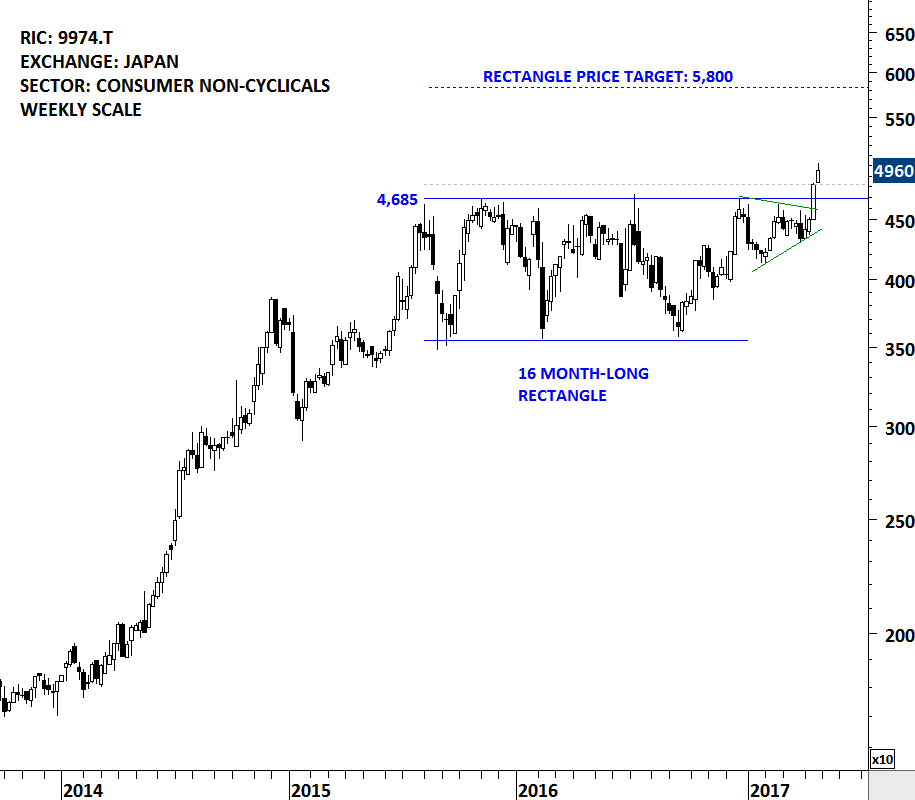
Belc CO., LTD. is a Japan-based company mainly engaged in the operation of a chain of retail stores in the Tokyo metropolitan area, with a focus on Saitama Prefecture. Its retail stores provide fresh foods, prepared foods, daily necessities and other products. The stock is listed on the Tokyo Stock Exchange. Price chart formed a 16 month-long rectangle with the strong horizontal boundary standing at 4,685 levels. Edwards and Magee in their book Technical Analysis of Stock Trends suggest that a stock should breakout or breakdown by a min 3% margin above or below the resistance/support (on a daily closing basis) for a clear chart pattern breakout signal. The daily close above 4,825 levels confirmed the breakout from the multi-month consolidation with a possible price target of 5,800 levels.
QUINTILES IMS HOLDINGS (Q)
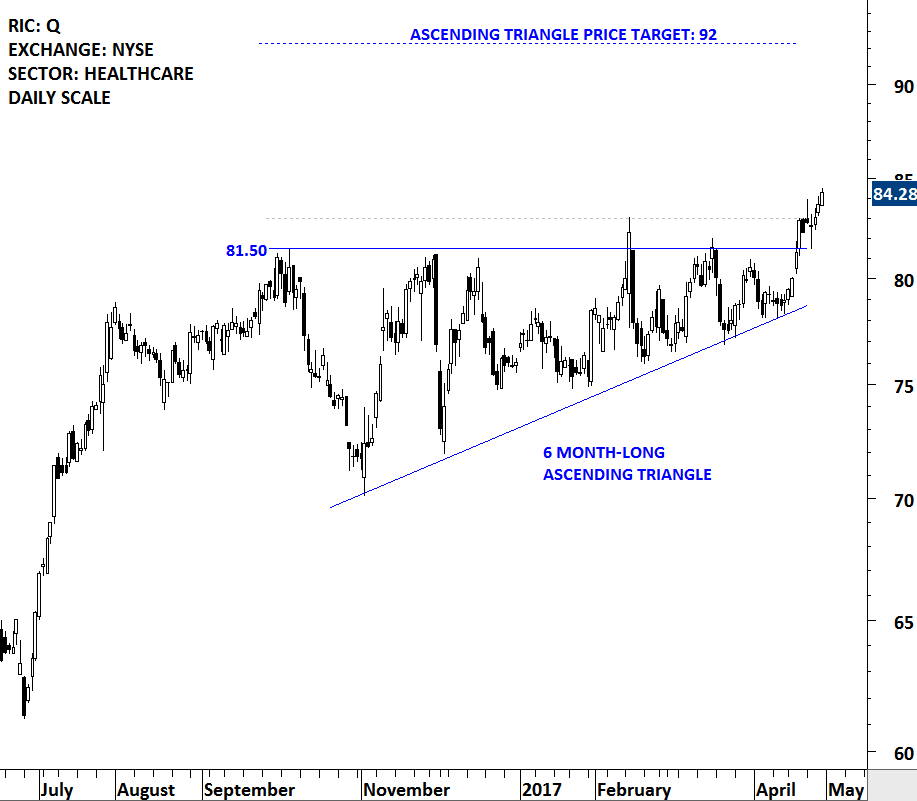
Quintiles IMS Holdings, Inc., formerly Quintiles Transnational Holdings Inc., provides integrated information and technology-enabled healthcare services. The Company operates through segments, including Commercial Solutions; Research & Development Solutions, and Integrated Engagement Services. The stock is listed on the New York Stock Exchange. Price chart formed a 6 month-long ascending triangle with the strong horizontal boundary standing at 81.50 levels. The daily close above 83 levels confirmed the breakout from the bullish continuation chart pattern with a possible price target of 92 levels.
HEALTH SOUTH CORP (HLS)
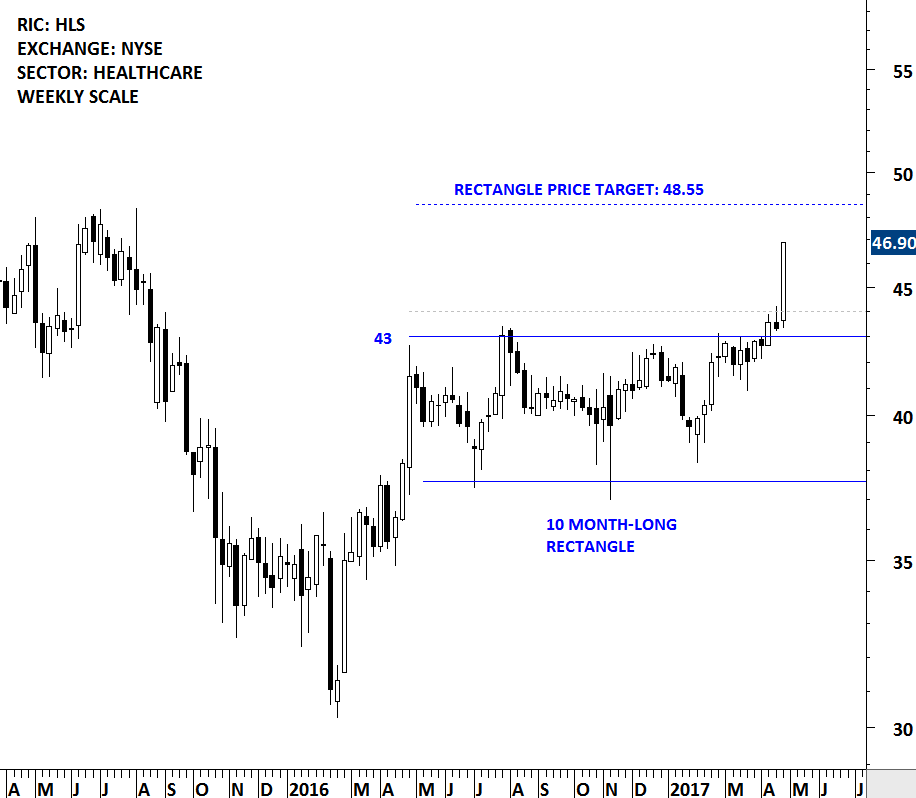
Health South Corporation is a provider of post acute healthcare services, offering both facility based and home-based post acute services in over 30 states and Puerto Rico through its network of inpatient rehabilitation hospitals, home health agencies and hospice agencies. The stock is listed on the New York Stock Exchange. Price chart formed a 10 month-long rectangle with the strong horizontal boundary standing at 43 levels. Rectangles are usually continuation chart patterns and breakouts from these horizontal chart patterns are usually reliable. The daily close above 44 levels confirmed the breakout with a possible price target of 48.55 levels.
ENERSYS (ENS)
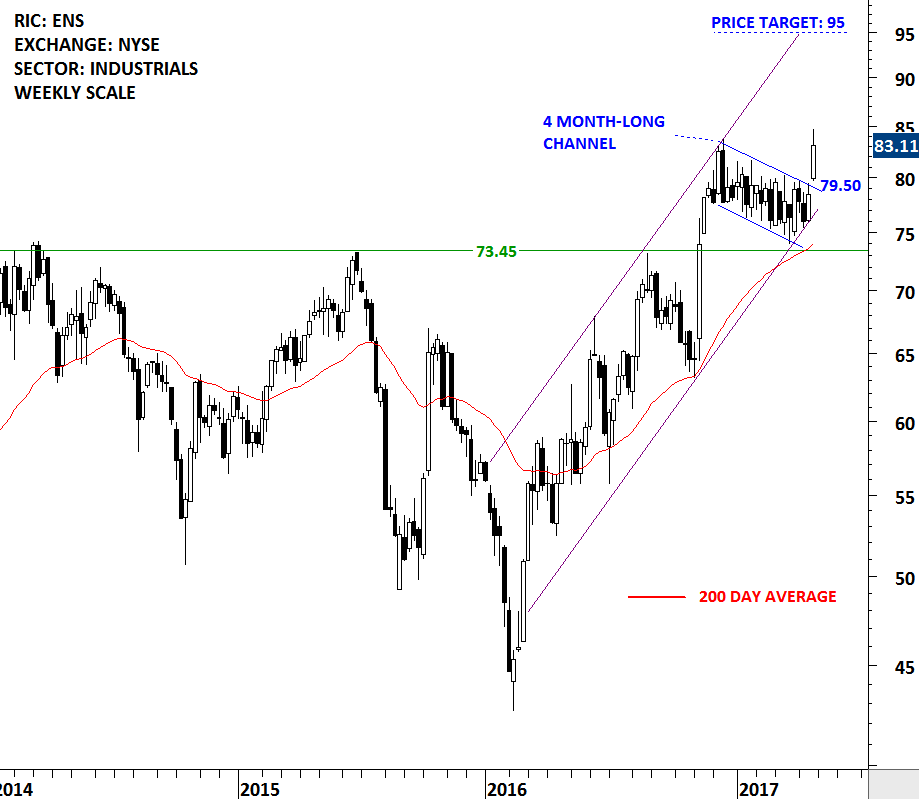
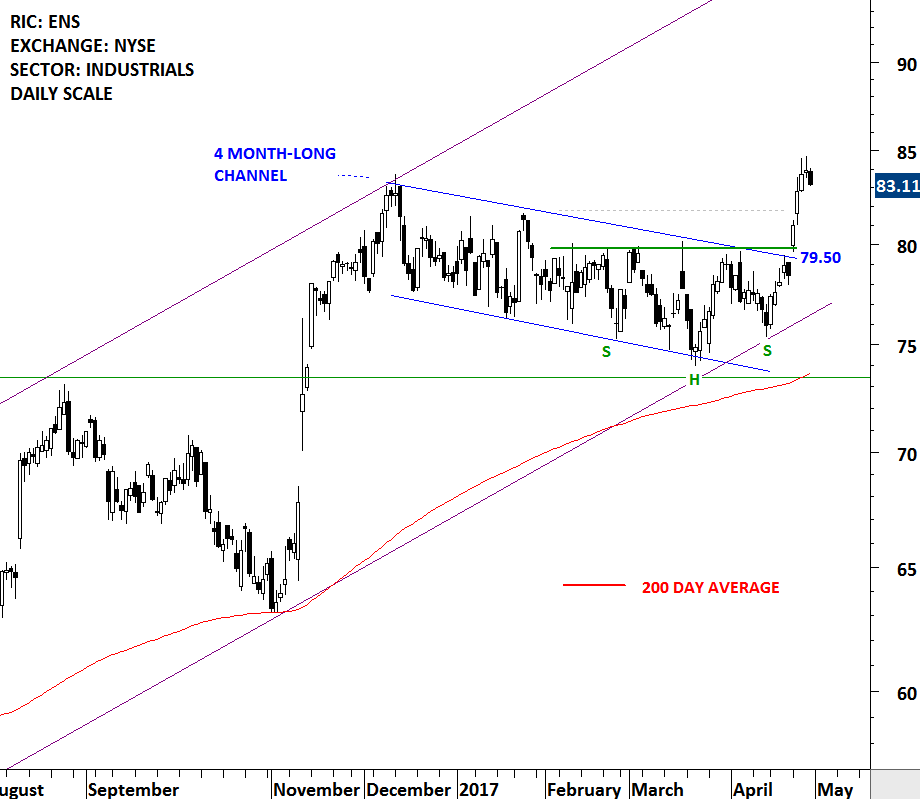
ENERSYS is a manufacturer, marketer and distributor of industrial batteries. The Company manufactures, markets and distributes related products, such as chargers, power equipment, outdoor cabinet enclosures and battery accessories, and provides related after-market and customer-support services for industrial batteries. The stock is listed on the New York Stock Exchange. Price chart formed a 4 month-long downward trend channel that acted as a pullback to the long-term support at 73.45 levels. Over the past three months, ENERSYS also formed a short-term H&S reversal with the neckline standing at 79.50. Breakouts are usually strong when a stock clears several strong technical resistance at once. In this case with the daily close above 81.80 levels ENERSYS broke out of the 4 month-long trend channel and also completed the H&S reversal chart pattern.
This week there are 10 additions to the watch list.
#TECHCHARTSWATCHLIST
IRESS LTD (IRE.AX)
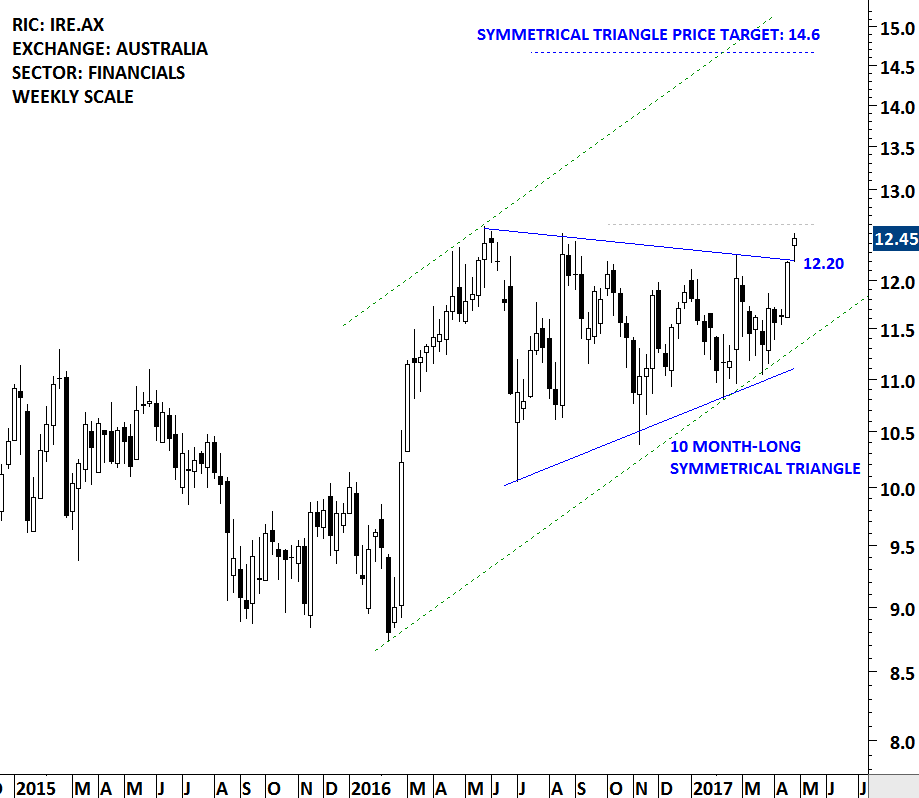
IRESS Limited is engaged in providing information, trading, compliance, order management, portfolio and wealth management, and related tools. The stock is listed on the Australia Stock Exchange. Price chart formed a 10 month-long symmetrical triangle. Symmetrical triangle can act as a continuation chart pattern in an overall uptrend. Given the upward trend prior to the symmetrical triangle, a breakout higher will confirm the multi-month consolidation as a continuation chart pattern with a possible price target of 14.6 levels. A daily close above 12.60 levels will confirm the breakout.
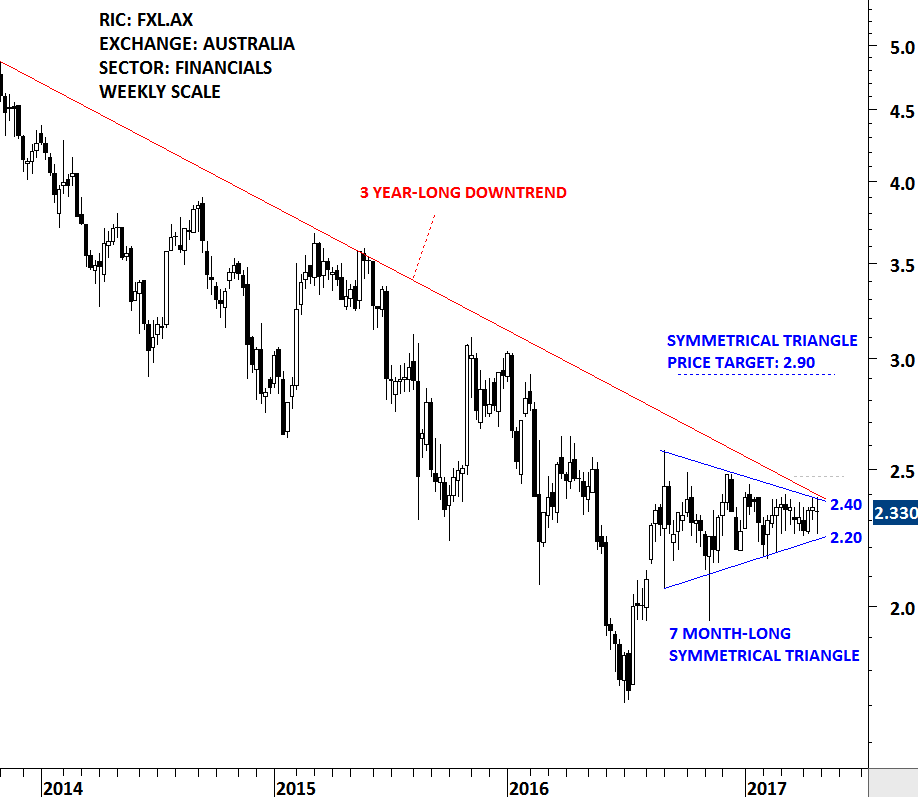
FLEXIGROUP LTD (FXL.AX)
FlexiGroup Limited is engaged in the provision of lease and rental financing services; no interest ever loans, and interest free cards. The Company is a diversified financial services company providing vendor finance programs, interest free and Visa/Mastercards, managed print services, lay-by and other payment solutions to consumers and businesses. The stock is listed on the Australia Stock Exchange. Price chart formed a 7 month-long symmetrical triangle. The upper boundary of the contracting range is at 2.40 levels. Chart pattern boundary overlaps with the 3 year-long downward trend line. A breakout from the symmetrical triangle can reverse the multi-year downtrend. A daily close above 2.47 will confirm the breakout with a possible chart pattern price target of 2.90 levels.
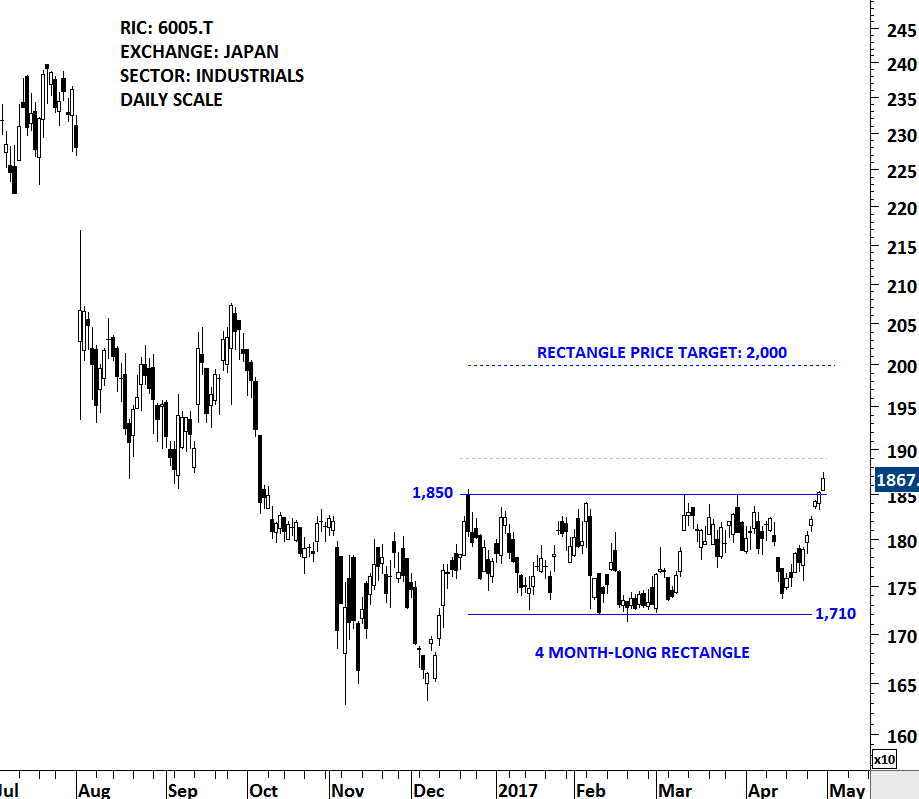
MIURA CO LTD. (6005.T)
MIURA CO., LTD. is a Japan-based company engaged in the manufacturing of boilers. The stock is listed on the Tokyo Stock Exchange. Price chart formed a 4 month-long rectangle with the strong horizontal boundary standing at 1,850 levels. The rectangle can act as a reversal chart pattern. Friday’s close was slightly above the upper boundary of the multi-month consolidation. A daily close above 1,890 will confirm the breakout with a possible price target of 2,000 levels.
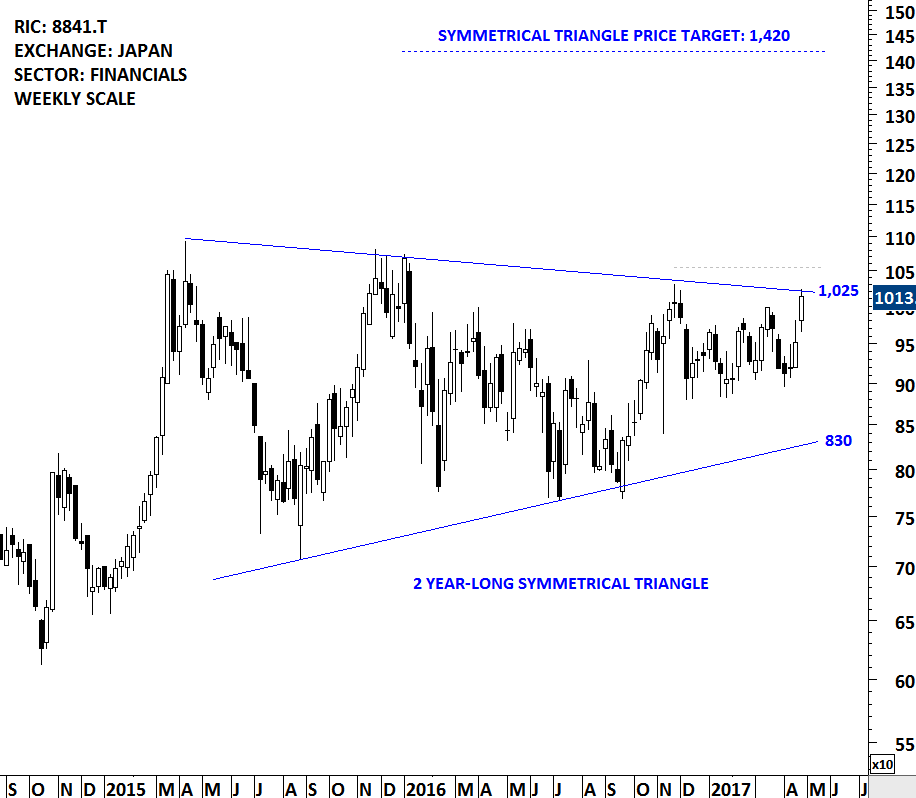
TOC CO LTD. (8841.T)
TOC Co., Ltd. is a Japan-based real estate company engaged in three business segments. The stock is listed on the Tokyo Stock Exchange. Price chart formed a 2 year-long symmetrical triangle. Breakouts from lengthy consolidation periods are usually positive in the long-term. Several tests of the upper boundary suggests that the 2 year-long trend line is an important level for TOC Co. A daily close above 1,055 levels will confirm the breakout from the multi-year consolidation with a possible price target of 1,420 levels.
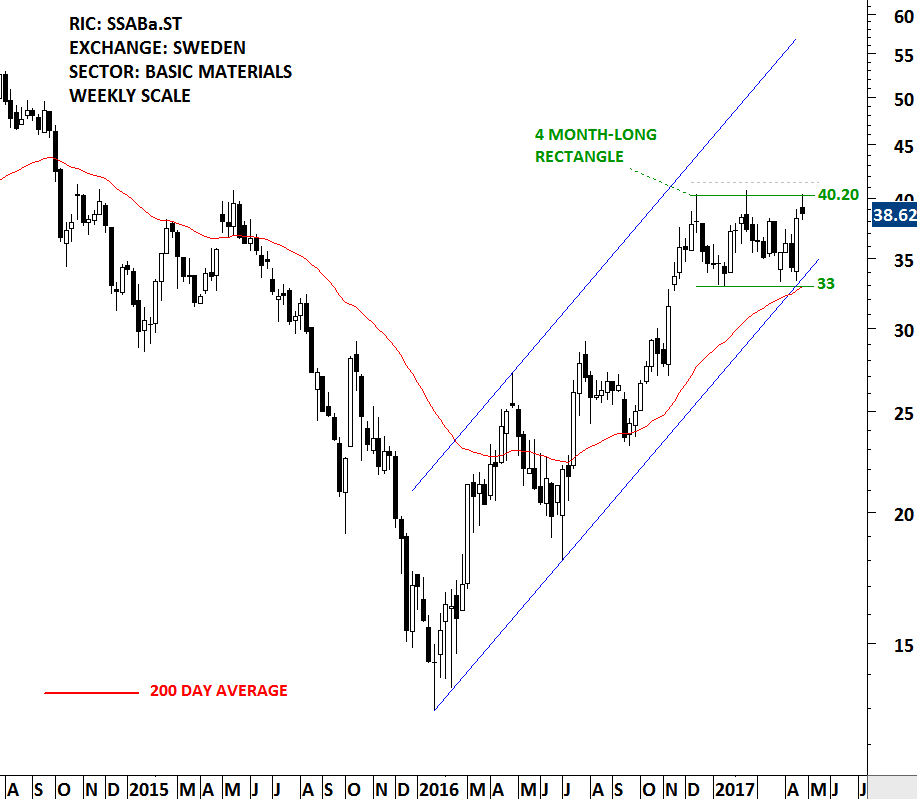
SSAB AB (SSABa.ST)
SSAB AB is a Sweden-based company active within the steel industry. The Company is engaged in the development, manufacture and marketing of high strength steel products and solutions. The stock is listed on the Stockholm Stock Exchange. Price chart formed a 4 month-long rectangle chart pattern that can act as a continuation. Over the past year stock has been in a steady uptrend above the long-term trend line and also the 200 day average. Breakout from the 4 month-long rectangle can add momentum to the ongoing uptrend. A daily close above 41.40 will confirm the breakout from the horizontal chart pattern.
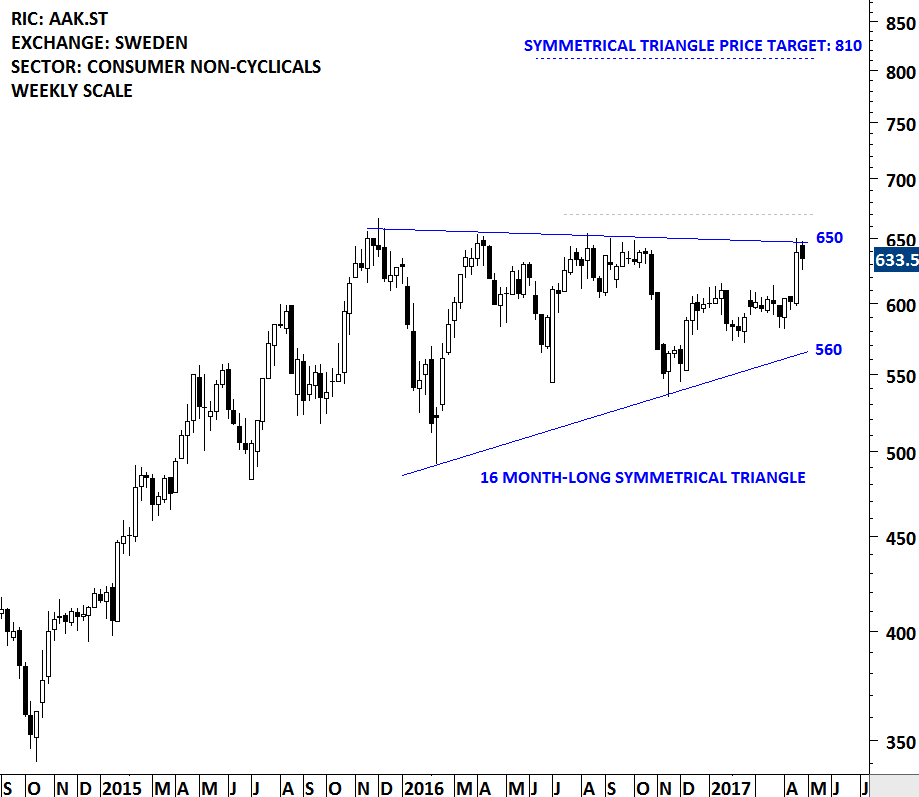
AAK AB (AAK.ST)
AAK publ AB, also known as AarhusKarlshamn publ AB, is a Sweden-based holding company active primarily in the food processing sector. The Company refines vegetable oils for specialized products. The stock is listed on the Stockholm Stock Exchange. Price chart formed a 16 month-long symmetrical triangle with the upper boundary standing at 650 levels. The upper boundary of the triangle has been tested several times over the past year. A daily close above 670 levels will confirm the breakout from the multi-month consolidation pattern with the possible price target of 810 levels. Breakouts from lengthy consolidation periods can be positive in the long-term.
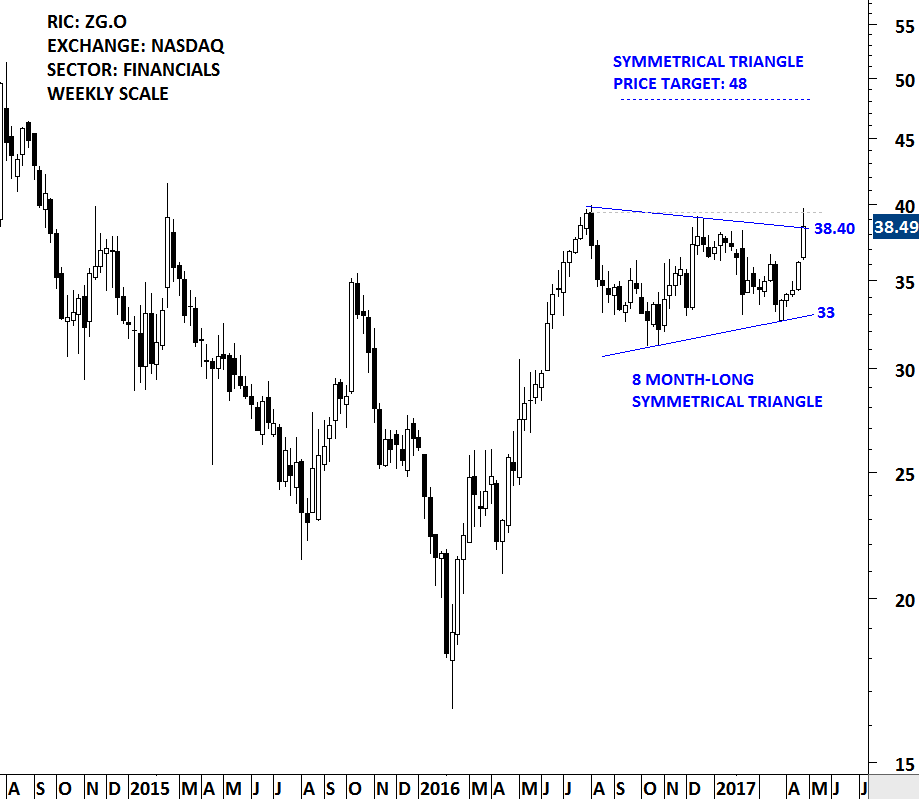
ZILLOW GROUP (ZG.O)
Zillow Group, Inc. operates real estate and home-related information marketplaces on mobile and the Web, with a portfolio of brands and products to enable people find vital information about homes and connect with local professionals. The stock is listed on the Nasdaq Stock Exhange. Price chart formed an 8 month-long symmetrical triangle. A daily close above 39.50 will confirm the breakout with a possible price target of 48 levels.
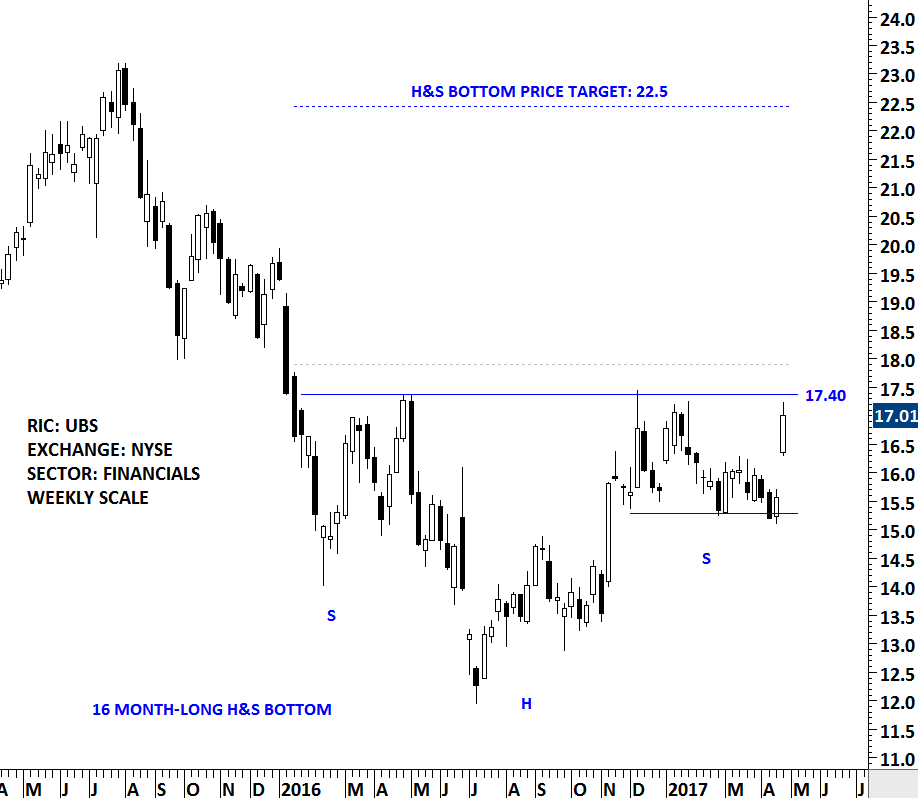
UBS GROUP AG (UBS)
UBS Group AG is a holding company and conducts its operations through UBS AG and its subsidiaries. The Company comprises Corporate Center and five business divisions: Wealth Management, Wealth Management Americas, Personal & Corporate Banking, Asset Management and the Investment Bank. The stock is listed on several exchanges. The chart below shows the listing on the New York Stock Exchange. Price chart formed a 16 month-long H&S bottom with the strong horizontal resistance standing at 17.40 levels. Formation of a multi-month H&S bottom is an important technical development for the European financial stocks. H&S bottom is a bullish reversal chart pattern. Long-term chart patterns, when completed successfully, signal major change in trend. A daily close above 17.90 will confirm the breakout from the multi-month base formation with a possible price target of 22.5.
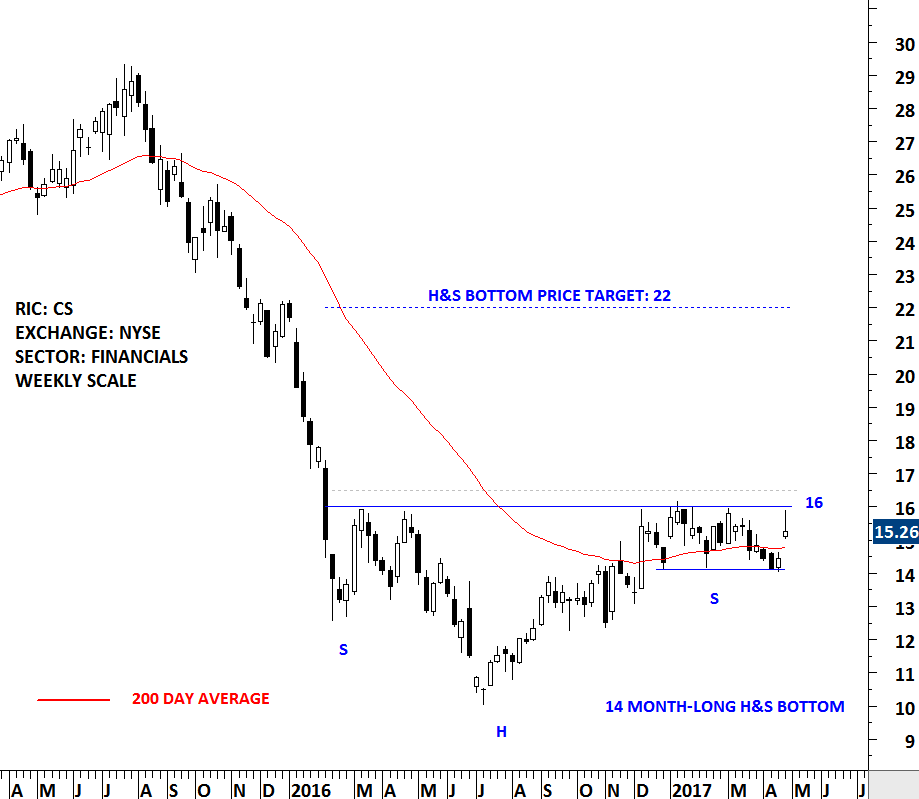
CREDIT SUISSE GROUP AG (CS)
Credit Suisse Group AG (Credit Suisse) is a financial services company. The Company’s segments include Swiss Universal Bank, International Wealth Management, Asia Pacific, Global Markets, Investment Banking & Capital Markets, Strategic Resolution Unit and Corporate Center. The stock is listed on several exchanges. The chart below shows the New York Stock Exchange listing. Price chart formed a 14 month-long H&S bottom with the strong horizontal boundary standing at 16 levels. While Credit Suisse Group is still far from a possible breakout signal, due to its longer-term implications this chart with the other European financial stocks should be followed closely. A daily close above 16.50 levels will confirm the breakout from the multi-month H&S bottom reversal.
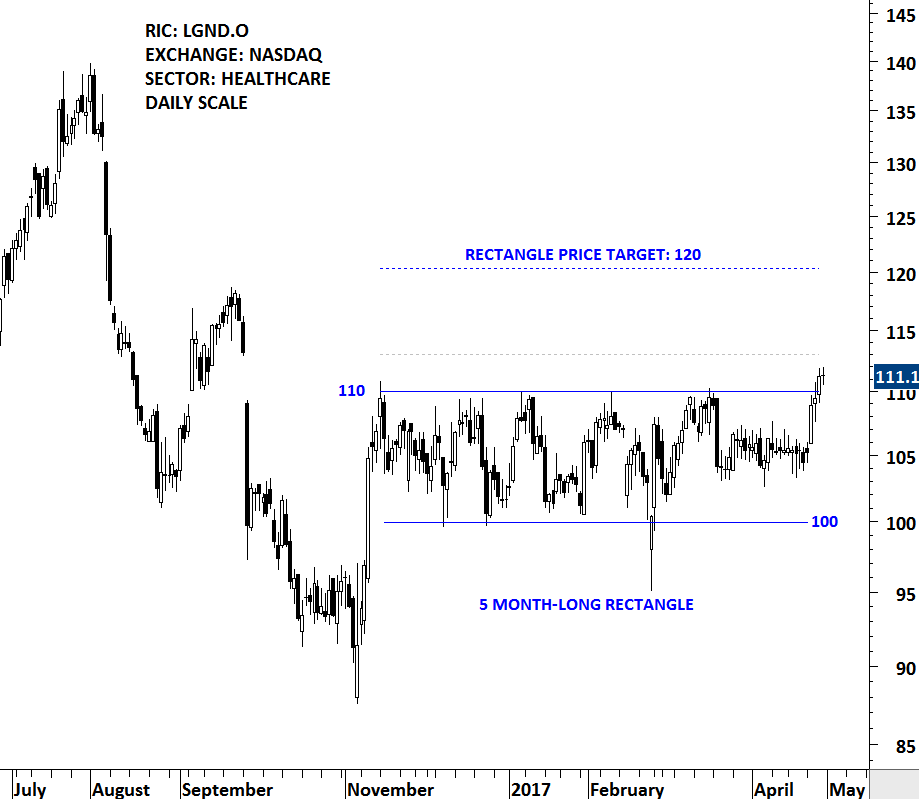
LIGAND PHARMACEUTICALS (LGND.O)
Ligand Pharmaceuticals Incorporated (Ligand) is a biopharmaceutical company that focuses on developing and acquiring technologies that help pharmaceutical companies discover and develop medicines. The Company is involved in the development and licensing of biopharmaceutical assets. The stock is listed on the Nasdaq Stock Exchange. Price chart formed a 5 month-long rectangle. The upper boundary of the rectangle stands at 110 levels. The horizontal boundary was tested several times over the course of the chart pattern. A daily close above 113 levels will confirm the breakout with a possible price target of 120. It is important to note that after breakouts from lengthy & narrow sideways consolidations price can exceed the predetermined chart pattern price target.
