GLOBAL EQUITY MARKETS – June 13, 2020
REVIEW
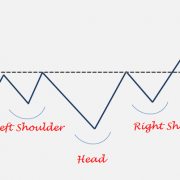
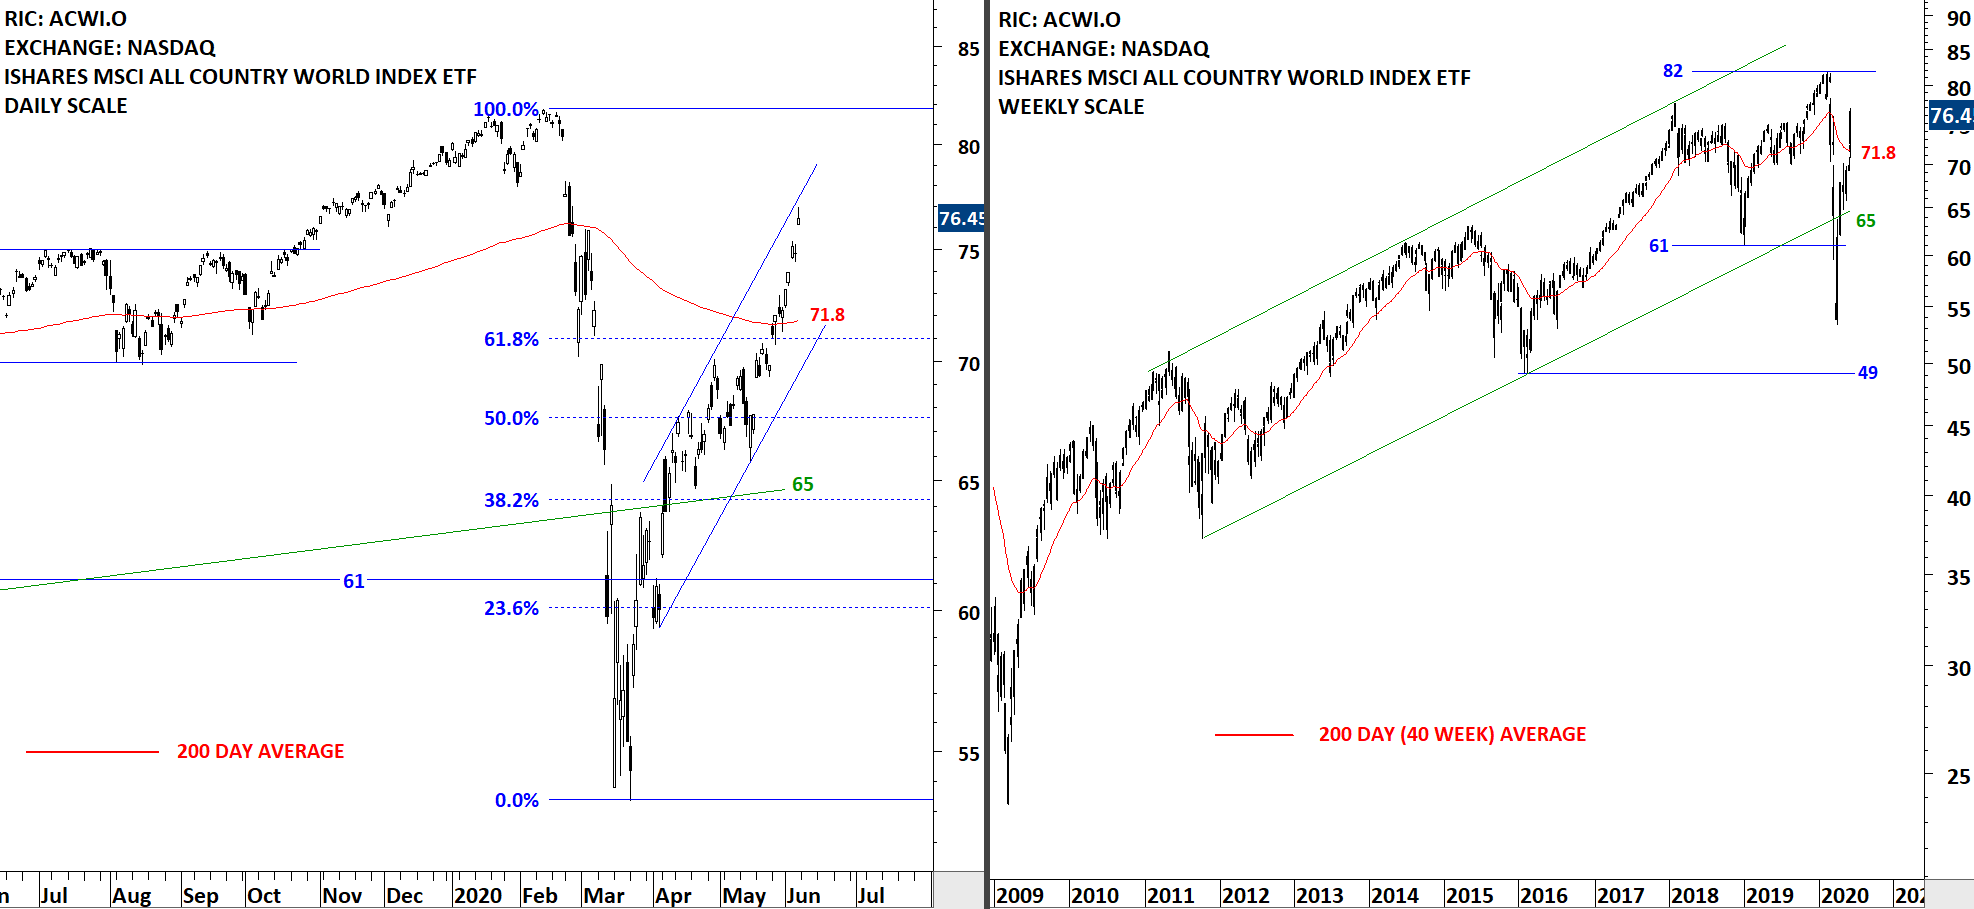
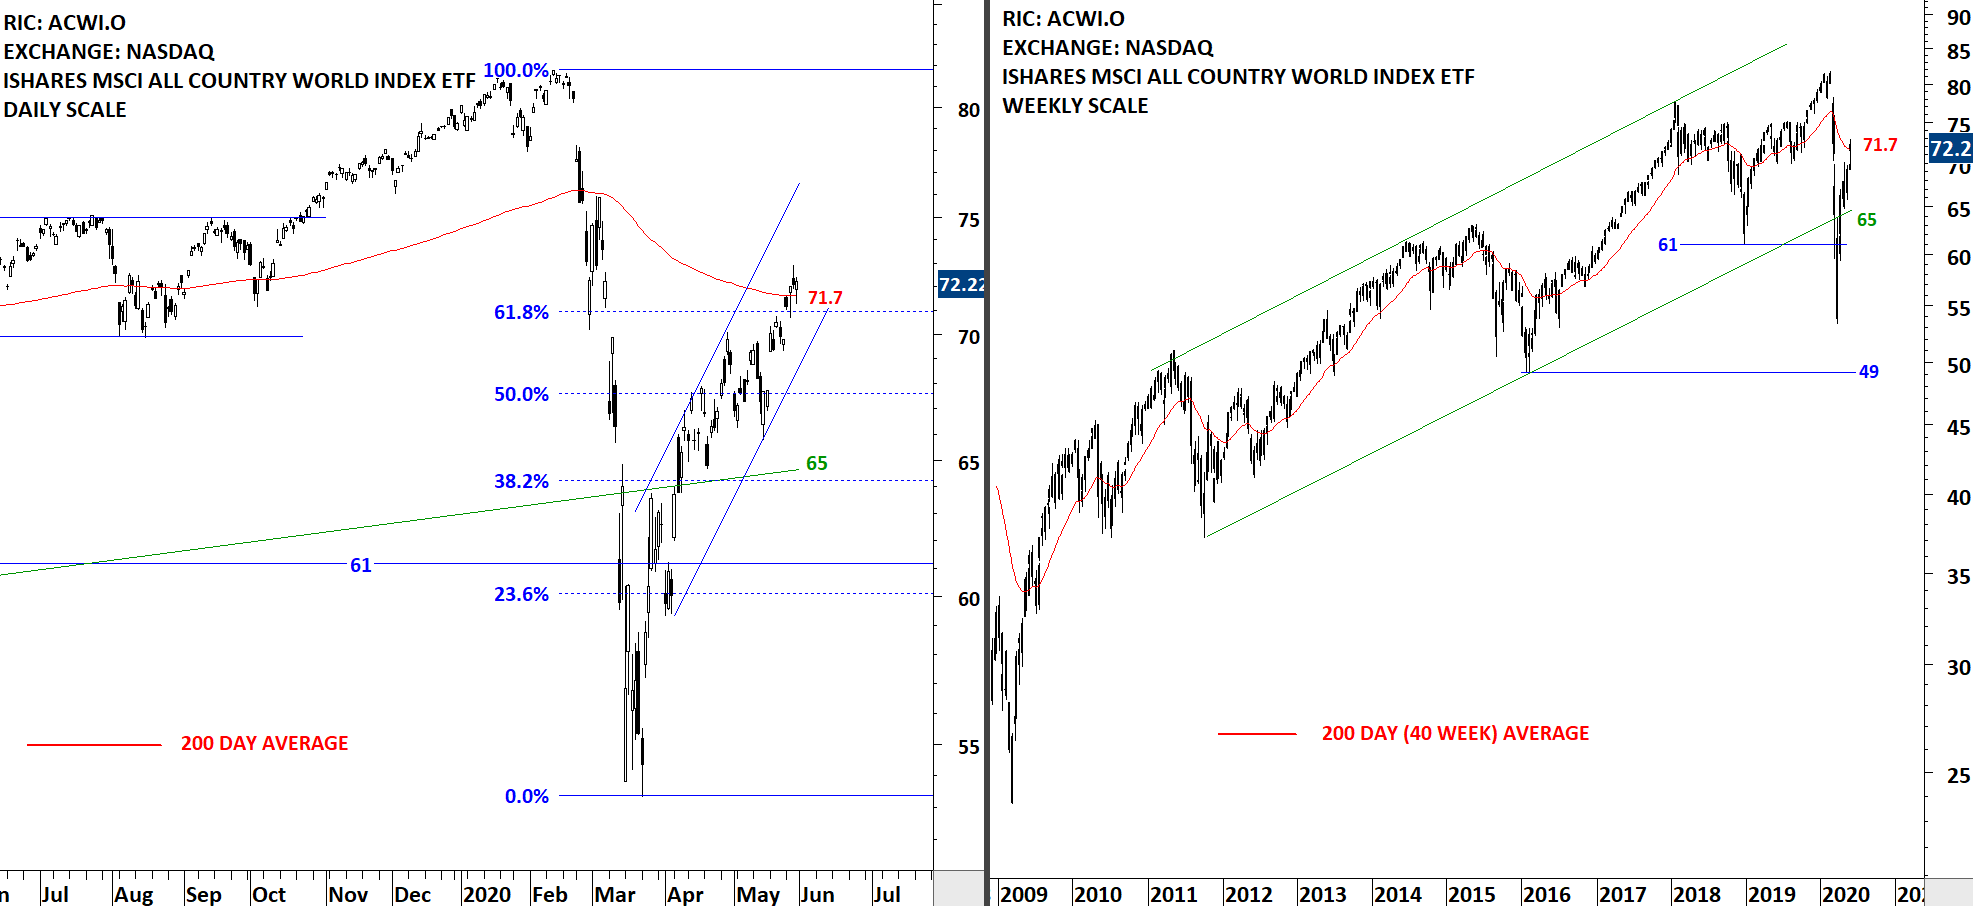
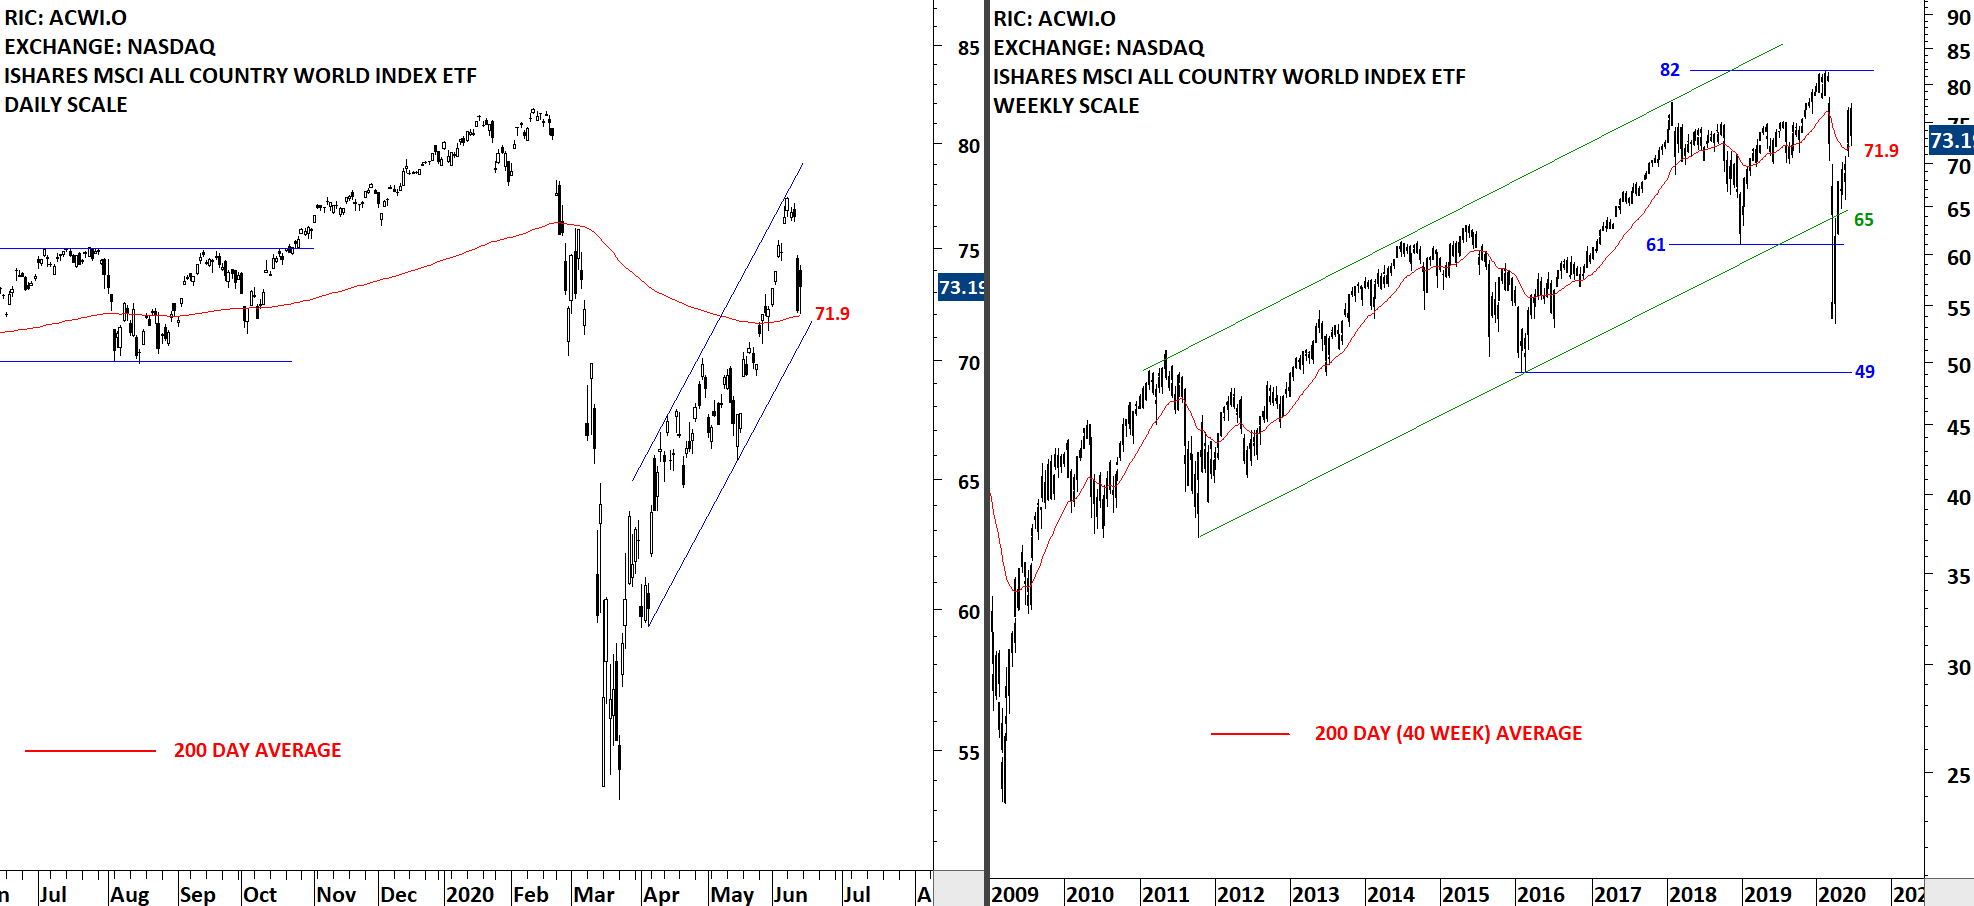
The benchmark for the Global equity markets performance, the iShares MSCI All Country World Index ETF (ACWI.O) pulled back to its 200-day moving average that was acting as support at 71.9 levels. Last two month's price action can be identified as a rising channel. Price can remain inside the trend channel. The acceleration on the upside took a parabolic shape in the short-term. Parabolic price actions are not sustainable. Both the lower boundary of the trend channel and the 200-day average are forming support around the same area. For bullish interpretation to remain intact, price should stabilize above the 200-day average.
 Read More