GLOBAL EQUITY MARKETS – May 20, 2023
REVIEW
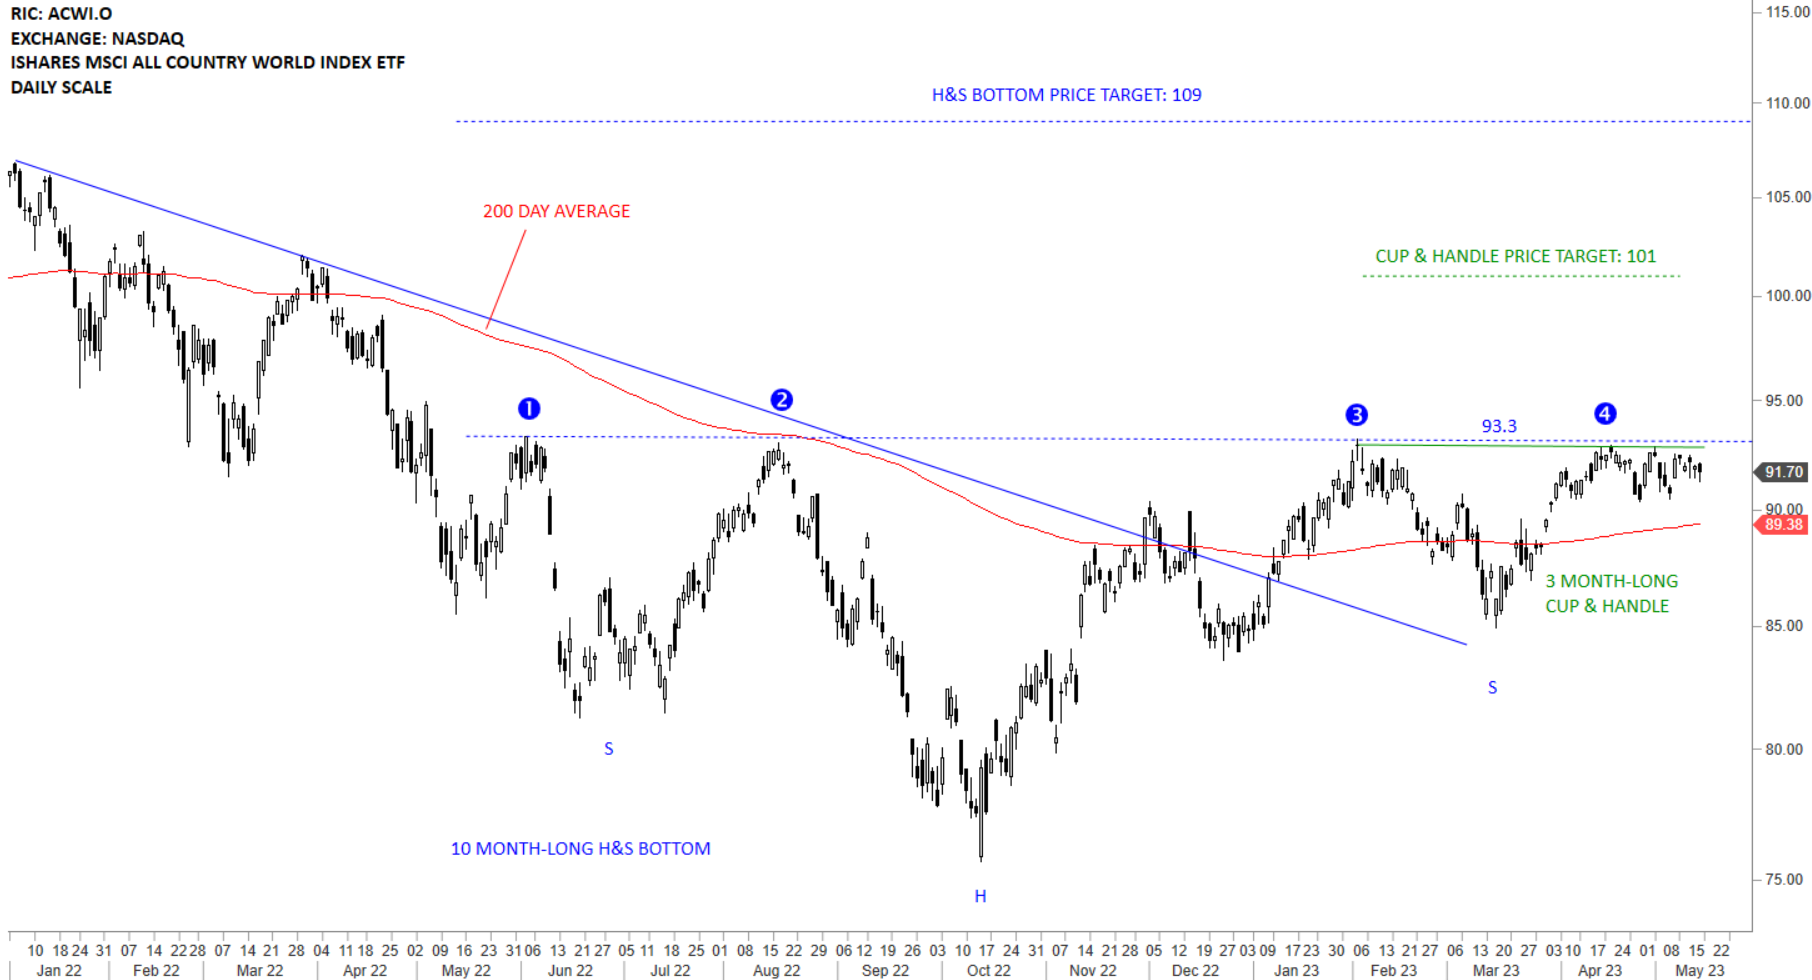
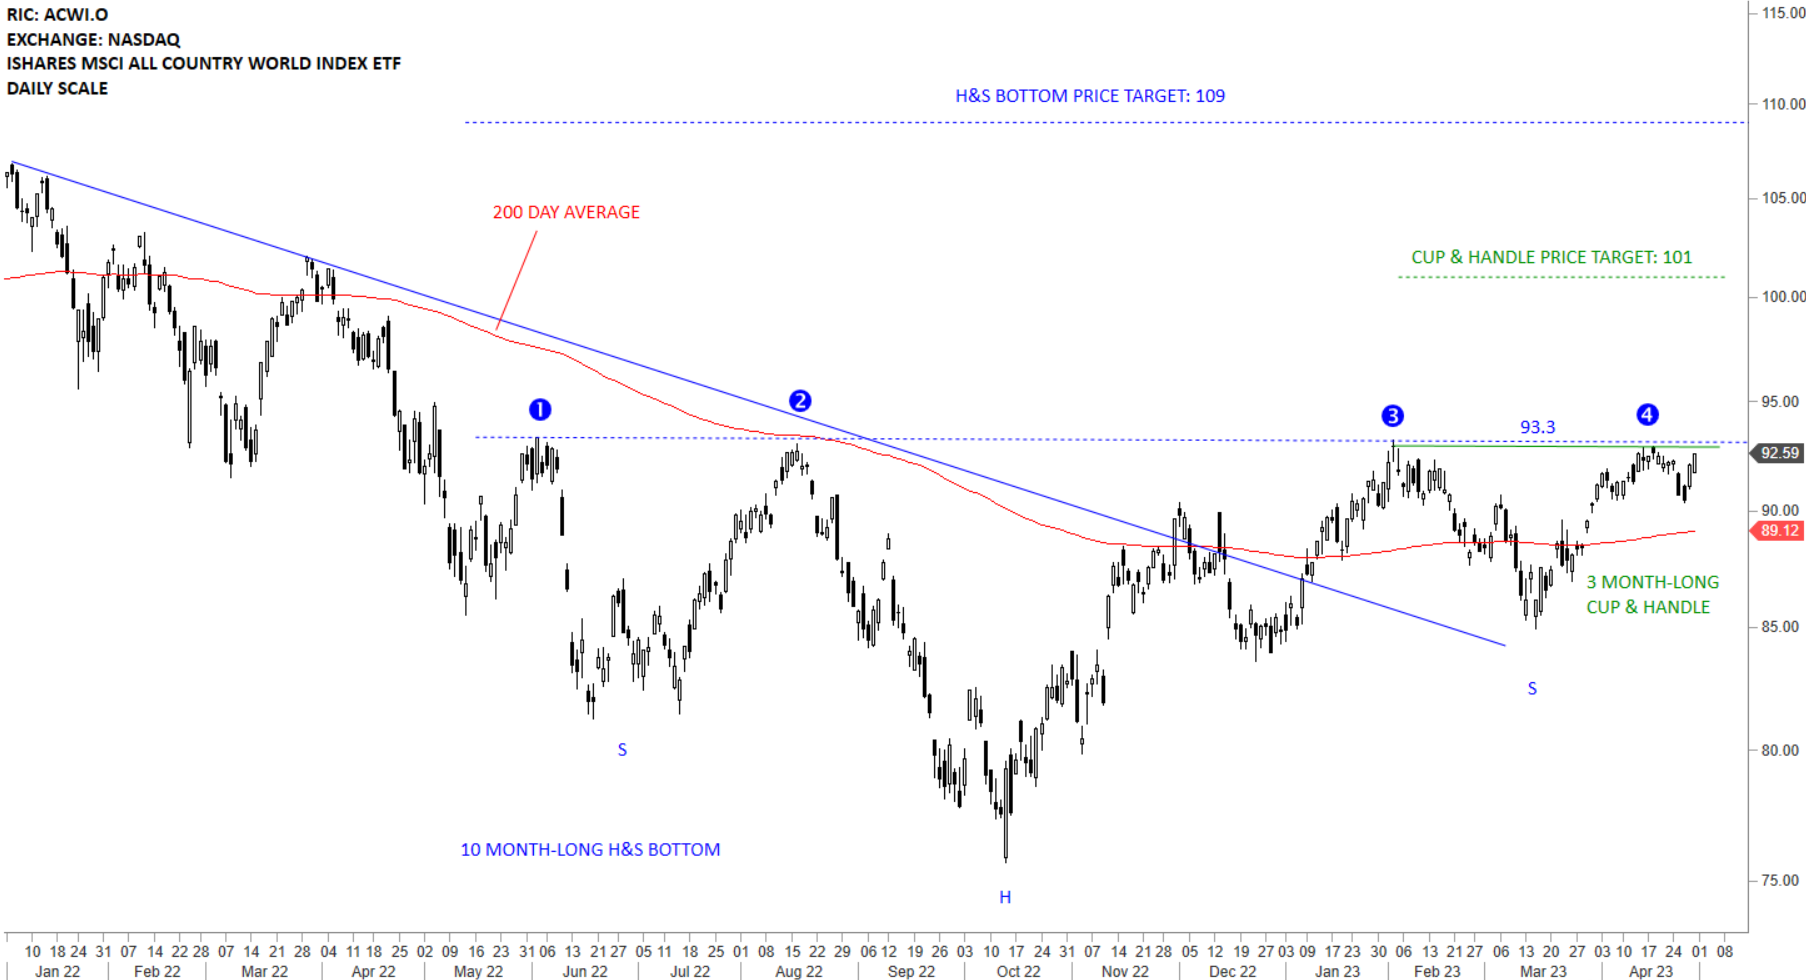
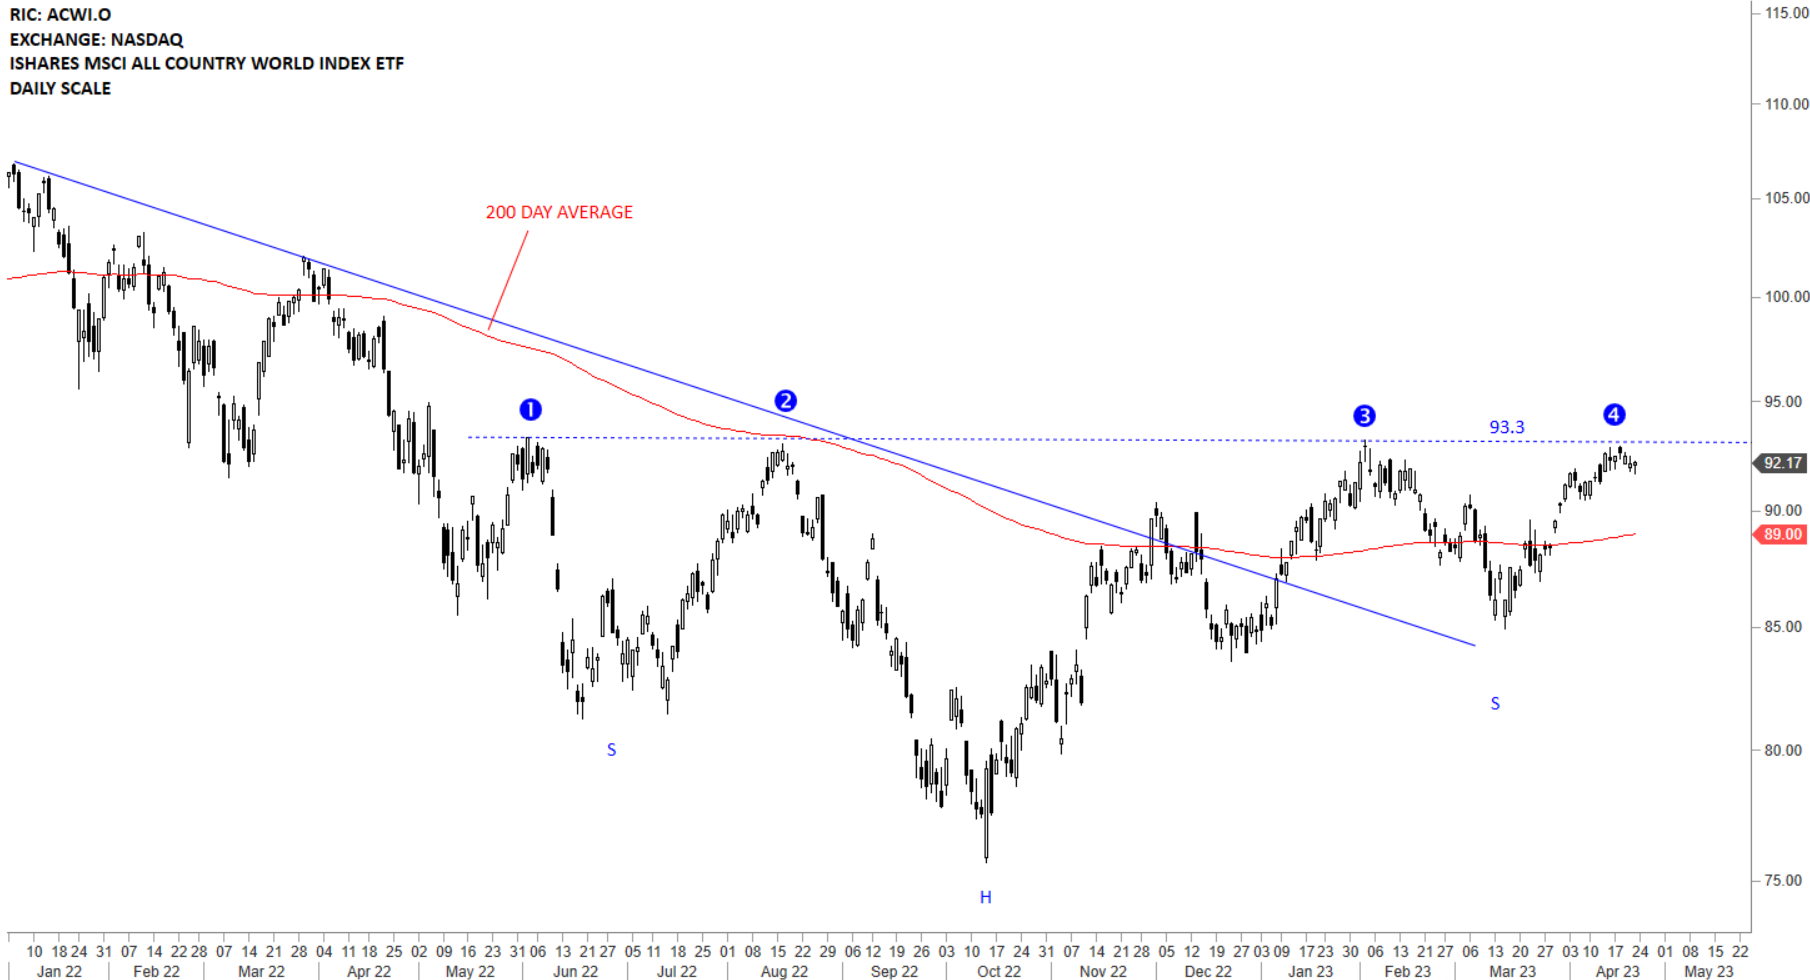
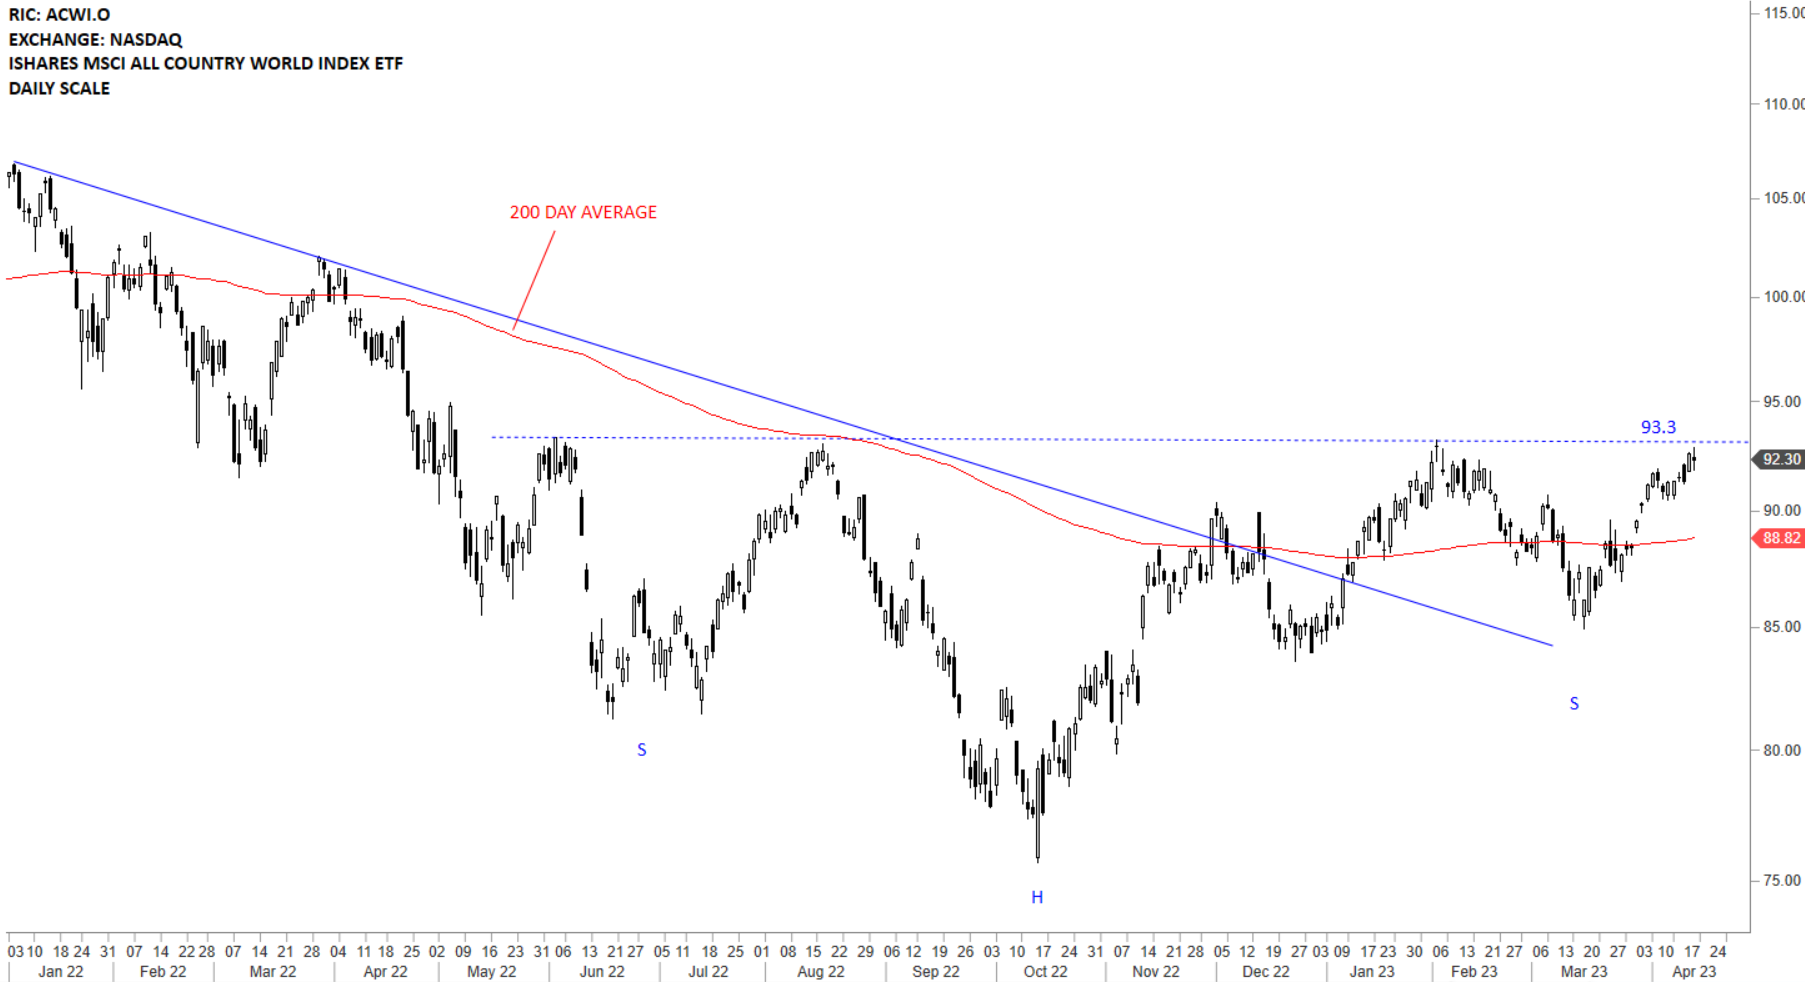
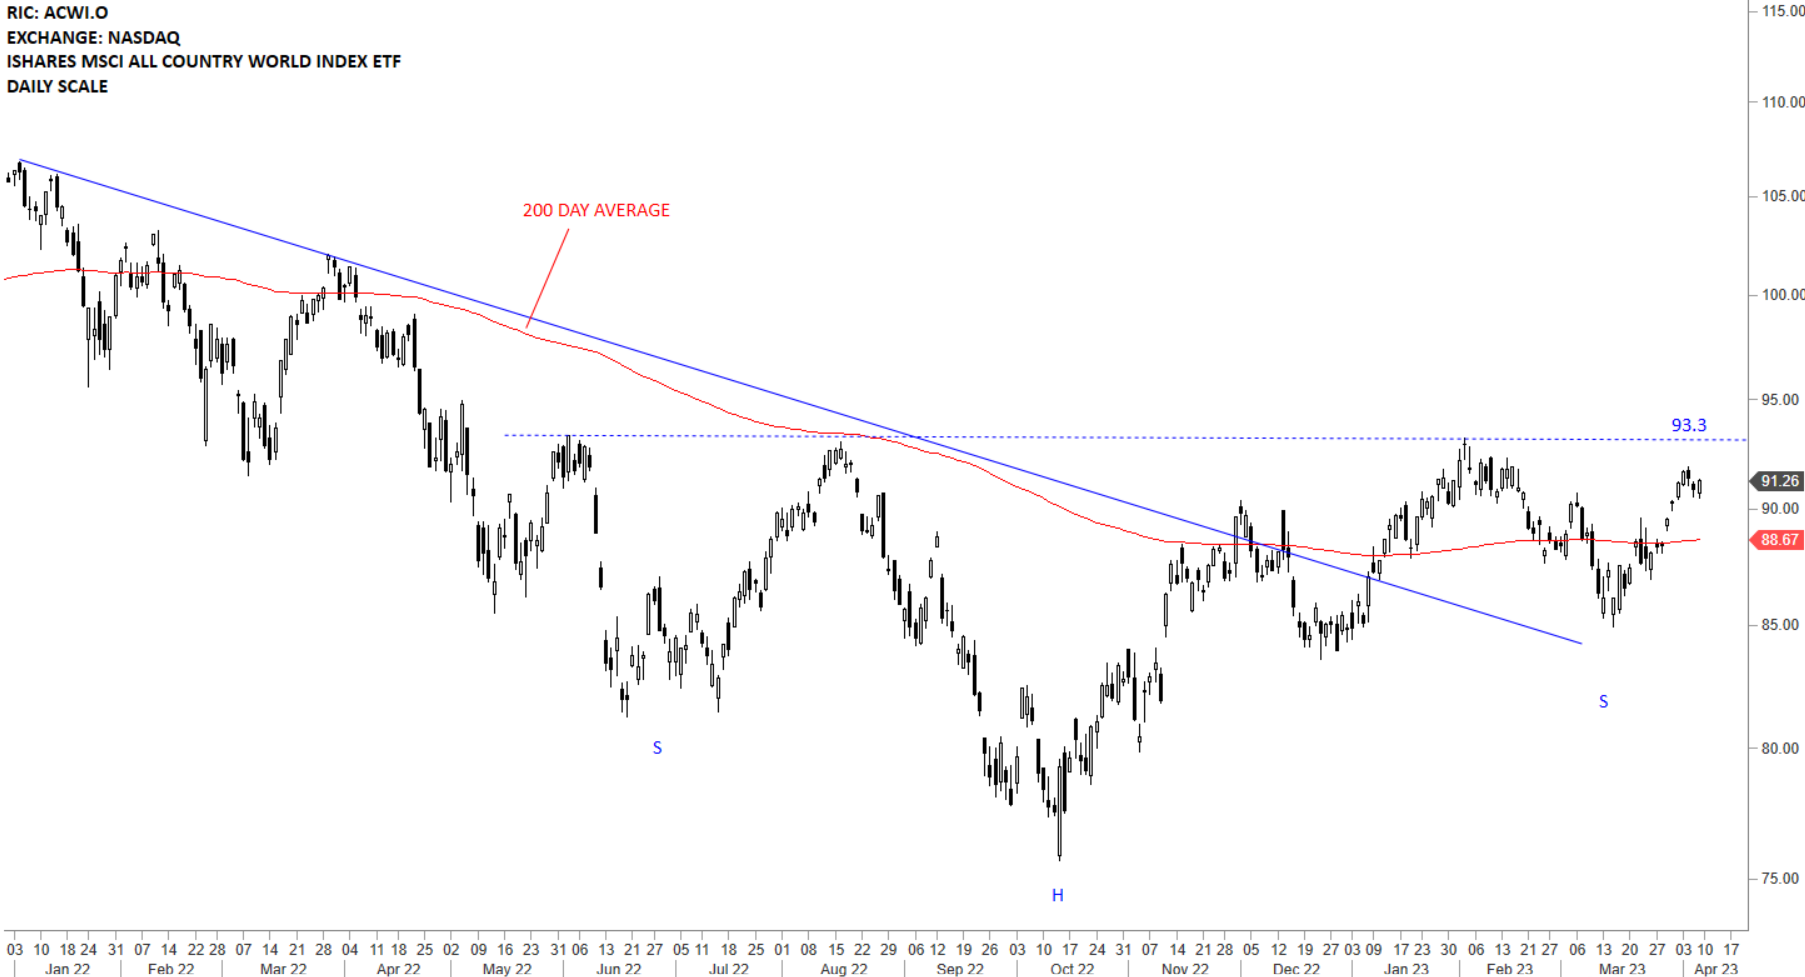
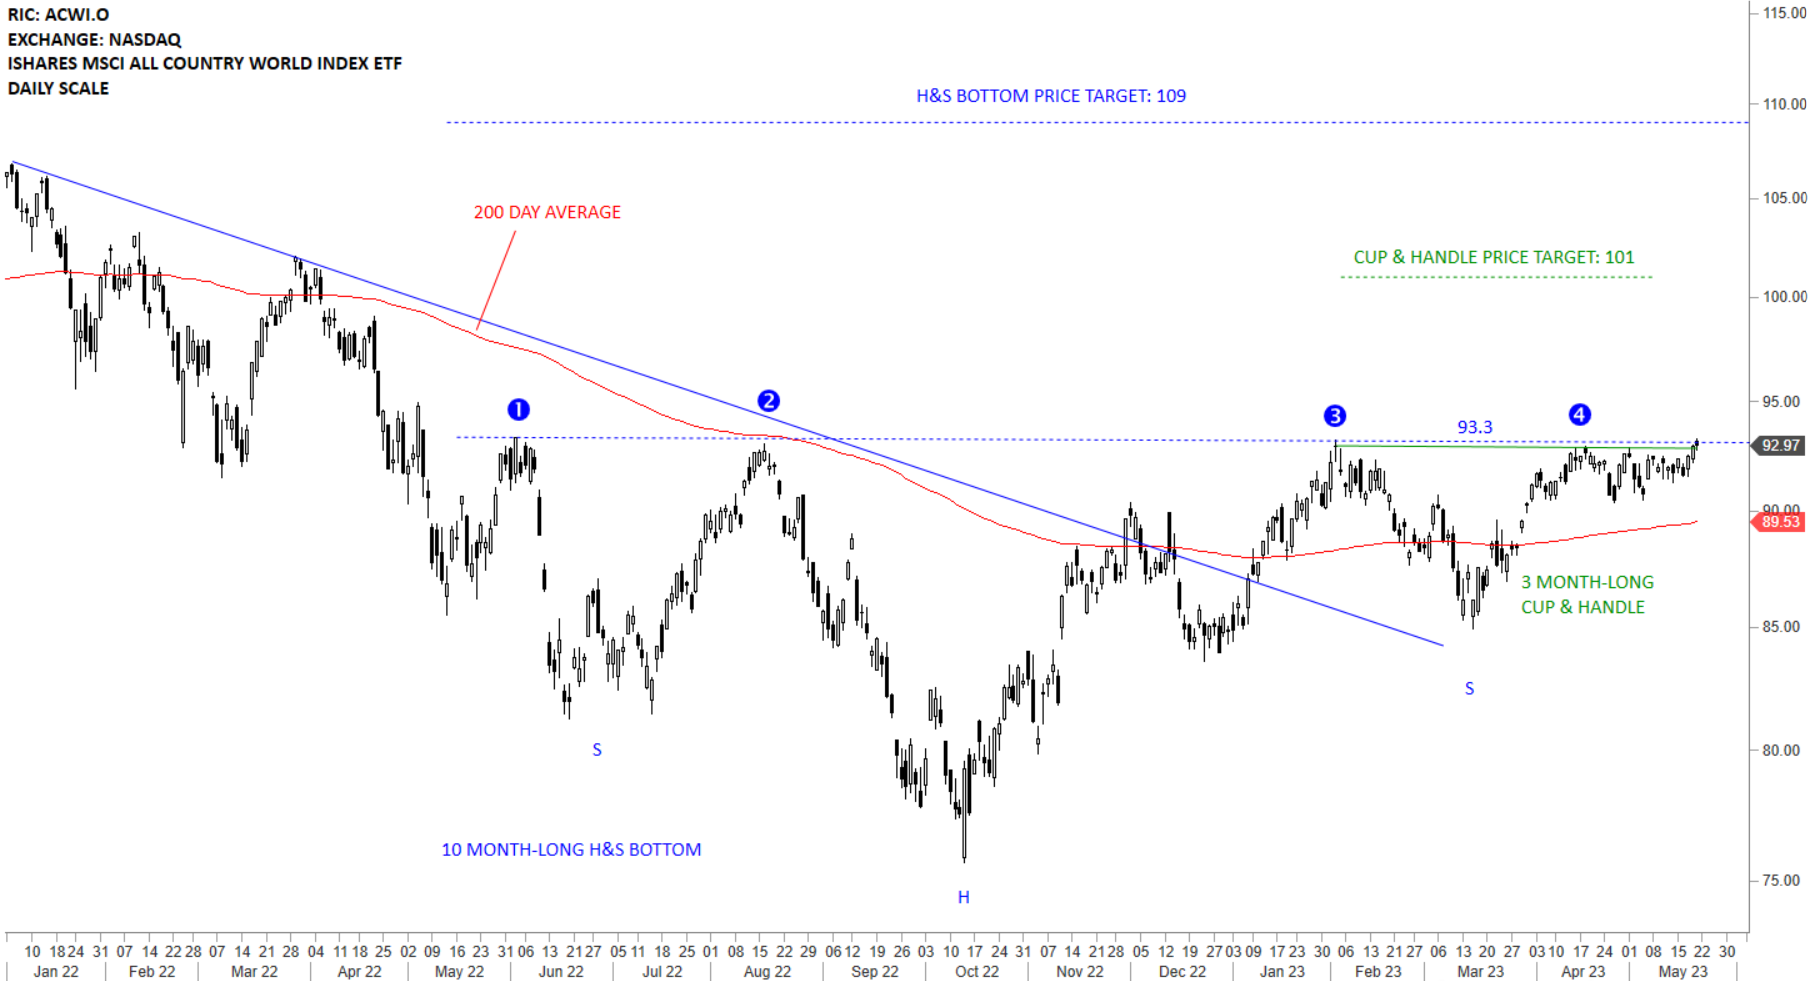
The benchmark for the Global equity markets performance, the iShares MSCI All Country World Index ETF (ACWI.O) is looking for direction. After the 4th test of the strong horizontal resistance at 93.3 levels price pulled back to the 200-day average and rebounded. The last pullback can be the handle of a 3 month-long cup & handle continuation chart pattern that can increase the bullish conviction of the larger scale H&S bottom chart pattern. Breakout above 93.3 levels will be very positive for Global equities. The short-term range is between the 200-day average and the horizontal resistance at 93.3 levels. Cup with handle price target stands at 101 and the larger scale H&S bottom reversal price target is at 109 levels. Consolidation right below the resistance is usually a good sign for a pending breakout.
 Read More