H&S TOP FAILURE
Head and Shoulder top failure can be as valuable as a successful H&S pattern completion. I started keeping statistics for H&S failures and the number of occurrences are increasing to a level which I will soon be able to publish statistically significant numbers.
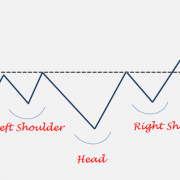
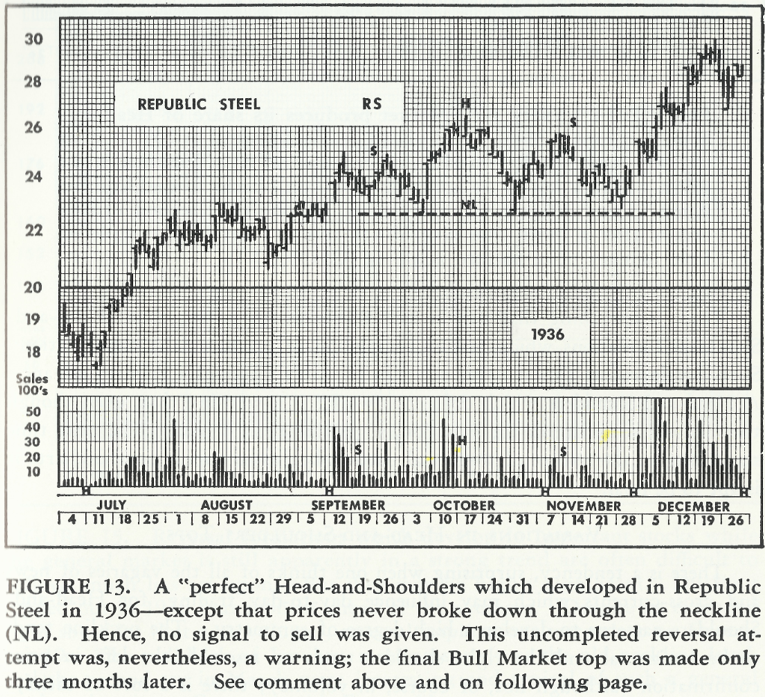
Edwards & Magee in their book Technical Analysis of Stock Trends discussed H&S failures and used the below example.
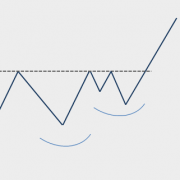
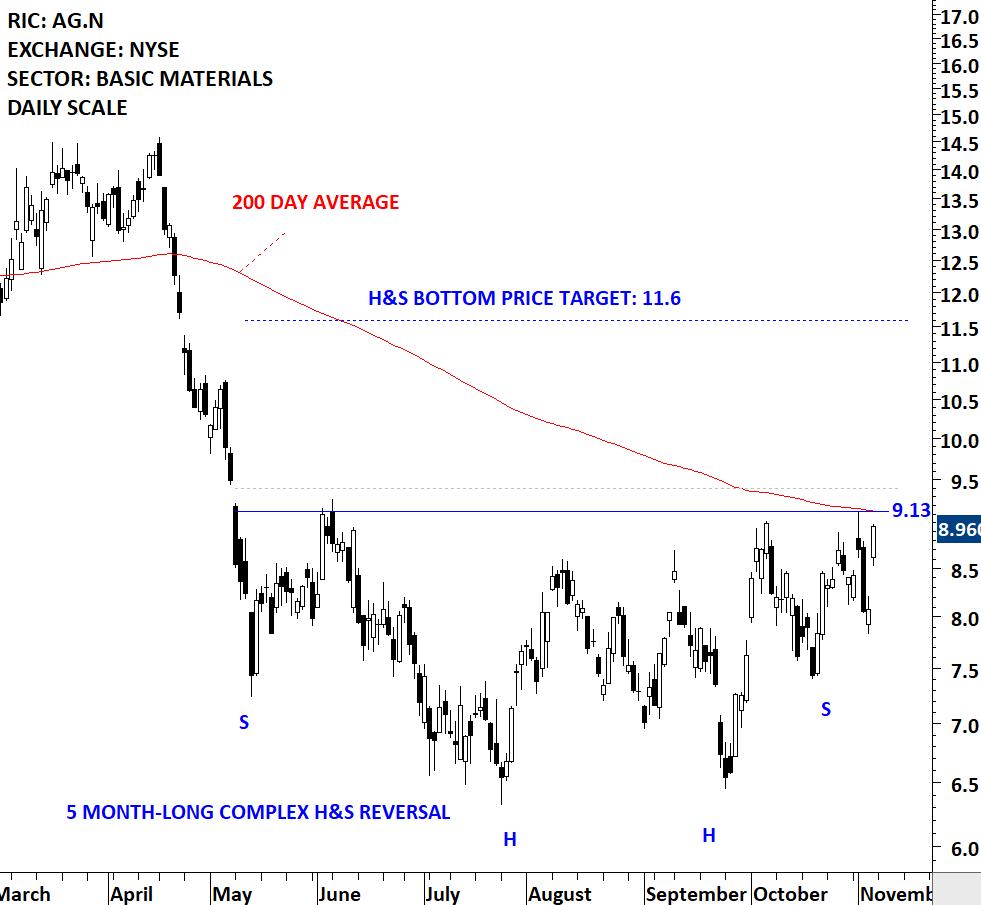
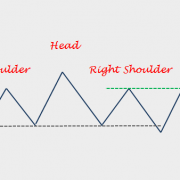
In today’s markets we continue to see similar price structures and repetition of classical chart pattern setups that were identified back in 1930s. The H&S top failure in the below short educational video is what I have identified. I highlighted the important levels for chart pattern negation, price target calculation and also the level for long signal.
Short educational video on H&S top failure
Tech Charts Membership

By becoming a Premium Member, you’ll be able to improve your knowledge of the principles of classical charting.
With this knowledge, you can merge them with your investing system. In fact, some investors use my analyses to modify their existing style to invest more efficiently and successfully.

As a Premium Member of Aksel Kibar’s Tech Charts,
You will receive:
-
Global Equities Report. Delivered weekly.
-
Classical charting principles. Learn patterns and setups.
-
Actionable information. Worldwide indices and stocks of interest.
-
Risk management advice. The important trading points of each chart.
-
Information on breakout opportunities. Identify the ones you want to take action on.
-
Video tutorials. How patterns form and why they succeed or fail.
-
Watch list alerts. As they become available so you can act quickly.
-
Breakout alerts. Usually once a week.
-
Access to everything (now and as it becomes available)o Reports
o Videos and video series -
Multi-part webinar course. You learn the 8 most common charting principles.
-
Webinars. Actionable and timely advice on breaking out chart patterns.
For your convenience your membership auto renews each year.