
BLOOMBERG ALL COMMODITY STRATEGY ETF (BCI)
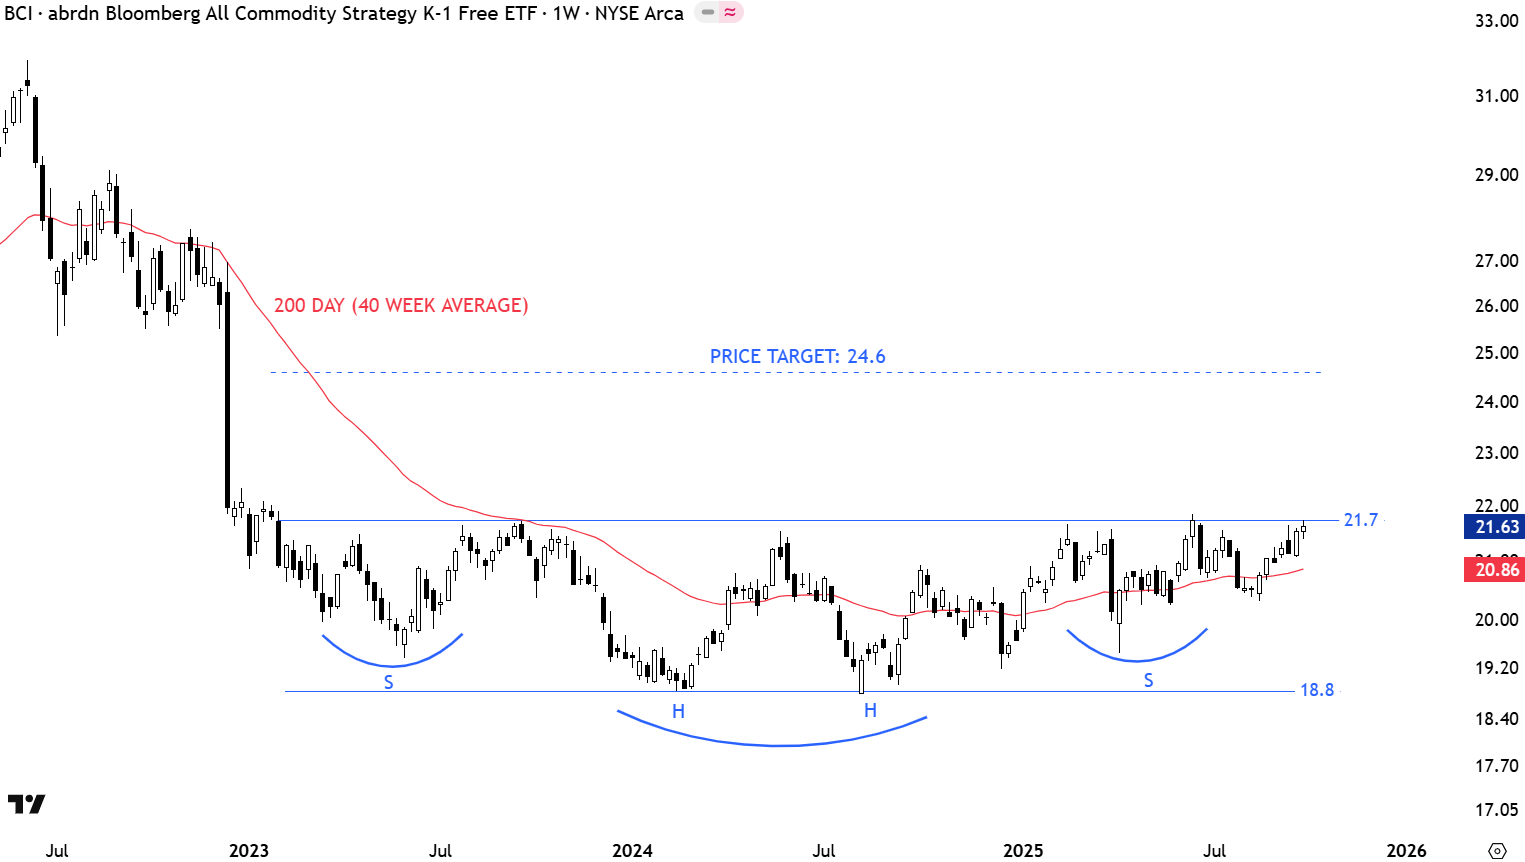
Every week Tech Charts Global Equity Markets report features some of the well-defined, mature classical chart patterns under a lengthy watchlist and the chart pattern breakout signals that took place during that week. Global Equity Markets report covers single stocks from developed, emerging and frontier markets, ETF’s, select commodities, cryptocurrencies and global equity indices. Below chart, BCI ALL COMMODITY STRATEGY ETF is from the review section of the weekly report. It is featuring a possible complex H&S bottom reversal that is ready for breakout after several tests of pattern boundary.
BCI – BLOOMBERG ALL COMMODITY STRATEGY ETF
BCI is a commodity ETF tracking a broad-based index, providing exposure to various commodities like energy, metals, and agriculture, without issuing a K-1 tax form, which simplifies tax reporting. Its performance is tied to commodity market trends, which can be influenced by global economic conditions, inflation, and supply-demand dynamics. The chart is possibly forming a 2 year-long bottom reversal that can be identified as a complex H&S bottom. The neckline is at 21.7 levels. A daily close above 22.3 levels can confirm the bottom reversal with the price target of 24.7 levels. It is important to note that completion of the multi-year long bottom can be the beginning of a longer-term uptrend in commodities. For that reason I would like to see a decisive weekly close above the several times tested upper boundary.
The Complex Pattern – a Reliable Forecaster
The sixth type of reversal formation, which we are now ready to study, is the Complex Formation and it allies itself strongly with the Head and Shoulders and the Common or Rounding Turn patterns as being a reliable forecaster, in itself, of a reversal from the previous trend into a new direction of price movement. The Com plex Formation is, in addition, one of the strongest of all our reversal patterns. It stands so far ahead of the others in this respect that if it were a more common development it would, with little doubt, take the crown of importance away from the Head and Shoulders formation, and lead our entire list of reversal pictures. The Complex Reversal is, as a matter of fact, merely a stronger, longer and more detailed form of the Head and Shoulders picture. For that reason it is found less frequently but, also for that reason, it is one of our most reliable indicators of definite reversals in the comparatively rare cases where it is found.
The Complex Formation divide themselves into two more detailed aspects of the Head and Shoulders pattern. These are the shoulders and multiple head type, and the head and multiple shoulders type. Their appelations suggest rather clearly their definitions. The shoulders and multiple head form is simply our old friend the Head and Shoulders, but with a double, or multiple, head. The head and multiple shoulders form is also like the regulation Head and Shoulders picture but while the head is single, the shoulders are in multiples. Both of these Complex Formations are reversals and they appear, therefore, either as tops or bottoms.
Relation to the Double Tops and Bottoms
In addition to its close relation to the Head and Shoulders formation, the Shoulders and Multiple Head classification partakes also, of course, of the nature of the Multiple formations which we have just studied – especially the Double Tops and the Double Bottoms. However, the Complex pattern we are now considering, when it has two or more heads, makes these heads too close together to be defined as a Double or a Multiple Top. Moreover, the Complex Formation, as we have stated above, is stronger than the Multiple Formation and is more quickly recognized, permitting us to take a somewhat quicker and more profitable trading position.
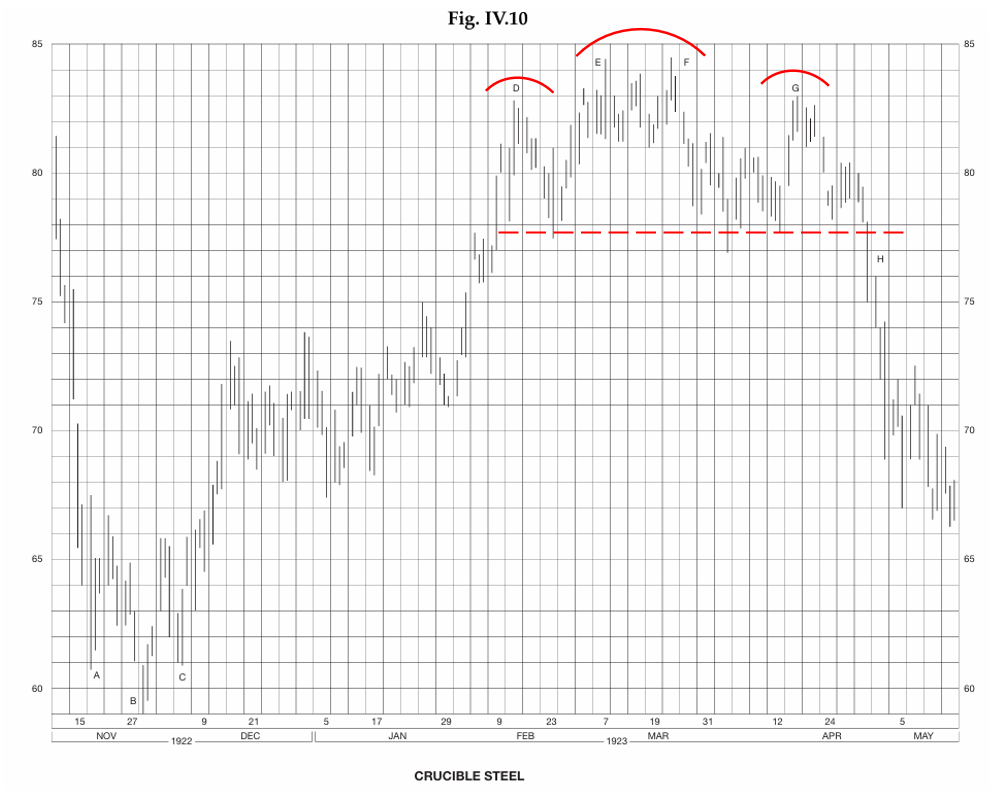
The Double Head and Shoulders Top
We have noted in our introduction to the Complex patterns that they are not common; ideal formations, perfect in every respect, are indeed extremely rare. We may, therefore, be pardoned if we go back in the files for a classic example in order to give our readers a first look at this interesting formation. Incidentally, this illustration serves also to point the fact that previous bull market produced the same technical pattern we found in 1929, and are finding today. Figure IV.10 shows the price action in Crucible Steel from November, 1922 to May, 1923. (A reference to the long-term chart of the Dow-Jones Industrial Average at the beginning of this Course shows that a general reversal in the market occurred at this time.) In November, 1922, Crucible Steel after a rapid drop down to 60 from above 80, reversed its trend with a perfect Head and Shoulders pattern of the ordinary type at A-B-C. Thereafter the stock worked up in a few months to 82 at point D, where it met resistance and formed the left shoulder of our Double Head and Shoulders Top. After a brief reaction the stock succeeded in getting up through that one previous point of resistance but was again stopped dead on two successive occasions, points E and F, at the 841/2 level. The stock backed away once more from the double head and, finally, staged one more rally to point G, the right shoulder, in a vain effort to renew the advance. But selling pressure was now too strong; the technical balance had definitely changed and, at H, the neck-base line was broken and the reversal formation was completed.
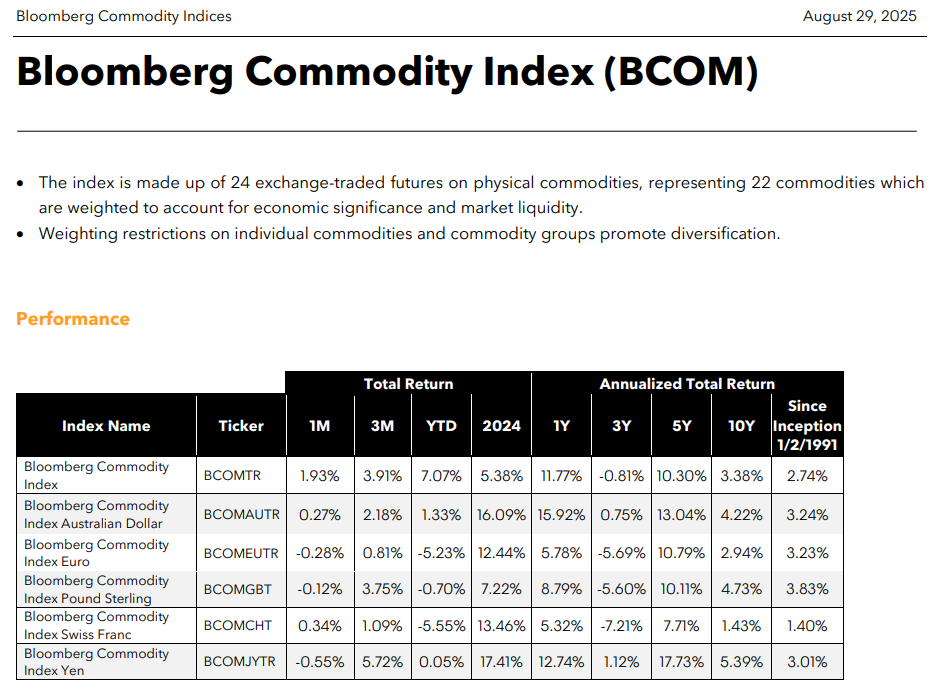
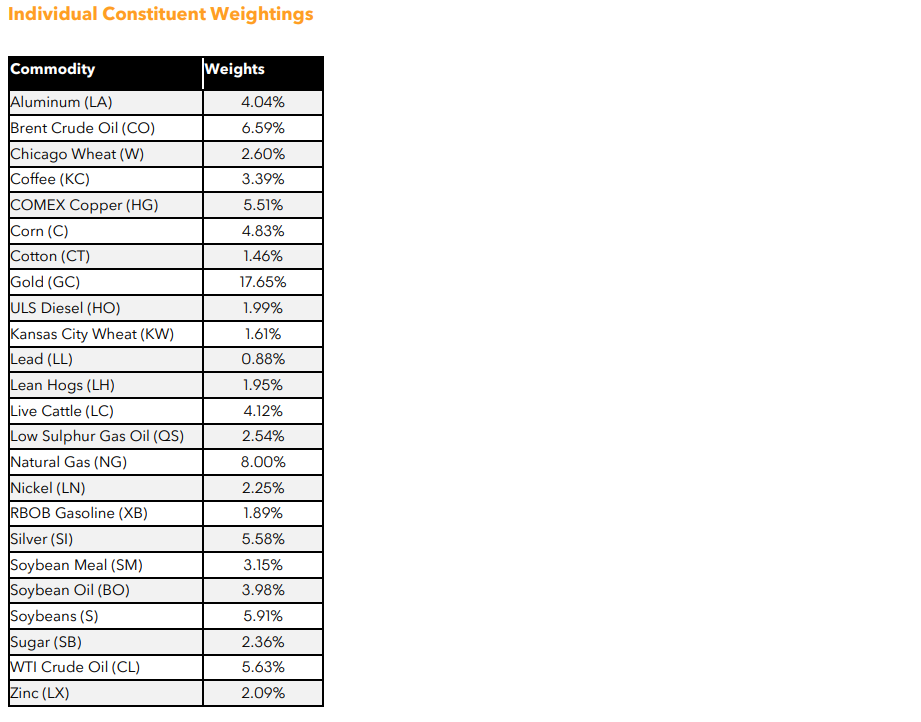
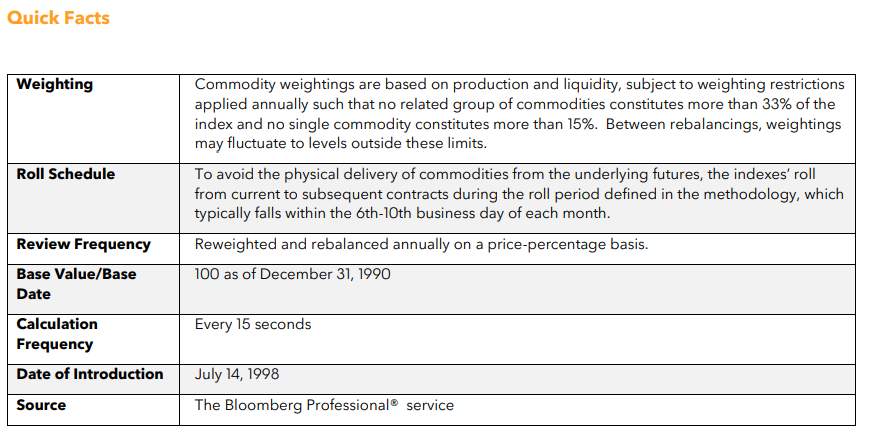
MORE ON THE ETF’S CONSTRUCTION AND FACTS (AS OF AUGUST 29, 2025)

Tech Charts Membership

By becoming a Premium Member, you’ll be able to improve your knowledge of the principles of classical charting.
With this knowledge, you can merge them with your investing system. In fact, some investors use my analyses to modify their existing style to invest more efficiently and successfully.

As a Premium Member of Aksel Kibar’s Tech Charts,
You will receive:
-
Global Equities Report. Delivered weekly.
-
Classical charting principles. Learn patterns and setups.
-
Actionable information. Worldwide indices and stocks of interest.
-
Risk management advice. The important trading points of each chart.
-
Information on breakout opportunities. Identify the ones you want to take action on.
-
Video tutorials. How patterns form and why they succeed or fail.
-
Watch list alerts. As they become available so you can act quickly.
-
Breakout alerts. Usually once a week.
-
Access to everything (now and as it becomes available)o Reports
o Videos and video series -
Multi-part webinar course. You learn the 8 most common charting principles.
-
Webinars. Actionable and timely advice on breaking out chart patterns.
For your convenience your membership auto renews each year.


