
HEAD & SHOULDER FAILURE
Every week Tech Charts Global Equity Markets report features some of the well-defined, mature classical chart patterns under a lengthy watchlist and the chart pattern breakout signals that took place during that week. Global Equity Markets report covers single stocks from developed and emerging markets, ETF’s and global equity indices. The report starts with a review section that highlights the important chart developments on global equity benchmarks. This blog post features an educational piece from the Tech Charts Study of the Global Equity Markets report.
HEAD & SHOULDER FAILURE
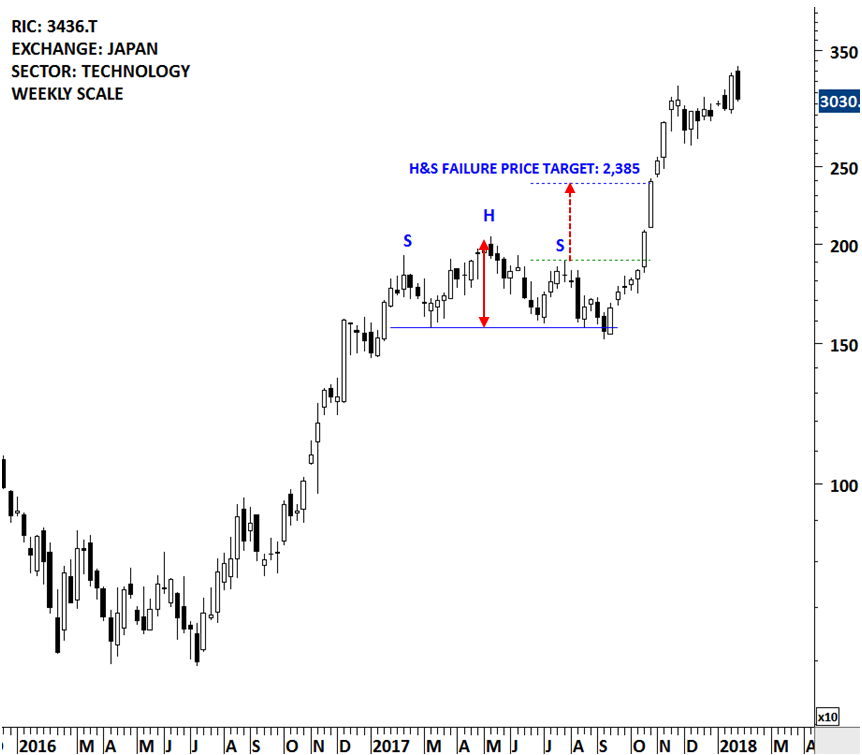
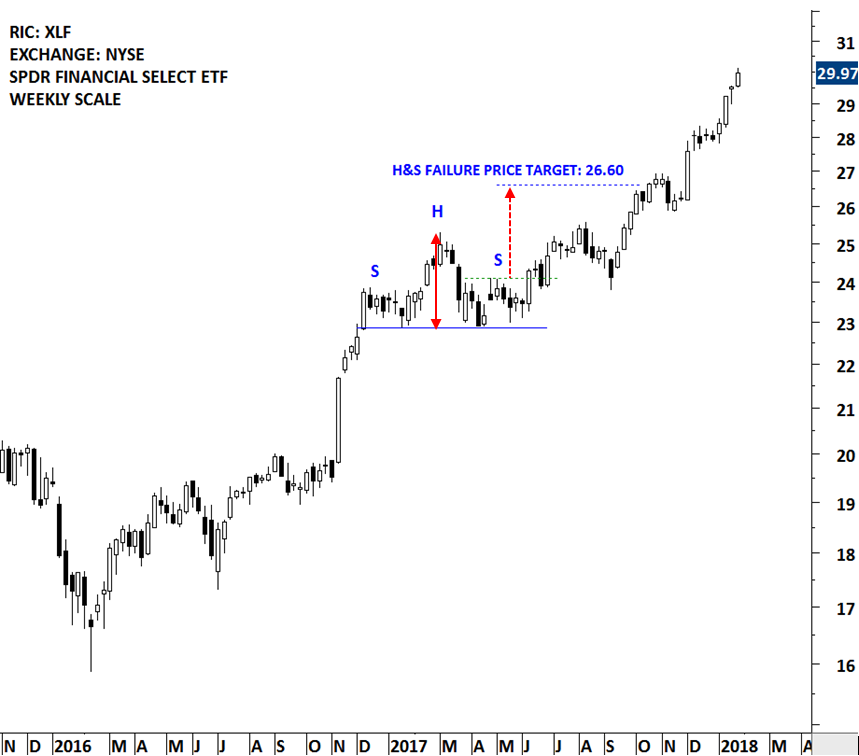
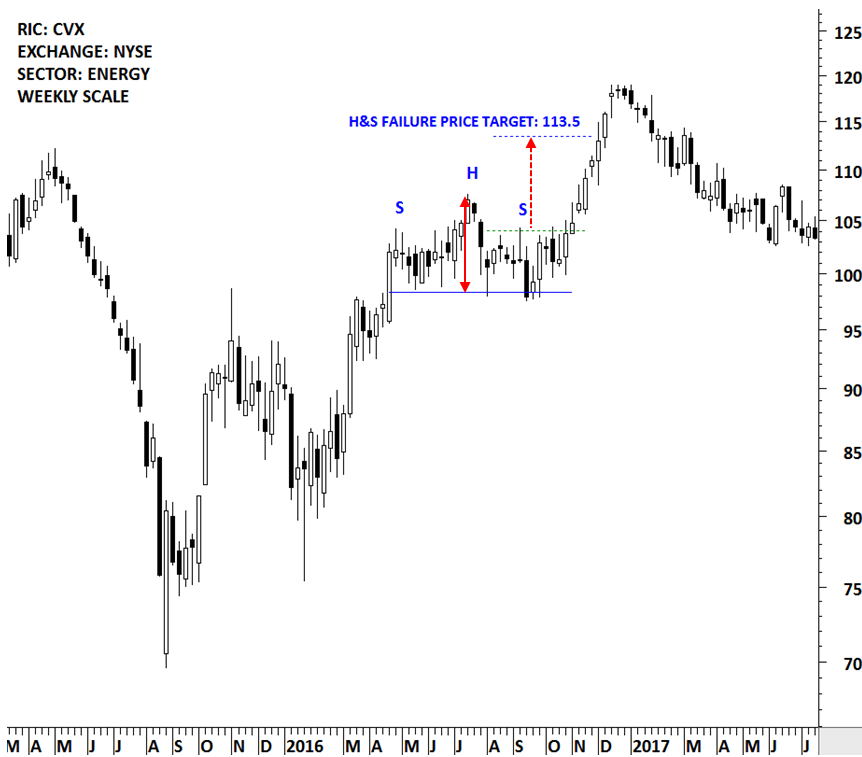
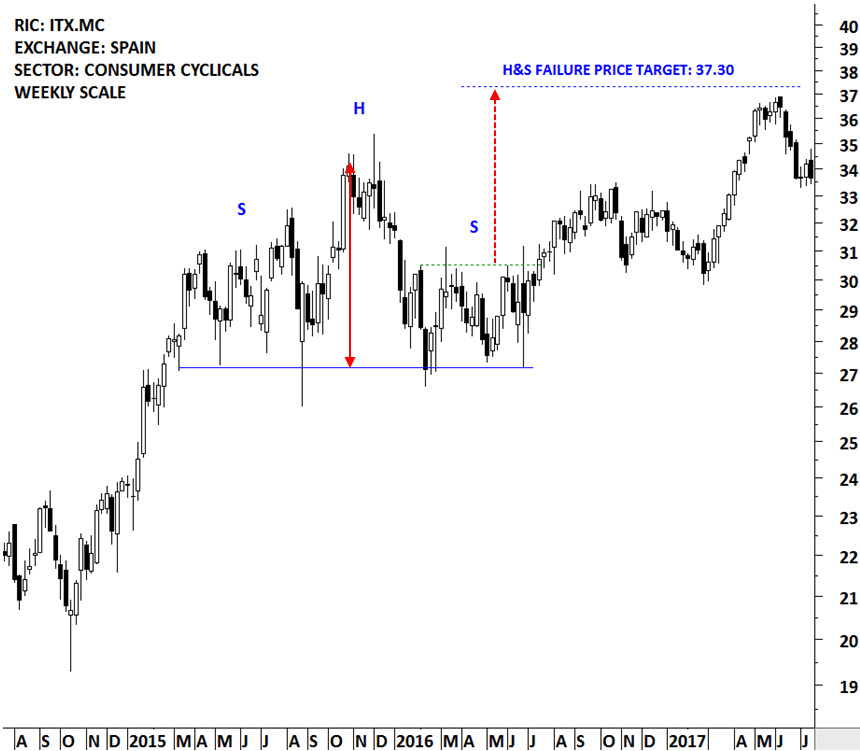
Head and Shoulder is a reliable reversal chart pattern that forms after an advance or a decline and the completion of the formation suggests a reversal of the existing trend. Global Equity Markets report focuses mainly on chart patterns with horizontal boundaries. H&S shoulder chart patterns with horizontal necklines are usually highlighted in the weekly reports.
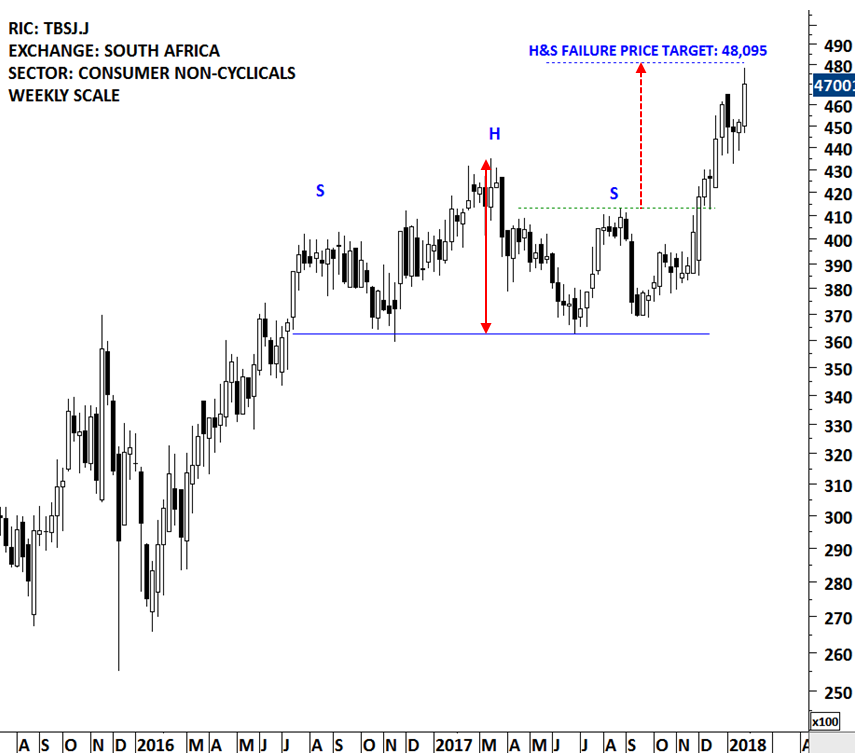
As it is the case with different classical chart patterns, H&S reversals can fail. However, the failure of this specific reversal chart pattern can be more informative than other classical chart pattern failures. Both the failure of a H&S after a confirmed breakdown of the neckline or failure without completing the chart pattern with a decisive breakout, would invalidate the earlier interpretation. The failure, once confirmed, would help us set price targets for the newly established trend. A breach above/below the right shoulder would negate the chart pattern and confirm it as a H&S failure. H&S failure chart pattern price target is calculated by taking the width of the chart pattern between the Head and the neckline and adding it to the highest point of the right shoulder (for H&S top reversal failures). Below are some examples. I plan to highlight more H&S failures in the Tech Charts Alert section as they take place. The next educational video will be on H&S failures and will discuss the fine points of this important chart pattern development.
Tech Charts Membership

By becoming a Premium Member, you’ll be able to improve your knowledge of the principles of classical charting.
With this knowledge, you can merge them with your investing system. In fact, some investors use my analyses to modify their existing style to invest more efficiently and successfully.

As a Premium Member of Aksel Kibar’s Tech Charts,
You will receive:
-
Global Equities Report. Delivered weekly.
-
Classical charting principles. Learn patterns and setups.
-
Actionable information. Worldwide indices and stocks of interest.
-
Risk management advice. The important trading points of each chart.
-
Information on breakout opportunities. Identify the ones you want to take action on.
-
Video tutorials. How patterns form and why they succeed or fail.
-
Watch list alerts. As they become available so you can act quickly.
-
Breakout alerts. Usually once a week.
-
Access to everything (now and as it becomes available)o Reports
o Videos and video series -
Multi-part webinar course. You learn the 8 most common charting principles.
-
Webinars. Actionable and timely advice on breaking out chart patterns.
For your convenience your membership auto renews each year.
[print-me target=”div#id_of_element_to_print” title=”Print Form”]


