U.S. INITIAL JOBLESS CLAIMS
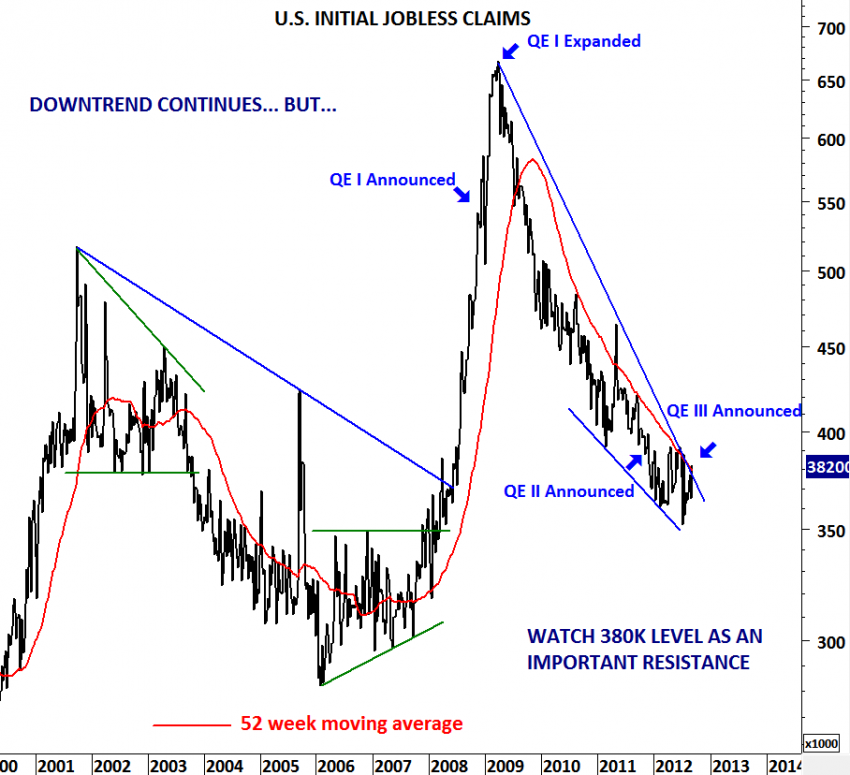
Can additional QE help the jobs market? FED believes that it will. What the data tell us is something different. Let’s analyze… I’ve been frequently updating the U.S. Initial Jobless Claims chart and drawing attention to the slowing downward momentum on the jobless claims. In this post I added the timeline for past and present quantitative easing announcements. As you can see from the chart, between QE I and QE II jobless claims dropped sharply from 650 K to 400K. However after the QE II announcement the impact on the jobs market was limited. It has been a year since QE II was announced and initial jobless claims are still at 382K levels. Last week FED decided to go ahead with another round of QE which is called QE III. At the same time jobless claims reached 382K levels. We all know from the earlier updates that 52-week moving average is an important threshold and jobless claims above 380K could reverse the last 3 year’s downtrend. Now the question is: What if QE III fails to push jobless claims further down but instead we see higher jobless claims in the following months? In the following weeks and months we should keep an eye on 380K levels. Jobless claims data that is above 380K could challenge the argument of fixing unemployment with further quantitative easing.


