SYMMETRICAL TRIANGLEASCENDING TRIANGLEDESCENDING TRIANGLERECTANGLEH&S TOPH&S BOTTOMH&S CONTINUATIONCUP & HANDLEMember WebinarsGeneral Education
 https://blog.techcharts.net/wp-content/uploads/2018/07/SYMMETRICAL-TRIANGLE-BEARISH-CONTINUATION-IMAGE-II.png
324
738
Aksel Kibar
https://blog.techcharts.net/wp-content/uploads/2017/05/Tech-Charts-logo-FINAL-CLEAN-340w.png
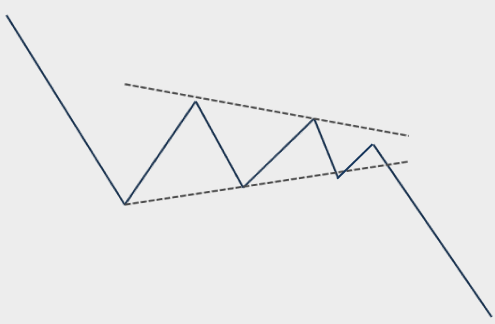
Aksel Kibar2018-07-27 05:27:232019-12-23 21:43:05Symmetrical Triangle – Bearish Continuation
https://blog.techcharts.net/wp-content/uploads/2018/07/SYMMETRICAL-TRIANGLE-BEARISH-CONTINUATION-IMAGE-II.png
324
738
Aksel Kibar
https://blog.techcharts.net/wp-content/uploads/2017/05/Tech-Charts-logo-FINAL-CLEAN-340w.png
Aksel Kibar2018-07-27 05:27:232019-12-23 21:43:05Symmetrical Triangle – Bearish Continuation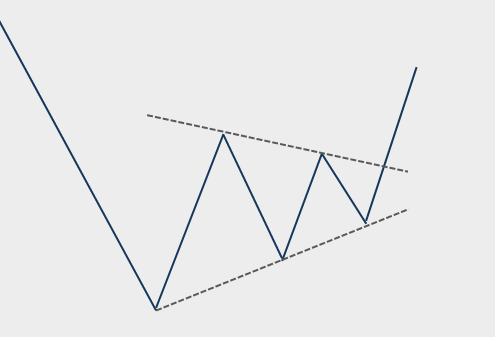 https://blog.techcharts.net/wp-content/uploads/2017/09/SYMMETRICAL-TRIANGLE-BULLISH-REVERSAL-IMAGE.png
337
762
Aksel Kibar
https://blog.techcharts.net/wp-content/uploads/2017/05/Tech-Charts-logo-FINAL-CLEAN-340w.png
Aksel Kibar2017-09-25 13:01:542019-12-23 12:50:45Symmetrical Triangle – Bullish Reversal
https://blog.techcharts.net/wp-content/uploads/2017/09/SYMMETRICAL-TRIANGLE-BULLISH-REVERSAL-IMAGE.png
337
762
Aksel Kibar
https://blog.techcharts.net/wp-content/uploads/2017/05/Tech-Charts-logo-FINAL-CLEAN-340w.png
Aksel Kibar2017-09-25 13:01:542019-12-23 12:50:45Symmetrical Triangle – Bullish Reversal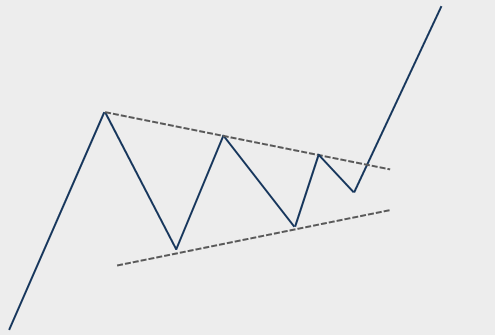 https://blog.techcharts.net/wp-content/uploads/2017/06/SYMMETRICAL-TRIANGLE-BULLISH-CONTINUATION-IMAGE.png
335
758
Aksel Kibar
https://blog.techcharts.net/wp-content/uploads/2017/05/Tech-Charts-logo-FINAL-CLEAN-340w.png
Aksel Kibar2017-06-15 19:40:502019-12-18 20:22:15Symmetrical Triangle – Bullish Continuation
https://blog.techcharts.net/wp-content/uploads/2017/06/SYMMETRICAL-TRIANGLE-BULLISH-CONTINUATION-IMAGE.png
335
758
Aksel Kibar
https://blog.techcharts.net/wp-content/uploads/2017/05/Tech-Charts-logo-FINAL-CLEAN-340w.png
Aksel Kibar2017-06-15 19:40:502019-12-18 20:22:15Symmetrical Triangle – Bullish Continuation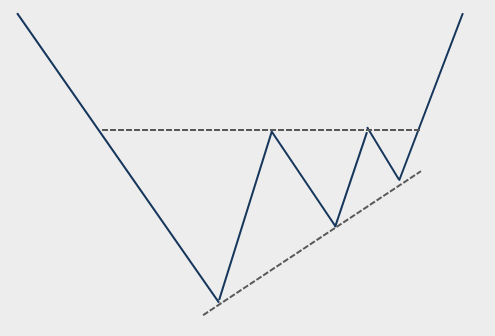 https://blog.techcharts.net/wp-content/uploads/2017/09/ASCENDING-TRIANGLE-BULLISH-REVERSAL-IMAGE.png
336
759
Aksel Kibar
https://blog.techcharts.net/wp-content/uploads/2017/05/Tech-Charts-logo-FINAL-CLEAN-340w.png
Aksel Kibar2017-09-29 15:03:022019-12-18 19:35:06Ascending Triangle – Bullish Reversal
https://blog.techcharts.net/wp-content/uploads/2017/09/ASCENDING-TRIANGLE-BULLISH-REVERSAL-IMAGE.png
336
759
Aksel Kibar
https://blog.techcharts.net/wp-content/uploads/2017/05/Tech-Charts-logo-FINAL-CLEAN-340w.png
Aksel Kibar2017-09-29 15:03:022019-12-18 19:35:06Ascending Triangle – Bullish Reversal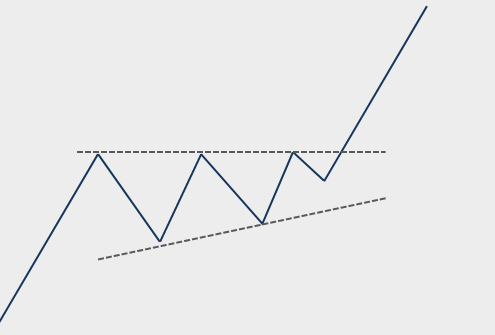 https://blog.techcharts.net/wp-content/uploads/2017/06/ASCENDING-TRIANGLE-BULLISH-CONTINUATION-IMAGE.png
335
757
Aksel Kibar
https://blog.techcharts.net/wp-content/uploads/2017/05/Tech-Charts-logo-FINAL-CLEAN-340w.png
Aksel Kibar2017-06-01 13:33:212019-12-18 19:50:51Ascending Triangle – Bullish Continuation
https://blog.techcharts.net/wp-content/uploads/2017/06/ASCENDING-TRIANGLE-BULLISH-CONTINUATION-IMAGE.png
335
757
Aksel Kibar
https://blog.techcharts.net/wp-content/uploads/2017/05/Tech-Charts-logo-FINAL-CLEAN-340w.png
Aksel Kibar2017-06-01 13:33:212019-12-18 19:50:51Ascending Triangle – Bullish Continuation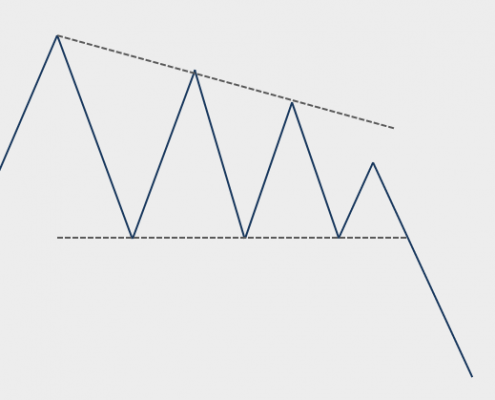 https://blog.techcharts.net/wp-content/uploads/2017/11/DESCENDING-TRIANGLE-BEARISH-REVERSAL-IMAGE.png
419
949
Aksel Kibar
https://blog.techcharts.net/wp-content/uploads/2017/05/Tech-Charts-logo-FINAL-CLEAN-340w.png
Aksel Kibar2017-11-04 10:07:042019-12-18 20:09:40Descending Triangle – Bearish Reversal
https://blog.techcharts.net/wp-content/uploads/2017/11/DESCENDING-TRIANGLE-BEARISH-REVERSAL-IMAGE.png
419
949
Aksel Kibar
https://blog.techcharts.net/wp-content/uploads/2017/05/Tech-Charts-logo-FINAL-CLEAN-340w.png
Aksel Kibar2017-11-04 10:07:042019-12-18 20:09:40Descending Triangle – Bearish Reversal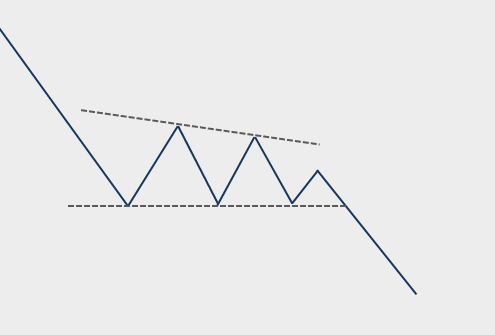 https://blog.techcharts.net/wp-content/uploads/2017/06/DESCENDING-TRIANGLE-BEARISH-CONTINUATION-IMAGE-e1510516004324.png
335
758
Aksel Kibar
https://blog.techcharts.net/wp-content/uploads/2017/05/Tech-Charts-logo-FINAL-CLEAN-340w.png
Aksel Kibar2017-06-15 19:49:492020-02-12 02:57:47Descending Triangle – Bearish Continuation
https://blog.techcharts.net/wp-content/uploads/2017/06/DESCENDING-TRIANGLE-BEARISH-CONTINUATION-IMAGE-e1510516004324.png
335
758
Aksel Kibar
https://blog.techcharts.net/wp-content/uploads/2017/05/Tech-Charts-logo-FINAL-CLEAN-340w.png
Aksel Kibar2017-06-15 19:49:492020-02-12 02:57:47Descending Triangle – Bearish Continuation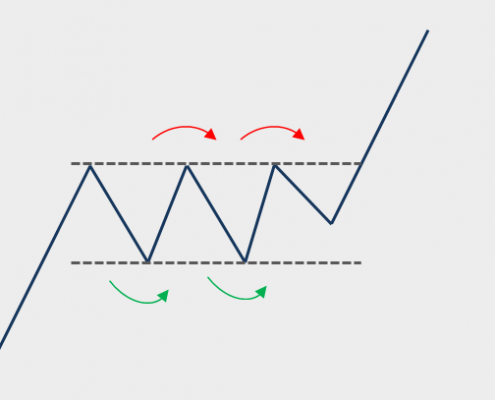 https://blog.techcharts.net/wp-content/uploads/2021/11/TRADING-RANGE-BOUND-PRICE-ACTION-1.png
407
927
Aksel Kibar
https://blog.techcharts.net/wp-content/uploads/2017/05/Tech-Charts-logo-FINAL-CLEAN-340w.png
Aksel Kibar2021-11-16 15:40:422021-11-16 15:42:24Rectangle – Trading Range-Bound Price Action
https://blog.techcharts.net/wp-content/uploads/2021/11/TRADING-RANGE-BOUND-PRICE-ACTION-1.png
407
927
Aksel Kibar
https://blog.techcharts.net/wp-content/uploads/2017/05/Tech-Charts-logo-FINAL-CLEAN-340w.png
Aksel Kibar2021-11-16 15:40:422021-11-16 15:42:24Rectangle – Trading Range-Bound Price Action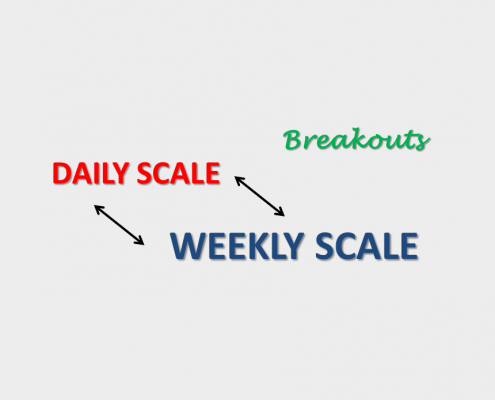 https://blog.techcharts.net/wp-content/uploads/2019/11/DAILY-WEEKLY-SCALE-BREAKOUTS-IMAGE-4.png
695
1215
Aksel Kibar
https://blog.techcharts.net/wp-content/uploads/2017/05/Tech-Charts-logo-FINAL-CLEAN-340w.png
Aksel Kibar2019-11-19 18:04:002019-11-19 18:12:34Rectangle – Daily & Weekly scale breakouts
https://blog.techcharts.net/wp-content/uploads/2019/11/DAILY-WEEKLY-SCALE-BREAKOUTS-IMAGE-4.png
695
1215
Aksel Kibar
https://blog.techcharts.net/wp-content/uploads/2017/05/Tech-Charts-logo-FINAL-CLEAN-340w.png
Aksel Kibar2019-11-19 18:04:002019-11-19 18:12:34Rectangle – Daily & Weekly scale breakouts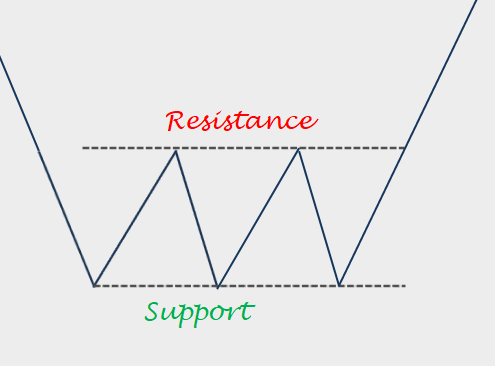 https://blog.techcharts.net/wp-content/uploads/2019/08/ODFJELL-DRILLING-2-1.png
366
834
Aksel Kibar
https://blog.techcharts.net/wp-content/uploads/2017/05/Tech-Charts-logo-FINAL-CLEAN-340w.png
Aksel Kibar2019-08-01 15:31:402019-08-01 15:35:34Rectangle – Bullish Reversal
https://blog.techcharts.net/wp-content/uploads/2019/08/ODFJELL-DRILLING-2-1.png
366
834
Aksel Kibar
https://blog.techcharts.net/wp-content/uploads/2017/05/Tech-Charts-logo-FINAL-CLEAN-340w.png
Aksel Kibar2019-08-01 15:31:402019-08-01 15:35:34Rectangle – Bullish Reversal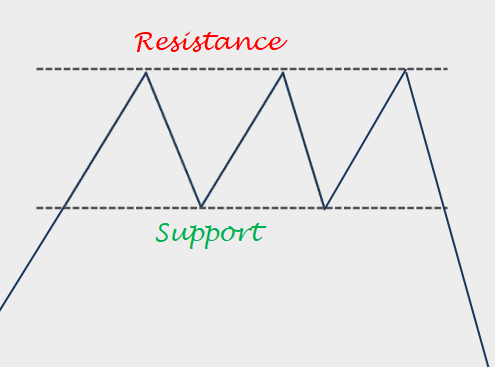 https://blog.techcharts.net/wp-content/uploads/2018/11/RECTANGLE-BEARISH-REVERSAL-2.png
367
831
Aksel Kibar
https://blog.techcharts.net/wp-content/uploads/2017/05/Tech-Charts-logo-FINAL-CLEAN-340w.png
Aksel Kibar2018-11-13 15:59:552019-11-18 21:35:28Rectangle – Bearish Reversal
https://blog.techcharts.net/wp-content/uploads/2018/11/RECTANGLE-BEARISH-REVERSAL-2.png
367
831
Aksel Kibar
https://blog.techcharts.net/wp-content/uploads/2017/05/Tech-Charts-logo-FINAL-CLEAN-340w.png
Aksel Kibar2018-11-13 15:59:552019-11-18 21:35:28Rectangle – Bearish Reversal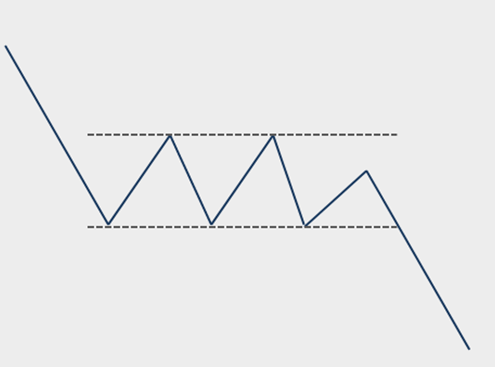 https://blog.techcharts.net/wp-content/uploads/2018/01/RECTANGLE-BEARISH-CONTINUATION-IMAGE-5-e1514976733554.png
334
758
Aksel Kibar
https://blog.techcharts.net/wp-content/uploads/2017/05/Tech-Charts-logo-FINAL-CLEAN-340w.png
Aksel Kibar2018-01-03 10:02:302020-01-02 02:20:51Rectangle – Bearish Continuation
https://blog.techcharts.net/wp-content/uploads/2018/01/RECTANGLE-BEARISH-CONTINUATION-IMAGE-5-e1514976733554.png
334
758
Aksel Kibar
https://blog.techcharts.net/wp-content/uploads/2017/05/Tech-Charts-logo-FINAL-CLEAN-340w.png
Aksel Kibar2018-01-03 10:02:302020-01-02 02:20:51Rectangle – Bearish Continuation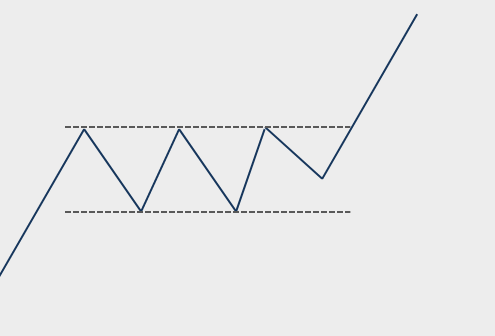 https://blog.techcharts.net/wp-content/uploads/2017/05/RECTANGLE-BULLISH-CONTINUATION-IMAGE.png
336
758
Aksel Kibar
https://blog.techcharts.net/wp-content/uploads/2017/05/Tech-Charts-logo-FINAL-CLEAN-340w.png
Aksel Kibar2017-05-25 15:56:102017-09-25 12:49:22Rectangle – Bullish Continuation
https://blog.techcharts.net/wp-content/uploads/2017/05/RECTANGLE-BULLISH-CONTINUATION-IMAGE.png
336
758
Aksel Kibar
https://blog.techcharts.net/wp-content/uploads/2017/05/Tech-Charts-logo-FINAL-CLEAN-340w.png
Aksel Kibar2017-05-25 15:56:102017-09-25 12:49:22Rectangle – Bullish Continuation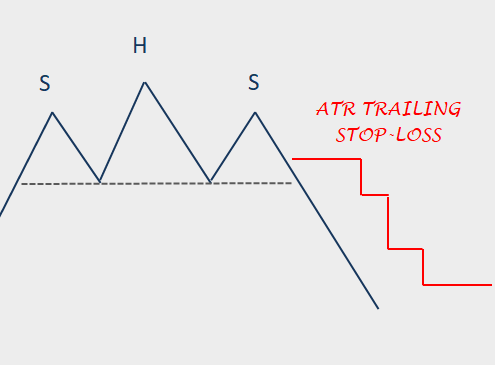 https://blog.techcharts.net/wp-content/uploads/2018/12/ATR-TRAILING-STOP-HS-TOP-2.png
365
832
Aksel Kibar
https://blog.techcharts.net/wp-content/uploads/2017/05/Tech-Charts-logo-FINAL-CLEAN-340w.png
Aksel Kibar2018-12-21 14:13:212019-11-21 14:32:15ATR Trailing Stop-Loss – H&S Top
https://blog.techcharts.net/wp-content/uploads/2018/12/ATR-TRAILING-STOP-HS-TOP-2.png
365
832
Aksel Kibar
https://blog.techcharts.net/wp-content/uploads/2017/05/Tech-Charts-logo-FINAL-CLEAN-340w.png
Aksel Kibar2018-12-21 14:13:212019-11-21 14:32:15ATR Trailing Stop-Loss – H&S Top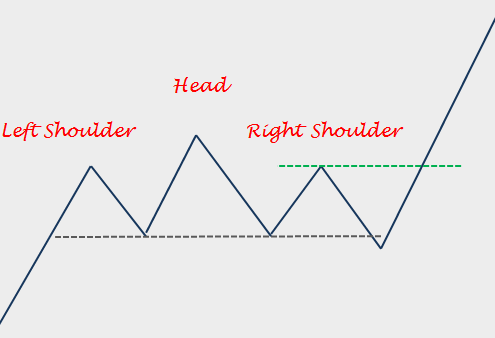 https://blog.techcharts.net/wp-content/uploads/2018/06/HS-TOP-FAILURE-IMAGE-1.png
338
770
Aksel Kibar
https://blog.techcharts.net/wp-content/uploads/2017/05/Tech-Charts-logo-FINAL-CLEAN-340w.png
Aksel Kibar2018-06-20 12:25:282019-12-27 20:41:40Head and Shoulders Top – Failure
https://blog.techcharts.net/wp-content/uploads/2018/06/HS-TOP-FAILURE-IMAGE-1.png
338
770
Aksel Kibar
https://blog.techcharts.net/wp-content/uploads/2017/05/Tech-Charts-logo-FINAL-CLEAN-340w.png
Aksel Kibar2018-06-20 12:25:282019-12-27 20:41:40Head and Shoulders Top – Failure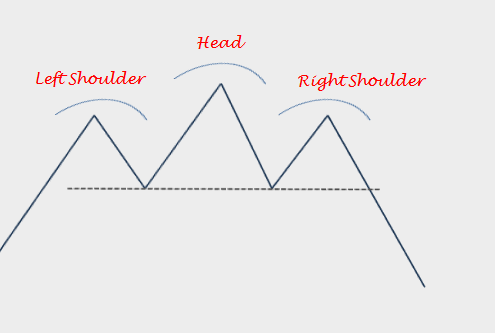 https://blog.techcharts.net/wp-content/uploads/2017/05/HS-TOP-BEARISH-REVERSAL-IMAGE.png
333
757
Aksel Kibar
https://blog.techcharts.net/wp-content/uploads/2017/05/Tech-Charts-logo-FINAL-CLEAN-340w.png
Aksel Kibar2017-05-31 14:14:502020-01-02 02:38:05Head and Shoulders Top – Bearish Reversal
https://blog.techcharts.net/wp-content/uploads/2017/05/HS-TOP-BEARISH-REVERSAL-IMAGE.png
333
757
Aksel Kibar
https://blog.techcharts.net/wp-content/uploads/2017/05/Tech-Charts-logo-FINAL-CLEAN-340w.png
Aksel Kibar2017-05-31 14:14:502020-01-02 02:38:05Head and Shoulders Top – Bearish Reversal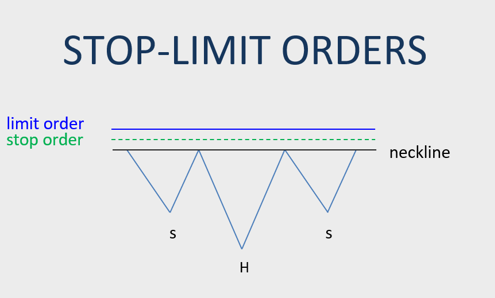 https://blog.techcharts.net/wp-content/uploads/2023/03/STOP-LIMIT-ORDERS-AND-EARLY-ENTRY-IMAGE.png
298
687
Aksel Kibar
https://blog.techcharts.net/wp-content/uploads/2017/05/Tech-Charts-logo-FINAL-CLEAN-340w.png
Aksel Kibar2023-03-01 17:03:002023-03-01 17:03:00Stop-limit order and early entry
https://blog.techcharts.net/wp-content/uploads/2023/03/STOP-LIMIT-ORDERS-AND-EARLY-ENTRY-IMAGE.png
298
687
Aksel Kibar
https://blog.techcharts.net/wp-content/uploads/2017/05/Tech-Charts-logo-FINAL-CLEAN-340w.png
Aksel Kibar2023-03-01 17:03:002023-03-01 17:03:00Stop-limit order and early entry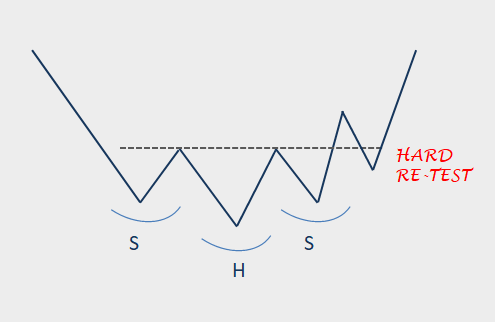 https://blog.techcharts.net/wp-content/uploads/2020/10/HS-BOTTOM-HARD-RETEST-1-1.png
322
735
Aksel Kibar
https://blog.techcharts.net/wp-content/uploads/2017/05/Tech-Charts-logo-FINAL-CLEAN-340w.png
Aksel Kibar2020-10-04 19:18:012023-03-01 16:53:08H&S Bottom Reversal with a Hard Re-Test
https://blog.techcharts.net/wp-content/uploads/2020/10/HS-BOTTOM-HARD-RETEST-1-1.png
322
735
Aksel Kibar
https://blog.techcharts.net/wp-content/uploads/2017/05/Tech-Charts-logo-FINAL-CLEAN-340w.png
Aksel Kibar2020-10-04 19:18:012023-03-01 16:53:08H&S Bottom Reversal with a Hard Re-Test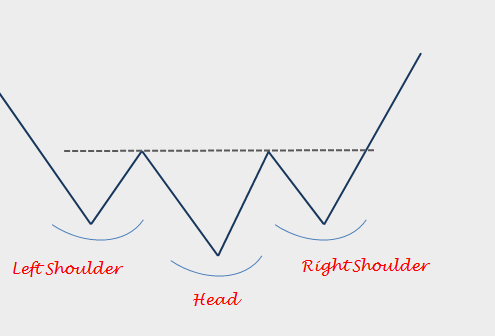 https://blog.techcharts.net/wp-content/uploads/2017/06/HS-BOTTOM-IMAGE.png
336
760
Aksel Kibar
https://blog.techcharts.net/wp-content/uploads/2017/05/Tech-Charts-logo-FINAL-CLEAN-340w.png
Aksel Kibar2017-06-01 13:43:312020-01-02 02:48:13Head and Shoulders Bottom – Bullish Reversal
https://blog.techcharts.net/wp-content/uploads/2017/06/HS-BOTTOM-IMAGE.png
336
760
Aksel Kibar
https://blog.techcharts.net/wp-content/uploads/2017/05/Tech-Charts-logo-FINAL-CLEAN-340w.png
Aksel Kibar2017-06-01 13:43:312020-01-02 02:48:13Head and Shoulders Bottom – Bullish Reversal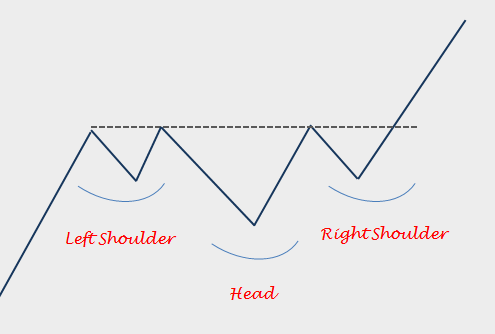 https://blog.techcharts.net/wp-content/uploads/2017/06/HS-BULLISH-CONTINUATION-IMAGE.png
334
757
Aksel Kibar
https://blog.techcharts.net/wp-content/uploads/2017/05/Tech-Charts-logo-FINAL-CLEAN-340w.png
Aksel Kibar2017-06-15 20:06:082020-01-02 03:00:35Head and Shoulders – Bullish Continuation
https://blog.techcharts.net/wp-content/uploads/2017/06/HS-BULLISH-CONTINUATION-IMAGE.png
334
757
Aksel Kibar
https://blog.techcharts.net/wp-content/uploads/2017/05/Tech-Charts-logo-FINAL-CLEAN-340w.png
Aksel Kibar2017-06-15 20:06:082020-01-02 03:00:35Head and Shoulders – Bullish Continuation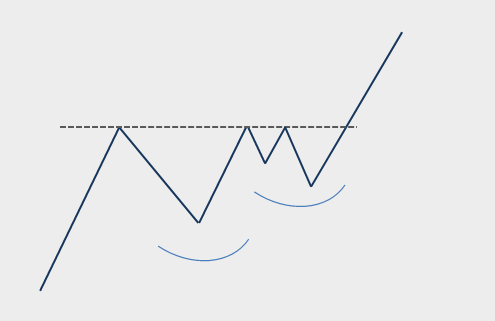 https://blog.techcharts.net/wp-content/uploads/2021/01/MORPHOLOGY-CUP-HANDLE-CONT-IMAGE.png
321
737
Aksel Kibar
https://blog.techcharts.net/wp-content/uploads/2017/05/Tech-Charts-logo-FINAL-CLEAN-340w.png
Aksel Kibar2021-01-15 05:36:072021-01-15 05:36:07Morphology and Cup & Handle continuation
https://blog.techcharts.net/wp-content/uploads/2021/01/MORPHOLOGY-CUP-HANDLE-CONT-IMAGE.png
321
737
Aksel Kibar
https://blog.techcharts.net/wp-content/uploads/2017/05/Tech-Charts-logo-FINAL-CLEAN-340w.png
Aksel Kibar2021-01-15 05:36:072021-01-15 05:36:07Morphology and Cup & Handle continuation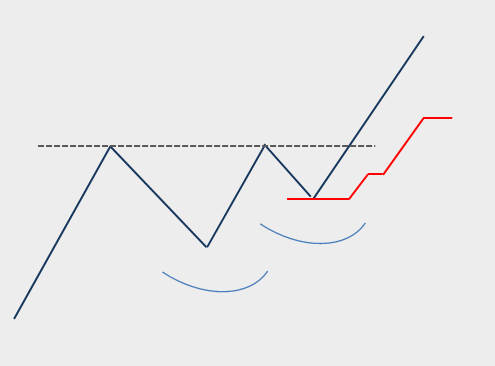 https://blog.techcharts.net/wp-content/uploads/2020/04/CUP-HANDLE-AND-TRAILING-STOP-LOSS-IMAGE-1.png
366
833
Aksel Kibar
https://blog.techcharts.net/wp-content/uploads/2017/05/Tech-Charts-logo-FINAL-CLEAN-340w.png
Aksel Kibar2020-04-28 04:46:412020-04-28 05:03:34Breakout with a pullback – Application of ATR trailing stop-loss
https://blog.techcharts.net/wp-content/uploads/2020/04/CUP-HANDLE-AND-TRAILING-STOP-LOSS-IMAGE-1.png
366
833
Aksel Kibar
https://blog.techcharts.net/wp-content/uploads/2017/05/Tech-Charts-logo-FINAL-CLEAN-340w.png
Aksel Kibar2020-04-28 04:46:412020-04-28 05:03:34Breakout with a pullback – Application of ATR trailing stop-loss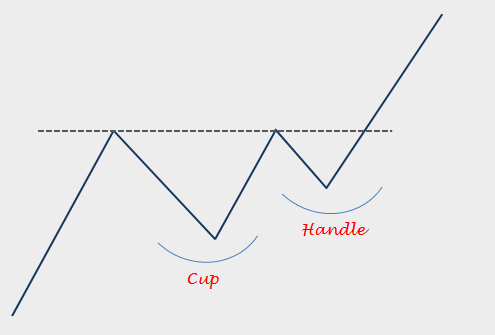 https://blog.techcharts.net/wp-content/uploads/2017/05/CUP-HANDLE-BULLISH-CONTINUATION.png
335
757
Aksel Kibar
https://blog.techcharts.net/wp-content/uploads/2017/05/Tech-Charts-logo-FINAL-CLEAN-340w.png
Aksel Kibar2017-05-25 15:40:572017-10-12 14:07:31Cup and Handle – Bullish Continuation
https://blog.techcharts.net/wp-content/uploads/2017/05/CUP-HANDLE-BULLISH-CONTINUATION.png
335
757
Aksel Kibar
https://blog.techcharts.net/wp-content/uploads/2017/05/Tech-Charts-logo-FINAL-CLEAN-340w.png
Aksel Kibar2017-05-25 15:40:572017-10-12 14:07:31Cup and Handle – Bullish Continuation https://blog.techcharts.net/wp-content/uploads/2026/03/Screenshot-2026-03-26-at-2.18.05-PM.png
1202
2144
Aksel Kibar
https://blog.techcharts.net/wp-content/uploads/2017/05/Tech-Charts-logo-FINAL-CLEAN-340w.png
Aksel Kibar2026-03-26 19:31:152026-03-26 19:31:15Review of 2026 1st Quarter Pattern Reliability – March 2026 Tech Charts Member Webinar
https://blog.techcharts.net/wp-content/uploads/2026/03/Screenshot-2026-03-26-at-2.18.05-PM.png
1202
2144
Aksel Kibar
https://blog.techcharts.net/wp-content/uploads/2017/05/Tech-Charts-logo-FINAL-CLEAN-340w.png
Aksel Kibar2026-03-26 19:31:152026-03-26 19:31:15Review of 2026 1st Quarter Pattern Reliability – March 2026 Tech Charts Member Webinar https://blog.techcharts.net/wp-content/uploads/2025/03/BREAKOUT-ROOMS.png
558
1146
Aksel Kibar
https://blog.techcharts.net/wp-content/uploads/2017/05/Tech-Charts-logo-FINAL-CLEAN-340w.png
Aksel Kibar2026-02-04 14:38:062026-02-04 14:44:12BREAKOUT ROOM February 1, 2026 – LIVE MEETING, CHARTS Q&A (Recording)
https://blog.techcharts.net/wp-content/uploads/2025/03/BREAKOUT-ROOMS.png
558
1146
Aksel Kibar
https://blog.techcharts.net/wp-content/uploads/2017/05/Tech-Charts-logo-FINAL-CLEAN-340w.png
Aksel Kibar2026-02-04 14:38:062026-02-04 14:44:12BREAKOUT ROOM February 1, 2026 – LIVE MEETING, CHARTS Q&A (Recording) https://blog.techcharts.net/wp-content/uploads/2025/12/Intro.png
744
1324
Aksel Kibar
https://blog.techcharts.net/wp-content/uploads/2017/05/Tech-Charts-logo-FINAL-CLEAN-340w.png
Aksel Kibar2025-12-19 09:58:162025-12-19 09:58:16Review of YTD and 8 Year Pattern Reliability and a Deep Dive into Rectangles – December 2025 Tech Charts Member Webinar
https://blog.techcharts.net/wp-content/uploads/2025/03/BREAKOUT-ROOMS.png
558
1146
Aksel Kibar
https://blog.techcharts.net/wp-content/uploads/2017/05/Tech-Charts-logo-FINAL-CLEAN-340w.png
Aksel Kibar2025-11-24 17:07:402025-11-24 17:07:40BREAKOUT ROOM November 22, 2025 – LIVE MEETING, CHARTS Q&A (Recording)
https://blog.techcharts.net/wp-content/uploads/2025/12/Intro.png
744
1324
Aksel Kibar
https://blog.techcharts.net/wp-content/uploads/2017/05/Tech-Charts-logo-FINAL-CLEAN-340w.png
Aksel Kibar2025-12-19 09:58:162025-12-19 09:58:16Review of YTD and 8 Year Pattern Reliability and a Deep Dive into Rectangles – December 2025 Tech Charts Member Webinar
https://blog.techcharts.net/wp-content/uploads/2025/03/BREAKOUT-ROOMS.png
558
1146
Aksel Kibar
https://blog.techcharts.net/wp-content/uploads/2017/05/Tech-Charts-logo-FINAL-CLEAN-340w.png
Aksel Kibar2025-11-24 17:07:402025-11-24 17:07:40BREAKOUT ROOM November 22, 2025 – LIVE MEETING, CHARTS Q&A (Recording) https://blog.techcharts.net/wp-content/uploads/2025/09/First.png
1196
2130
Aksel Kibar
https://blog.techcharts.net/wp-content/uploads/2017/05/Tech-Charts-logo-FINAL-CLEAN-340w.png
Aksel Kibar2025-09-26 16:30:532025-09-26 16:30:53Chart pattern reliability YTD and ATR Trailing Stops – September 2025 Tech Charts Member Webinar
https://blog.techcharts.net/wp-content/uploads/2025/03/BREAKOUT-ROOMS.png
558
1146
Aksel Kibar
https://blog.techcharts.net/wp-content/uploads/2017/05/Tech-Charts-logo-FINAL-CLEAN-340w.png
Aksel Kibar2025-09-11 05:57:052025-09-11 05:57:05BREAKOUT ROOM September 8, 2025 – LIVE MEETING, CHARTS Q&A (Recording)
https://blog.techcharts.net/wp-content/uploads/2025/03/BREAKOUT-ROOMS.png
558
1146
Aksel Kibar
https://blog.techcharts.net/wp-content/uploads/2017/05/Tech-Charts-logo-FINAL-CLEAN-340w.png
Aksel Kibar2025-07-10 14:24:342025-07-10 14:31:47BREAKOUT ROOM July 8, 2025 – LIVE MEETING, CHARTS Q&A (Recording)
https://blog.techcharts.net/wp-content/uploads/2025/09/First.png
1196
2130
Aksel Kibar
https://blog.techcharts.net/wp-content/uploads/2017/05/Tech-Charts-logo-FINAL-CLEAN-340w.png
Aksel Kibar2025-09-26 16:30:532025-09-26 16:30:53Chart pattern reliability YTD and ATR Trailing Stops – September 2025 Tech Charts Member Webinar
https://blog.techcharts.net/wp-content/uploads/2025/03/BREAKOUT-ROOMS.png
558
1146
Aksel Kibar
https://blog.techcharts.net/wp-content/uploads/2017/05/Tech-Charts-logo-FINAL-CLEAN-340w.png
Aksel Kibar2025-09-11 05:57:052025-09-11 05:57:05BREAKOUT ROOM September 8, 2025 – LIVE MEETING, CHARTS Q&A (Recording)
https://blog.techcharts.net/wp-content/uploads/2025/03/BREAKOUT-ROOMS.png
558
1146
Aksel Kibar
https://blog.techcharts.net/wp-content/uploads/2017/05/Tech-Charts-logo-FINAL-CLEAN-340w.png
Aksel Kibar2025-07-10 14:24:342025-07-10 14:31:47BREAKOUT ROOM July 8, 2025 – LIVE MEETING, CHARTS Q&A (Recording) https://blog.techcharts.net/wp-content/uploads/2018/05/Year-in-Review-.jpg
426
640
Aksel Kibar
https://blog.techcharts.net/wp-content/uploads/2017/05/Tech-Charts-logo-FINAL-CLEAN-340w.png
Aksel Kibar2025-06-02 20:21:252025-06-02 20:21:25Tech Charts Year in Review – Year Eight, May 2025 Webinar
https://blog.techcharts.net/wp-content/uploads/2025/03/BREAKOUT-ROOMS.png
558
1146
Aksel Kibar
https://blog.techcharts.net/wp-content/uploads/2017/05/Tech-Charts-logo-FINAL-CLEAN-340w.png
Aksel Kibar2025-05-02 12:57:072025-05-02 12:57:07BREAKOUT ROOM April 30, 2025 – LIVE MEETING, CHARTS Q&A (Recording)
https://blog.techcharts.net/wp-content/uploads/2018/05/Year-in-Review-.jpg
426
640
Aksel Kibar
https://blog.techcharts.net/wp-content/uploads/2017/05/Tech-Charts-logo-FINAL-CLEAN-340w.png
Aksel Kibar2025-06-02 20:21:252025-06-02 20:21:25Tech Charts Year in Review – Year Eight, May 2025 Webinar
https://blog.techcharts.net/wp-content/uploads/2025/03/BREAKOUT-ROOMS.png
558
1146
Aksel Kibar
https://blog.techcharts.net/wp-content/uploads/2017/05/Tech-Charts-logo-FINAL-CLEAN-340w.png
Aksel Kibar2025-05-02 12:57:072025-05-02 12:57:07BREAKOUT ROOM April 30, 2025 – LIVE MEETING, CHARTS Q&A (Recording) https://blog.techcharts.net/wp-content/uploads/2025/03/Screenshot-2025-03-20-at-2.20.41 PM.png
1236
2198
Aksel Kibar
https://blog.techcharts.net/wp-content/uploads/2017/05/Tech-Charts-logo-FINAL-CLEAN-340w.png
Aksel Kibar2025-03-24 08:35:272025-03-24 08:35:27Quarterly Review of Chart Pattern Reliability Numbers and Review of Global Markets – March 2025 Tech Charts Member Webinar
https://blog.techcharts.net/wp-content/uploads/2025/03/BREAKOUT-ROOMS.png
558
1146
Aksel Kibar
https://blog.techcharts.net/wp-content/uploads/2017/05/Tech-Charts-logo-FINAL-CLEAN-340w.png
Aksel Kibar2025-03-12 13:01:412025-03-12 13:01:41BREAKOUT ROOM March 10, 2025 – LIVE MEETING, CHARTS Q&A (Recording)
https://blog.techcharts.net/wp-content/uploads/2025/03/Screenshot-2025-03-20-at-2.20.41 PM.png
1236
2198
Aksel Kibar
https://blog.techcharts.net/wp-content/uploads/2017/05/Tech-Charts-logo-FINAL-CLEAN-340w.png
Aksel Kibar2025-03-24 08:35:272025-03-24 08:35:27Quarterly Review of Chart Pattern Reliability Numbers and Review of Global Markets – March 2025 Tech Charts Member Webinar
https://blog.techcharts.net/wp-content/uploads/2025/03/BREAKOUT-ROOMS.png
558
1146
Aksel Kibar
https://blog.techcharts.net/wp-content/uploads/2017/05/Tech-Charts-logo-FINAL-CLEAN-340w.png
Aksel Kibar2025-03-12 13:01:412025-03-12 13:01:41BREAKOUT ROOM March 10, 2025 – LIVE MEETING, CHARTS Q&A (Recording) https://blog.techcharts.net/wp-content/uploads/2024/12/Cover.png
1546
2760
Aksel Kibar
https://blog.techcharts.net/wp-content/uploads/2017/05/Tech-Charts-logo-FINAL-CLEAN-340w.png
Aksel Kibar2024-12-13 06:07:032024-12-13 19:08:15YTD 2024 review with a focus on H&S continuation and Rectangles December – December 2024 Tech Charts Member Webinar
https://blog.techcharts.net/wp-content/uploads/2024/12/Cover.png
1546
2760
Aksel Kibar
https://blog.techcharts.net/wp-content/uploads/2017/05/Tech-Charts-logo-FINAL-CLEAN-340w.png
Aksel Kibar2024-12-13 06:07:032024-12-13 19:08:15YTD 2024 review with a focus on H&S continuation and Rectangles December – December 2024 Tech Charts Member Webinar https://blog.techcharts.net/wp-content/uploads/2024/09/Screenshot-2024-09-11-at-2.53.55 PM.png
958
1714
Aksel Kibar
https://blog.techcharts.net/wp-content/uploads/2017/05/Tech-Charts-logo-FINAL-CLEAN-340w.png
Aksel Kibar2024-09-12 09:28:352024-09-12 09:28:35Review of 3rd Quarter 2024 Chart Pattern Reliability Numbers – September 2024 Tech Charts Member Webinar
https://blog.techcharts.net/wp-content/uploads/2018/05/Year-in-Review-.jpg
426
640
Aksel Kibar
https://blog.techcharts.net/wp-content/uploads/2017/05/Tech-Charts-logo-FINAL-CLEAN-340w.png
Aksel Kibar2024-05-20 19:12:212024-05-20 19:12:21Tech Charts Year in Review – Year Seven, May 2024 Webinar
https://blog.techcharts.net/wp-content/uploads/2024/09/Screenshot-2024-09-11-at-2.53.55 PM.png
958
1714
Aksel Kibar
https://blog.techcharts.net/wp-content/uploads/2017/05/Tech-Charts-logo-FINAL-CLEAN-340w.png
Aksel Kibar2024-09-12 09:28:352024-09-12 09:28:35Review of 3rd Quarter 2024 Chart Pattern Reliability Numbers – September 2024 Tech Charts Member Webinar
https://blog.techcharts.net/wp-content/uploads/2018/05/Year-in-Review-.jpg
426
640
Aksel Kibar
https://blog.techcharts.net/wp-content/uploads/2017/05/Tech-Charts-logo-FINAL-CLEAN-340w.png
Aksel Kibar2024-05-20 19:12:212024-05-20 19:12:21Tech Charts Year in Review – Year Seven, May 2024 Webinar https://blog.techcharts.net/wp-content/uploads/2024/03/Screenshot-2024-03-25-at-1.51.31 PM.png
1186
2120
Aksel Kibar
https://blog.techcharts.net/wp-content/uploads/2017/05/Tech-Charts-logo-FINAL-CLEAN-340w.png
Aksel Kibar2024-03-26 14:14:442024-03-26 14:14:44Review of Chart Pattern Reliability Stats for 2023 and YTD 2024 – March 2024 Tech Charts Member Webinar
https://blog.techcharts.net/wp-content/uploads/2024/03/Screenshot-2024-03-25-at-1.51.31 PM.png
1186
2120
Aksel Kibar
https://blog.techcharts.net/wp-content/uploads/2017/05/Tech-Charts-logo-FINAL-CLEAN-340w.png
Aksel Kibar2024-03-26 14:14:442024-03-26 14:14:44Review of Chart Pattern Reliability Stats for 2023 and YTD 2024 – March 2024 Tech Charts Member Webinar https://blog.techcharts.net/wp-content/uploads/2023/12/Opening.png
1466
2614
Aksel Kibar
https://blog.techcharts.net/wp-content/uploads/2017/05/Tech-Charts-logo-FINAL-CLEAN-340w.png
Aksel Kibar2023-12-18 12:47:172023-12-18 12:47:17Review of Risk/Reward in Type 1 and Type 2 Breakouts – December 2023 Tech Charts Member Webinar
https://blog.techcharts.net/wp-content/uploads/2023/12/Opening.png
1466
2614
Aksel Kibar
https://blog.techcharts.net/wp-content/uploads/2017/05/Tech-Charts-logo-FINAL-CLEAN-340w.png
Aksel Kibar2023-12-18 12:47:172023-12-18 12:47:17Review of Risk/Reward in Type 1 and Type 2 Breakouts – December 2023 Tech Charts Member Webinar https://blog.techcharts.net/wp-content/uploads/2023/09/Screen-Shot-2023-09-23-at-9.27.53-AM.png
1462
2618
Aksel Kibar
https://blog.techcharts.net/wp-content/uploads/2017/05/Tech-Charts-logo-FINAL-CLEAN-340w.png
Aksel Kibar2023-09-24 10:45:042023-09-24 10:45:04Is Classical Charting Still Valid? – September 2023 Tech Charts & Factor Webinar
https://blog.techcharts.net/wp-content/uploads/2018/05/Year-in-Review-.jpg
426
640
Aksel Kibar
https://blog.techcharts.net/wp-content/uploads/2017/05/Tech-Charts-logo-FINAL-CLEAN-340w.png
Aksel Kibar2023-05-28 07:16:552023-05-28 07:16:55Tech Charts Year in Review – Year Six, May 2023 Webinar
https://blog.techcharts.net/wp-content/uploads/2023/09/Screen-Shot-2023-09-23-at-9.27.53-AM.png
1462
2618
Aksel Kibar
https://blog.techcharts.net/wp-content/uploads/2017/05/Tech-Charts-logo-FINAL-CLEAN-340w.png
Aksel Kibar2023-09-24 10:45:042023-09-24 10:45:04Is Classical Charting Still Valid? – September 2023 Tech Charts & Factor Webinar
https://blog.techcharts.net/wp-content/uploads/2018/05/Year-in-Review-.jpg
426
640
Aksel Kibar
https://blog.techcharts.net/wp-content/uploads/2017/05/Tech-Charts-logo-FINAL-CLEAN-340w.png
Aksel Kibar2023-05-28 07:16:552023-05-28 07:16:55Tech Charts Year in Review – Year Six, May 2023 Webinar https://blog.techcharts.net/wp-content/uploads/2018/03/Mar-19-Featured-Image.png
644
962
Aksel Kibar
https://blog.techcharts.net/wp-content/uploads/2017/05/Tech-Charts-logo-FINAL-CLEAN-340w.png
Aksel Kibar2023-04-03 19:06:442023-04-03 19:08:11How To Utilize Support & Resistance in Different Trade Setups – March 2023 Tech Charts Webinar
https://blog.techcharts.net/wp-content/uploads/2018/03/Mar-19-Featured-Image.png
644
962
Aksel Kibar
https://blog.techcharts.net/wp-content/uploads/2017/05/Tech-Charts-logo-FINAL-CLEAN-340w.png
Aksel Kibar2022-12-20 15:16:532022-12-20 15:16:53Review of Chart Pattern Reliability Statistics – December 2022 Tech Charts Webinar
https://blog.techcharts.net/wp-content/uploads/2018/03/Mar-19-Featured-Image.png
644
962
Aksel Kibar
https://blog.techcharts.net/wp-content/uploads/2017/05/Tech-Charts-logo-FINAL-CLEAN-340w.png
Aksel Kibar2022-09-26 17:27:412022-09-26 17:27:58Review of Chart Pattern Reliability Statistics and Opportunities in Global Markets – September 2022 Tech Charts Webinar
https://blog.techcharts.net/wp-content/uploads/2018/05/Year-in-Review-.jpg
426
640
Aksel Kibar
https://blog.techcharts.net/wp-content/uploads/2017/05/Tech-Charts-logo-FINAL-CLEAN-340w.png
Aksel Kibar2022-05-23 12:47:452022-05-23 12:47:45Tech Charts Year in Review – Year Five, May 2022 Webinar
https://blog.techcharts.net/wp-content/uploads/2018/03/Mar-19-Featured-Image.png
644
962
Aksel Kibar
https://blog.techcharts.net/wp-content/uploads/2017/05/Tech-Charts-logo-FINAL-CLEAN-340w.png
Aksel Kibar2022-04-02 07:03:222022-04-02 07:09:21Chart Pattern Reliability & Review of Current Market Opportunities – March 2022 Tech Charts Webinar
https://blog.techcharts.net/wp-content/uploads/2018/03/Mar-19-Featured-Image.png
644
962
Aksel Kibar
https://blog.techcharts.net/wp-content/uploads/2017/05/Tech-Charts-logo-FINAL-CLEAN-340w.png
Aksel Kibar2021-12-19 14:05:322021-12-19 14:05:32Two Different Strategies for Trading Classical Chart Patterns – December 2021 Tech Charts Webinar
https://blog.techcharts.net/wp-content/uploads/2018/03/Mar-19-Featured-Image.png
644
962
Aksel Kibar
https://blog.techcharts.net/wp-content/uploads/2017/05/Tech-Charts-logo-FINAL-CLEAN-340w.png
Aksel Kibar2021-09-06 14:55:062021-09-06 20:14:51Chart Pattern Reliability & Statistics – September 2021 Tech Charts Webinar
https://blog.techcharts.net/wp-content/uploads/2018/05/Year-in-Review-.jpg
426
640
Aksel Kibar
https://blog.techcharts.net/wp-content/uploads/2017/05/Tech-Charts-logo-FINAL-CLEAN-340w.png
Aksel Kibar2021-05-22 11:08:282021-05-22 11:08:28Tech Charts Year in Review with Aksel – May 2021
https://blog.techcharts.net/wp-content/uploads/2018/03/Mar-19-Featured-Image.png
644
962
Aksel Kibar
https://blog.techcharts.net/wp-content/uploads/2017/05/Tech-Charts-logo-FINAL-CLEAN-340w.png
Aksel Kibar2021-03-18 07:22:102021-03-18 07:22:104 Types of Breakouts and How To Trade Them – March 2021 Tech Charts Webinar
https://blog.techcharts.net/wp-content/uploads/2018/03/Mar-19-Featured-Image.png
644
962
Aksel Kibar
https://blog.techcharts.net/wp-content/uploads/2017/05/Tech-Charts-logo-FINAL-CLEAN-340w.png
Aksel Kibar2020-12-05 18:09:052020-12-05 18:11:12Chart Pattern Statistics, H&S continuation and H&S failures – December 2020 Tech Charts Webinar
https://blog.techcharts.net/wp-content/uploads/2018/03/Mar-19-Featured-Image.png
644
962
Aksel Kibar
https://blog.techcharts.net/wp-content/uploads/2017/05/Tech-Charts-logo-FINAL-CLEAN-340w.png
Aksel Kibar2020-09-11 04:56:522020-09-11 04:56:52Re-entry, Volatility & ATR based stop-loss – September 2020 Tech Charts Webinar
https://blog.techcharts.net/wp-content/uploads/2018/05/Year-in-Review-.jpg
426
640
Aksel Kibar
https://blog.techcharts.net/wp-content/uploads/2017/05/Tech-Charts-logo-FINAL-CLEAN-340w.png
Aksel Kibar2020-05-27 06:19:552020-05-27 06:19:55Tech Charts Year in Review with Aksel – May 2020
https://blog.techcharts.net/wp-content/uploads/2018/03/Mar-19-Featured-Image.png
644
962
Aksel Kibar
https://blog.techcharts.net/wp-content/uploads/2017/05/Tech-Charts-logo-FINAL-CLEAN-340w.png
Aksel Kibar2020-03-30 16:09:302020-03-30 16:20:494 Types of Breakouts – March 2020 Tech Charts Webinar
https://blog.techcharts.net/wp-content/uploads/2018/03/Mar-19-Featured-Image.png
644
962
Aksel Kibar
https://blog.techcharts.net/wp-content/uploads/2017/05/Tech-Charts-logo-FINAL-CLEAN-340w.png
Aksel Kibar2019-12-19 06:07:042019-12-19 06:07:04Short-Term Chart Patterns – December 2019 Tech Charts Webinar
https://blog.techcharts.net/wp-content/uploads/2018/03/Mar-19-Featured-Image.png
644
962
Aksel Kibar
https://blog.techcharts.net/wp-content/uploads/2017/05/Tech-Charts-logo-FINAL-CLEAN-340w.png
Aksel Kibar2019-09-24 15:06:482019-09-24 15:06:48A review of the most reliable chart patterns Tech Charts Global Equity Markets report featured over the past two years – September 2019 Tech Charts Webinar
https://blog.techcharts.net/wp-content/uploads/2018/03/Mar-19-Featured-Image.png
644
962
Aksel Kibar
https://blog.techcharts.net/wp-content/uploads/2017/05/Tech-Charts-logo-FINAL-CLEAN-340w.png
Aksel Kibar2019-04-27 05:53:262019-04-27 05:53:26Inverse Head & Shoulder and Head & Shoulder Continuation – April 2019 Tech Charts Webinar
https://blog.techcharts.net/wp-content/uploads/2018/03/Mar-19-Featured-Image.png
644
962
Aksel Kibar
https://blog.techcharts.net/wp-content/uploads/2017/05/Tech-Charts-logo-FINAL-CLEAN-340w.png
Aksel Kibar2019-01-17 19:19:402019-04-04 19:10:06Reversal Chart Patterns – January 2019 Tech Charts Webinar
https://blog.techcharts.net/wp-content/uploads/2018/03/Mar-19-Featured-Image.png
644
962
Aksel Kibar
https://blog.techcharts.net/wp-content/uploads/2017/05/Tech-Charts-logo-FINAL-CLEAN-340w.png
Aksel Kibar2018-10-02 14:38:152020-01-14 12:25:59Symmetrical Triangle Chart Patterns – September 2018 Tech Charts Webinar
https://blog.techcharts.net/wp-content/uploads/2018/05/Year-in-Review-.jpg
426
640
Aksel Kibar
https://blog.techcharts.net/wp-content/uploads/2017/05/Tech-Charts-logo-FINAL-CLEAN-340w.png
Aksel Kibar2018-05-24 14:46:382019-04-04 19:09:21Tech Charts Year in Review – Year One
https://blog.techcharts.net/wp-content/uploads/2018/03/Mar-19-Featured-Image.png
644
962
Jolleen Oleson
https://blog.techcharts.net/wp-content/uploads/2017/05/Tech-Charts-logo-FINAL-CLEAN-340w.png
Jolleen Oleson2018-03-19 07:12:272020-01-14 12:59:10Ascending Triangle Chart Patterns – March 2018 Tech Charts Webinar
https://blog.techcharts.net/wp-content/uploads/2018/03/Mar-19-Featured-Image.png
644
962
Jolleen Oleson
https://blog.techcharts.net/wp-content/uploads/2017/05/Tech-Charts-logo-FINAL-CLEAN-340w.png
Jolleen Oleson2017-12-22 07:59:492020-01-14 14:47:22Rectangle Chart Patterns – December 2017 Tech Charts Webinar
https://blog.techcharts.net/wp-content/uploads/2018/03/Mar-19-Featured-Image.png
644
962
Aksel Kibar
https://blog.techcharts.net/wp-content/uploads/2017/05/Tech-Charts-logo-FINAL-CLEAN-340w.png
Aksel Kibar2023-04-03 19:06:442023-04-03 19:08:11How To Utilize Support & Resistance in Different Trade Setups – March 2023 Tech Charts Webinar
https://blog.techcharts.net/wp-content/uploads/2018/03/Mar-19-Featured-Image.png
644
962
Aksel Kibar
https://blog.techcharts.net/wp-content/uploads/2017/05/Tech-Charts-logo-FINAL-CLEAN-340w.png
Aksel Kibar2022-12-20 15:16:532022-12-20 15:16:53Review of Chart Pattern Reliability Statistics – December 2022 Tech Charts Webinar
https://blog.techcharts.net/wp-content/uploads/2018/03/Mar-19-Featured-Image.png
644
962
Aksel Kibar
https://blog.techcharts.net/wp-content/uploads/2017/05/Tech-Charts-logo-FINAL-CLEAN-340w.png
Aksel Kibar2022-09-26 17:27:412022-09-26 17:27:58Review of Chart Pattern Reliability Statistics and Opportunities in Global Markets – September 2022 Tech Charts Webinar
https://blog.techcharts.net/wp-content/uploads/2018/05/Year-in-Review-.jpg
426
640
Aksel Kibar
https://blog.techcharts.net/wp-content/uploads/2017/05/Tech-Charts-logo-FINAL-CLEAN-340w.png
Aksel Kibar2022-05-23 12:47:452022-05-23 12:47:45Tech Charts Year in Review – Year Five, May 2022 Webinar
https://blog.techcharts.net/wp-content/uploads/2018/03/Mar-19-Featured-Image.png
644
962
Aksel Kibar
https://blog.techcharts.net/wp-content/uploads/2017/05/Tech-Charts-logo-FINAL-CLEAN-340w.png
Aksel Kibar2022-04-02 07:03:222022-04-02 07:09:21Chart Pattern Reliability & Review of Current Market Opportunities – March 2022 Tech Charts Webinar
https://blog.techcharts.net/wp-content/uploads/2018/03/Mar-19-Featured-Image.png
644
962
Aksel Kibar
https://blog.techcharts.net/wp-content/uploads/2017/05/Tech-Charts-logo-FINAL-CLEAN-340w.png
Aksel Kibar2021-12-19 14:05:322021-12-19 14:05:32Two Different Strategies for Trading Classical Chart Patterns – December 2021 Tech Charts Webinar
https://blog.techcharts.net/wp-content/uploads/2018/03/Mar-19-Featured-Image.png
644
962
Aksel Kibar
https://blog.techcharts.net/wp-content/uploads/2017/05/Tech-Charts-logo-FINAL-CLEAN-340w.png
Aksel Kibar2021-09-06 14:55:062021-09-06 20:14:51Chart Pattern Reliability & Statistics – September 2021 Tech Charts Webinar
https://blog.techcharts.net/wp-content/uploads/2018/05/Year-in-Review-.jpg
426
640
Aksel Kibar
https://blog.techcharts.net/wp-content/uploads/2017/05/Tech-Charts-logo-FINAL-CLEAN-340w.png
Aksel Kibar2021-05-22 11:08:282021-05-22 11:08:28Tech Charts Year in Review with Aksel – May 2021
https://blog.techcharts.net/wp-content/uploads/2018/03/Mar-19-Featured-Image.png
644
962
Aksel Kibar
https://blog.techcharts.net/wp-content/uploads/2017/05/Tech-Charts-logo-FINAL-CLEAN-340w.png
Aksel Kibar2021-03-18 07:22:102021-03-18 07:22:104 Types of Breakouts and How To Trade Them – March 2021 Tech Charts Webinar
https://blog.techcharts.net/wp-content/uploads/2018/03/Mar-19-Featured-Image.png
644
962
Aksel Kibar
https://blog.techcharts.net/wp-content/uploads/2017/05/Tech-Charts-logo-FINAL-CLEAN-340w.png
Aksel Kibar2020-12-05 18:09:052020-12-05 18:11:12Chart Pattern Statistics, H&S continuation and H&S failures – December 2020 Tech Charts Webinar
https://blog.techcharts.net/wp-content/uploads/2018/03/Mar-19-Featured-Image.png
644
962
Aksel Kibar
https://blog.techcharts.net/wp-content/uploads/2017/05/Tech-Charts-logo-FINAL-CLEAN-340w.png
Aksel Kibar2020-09-11 04:56:522020-09-11 04:56:52Re-entry, Volatility & ATR based stop-loss – September 2020 Tech Charts Webinar
https://blog.techcharts.net/wp-content/uploads/2018/05/Year-in-Review-.jpg
426
640
Aksel Kibar
https://blog.techcharts.net/wp-content/uploads/2017/05/Tech-Charts-logo-FINAL-CLEAN-340w.png
Aksel Kibar2020-05-27 06:19:552020-05-27 06:19:55Tech Charts Year in Review with Aksel – May 2020
https://blog.techcharts.net/wp-content/uploads/2018/03/Mar-19-Featured-Image.png
644
962
Aksel Kibar
https://blog.techcharts.net/wp-content/uploads/2017/05/Tech-Charts-logo-FINAL-CLEAN-340w.png
Aksel Kibar2020-03-30 16:09:302020-03-30 16:20:494 Types of Breakouts – March 2020 Tech Charts Webinar
https://blog.techcharts.net/wp-content/uploads/2018/03/Mar-19-Featured-Image.png
644
962
Aksel Kibar
https://blog.techcharts.net/wp-content/uploads/2017/05/Tech-Charts-logo-FINAL-CLEAN-340w.png
Aksel Kibar2019-12-19 06:07:042019-12-19 06:07:04Short-Term Chart Patterns – December 2019 Tech Charts Webinar
https://blog.techcharts.net/wp-content/uploads/2018/03/Mar-19-Featured-Image.png
644
962
Aksel Kibar
https://blog.techcharts.net/wp-content/uploads/2017/05/Tech-Charts-logo-FINAL-CLEAN-340w.png
Aksel Kibar2019-09-24 15:06:482019-09-24 15:06:48A review of the most reliable chart patterns Tech Charts Global Equity Markets report featured over the past two years – September 2019 Tech Charts Webinar
https://blog.techcharts.net/wp-content/uploads/2018/03/Mar-19-Featured-Image.png
644
962
Aksel Kibar
https://blog.techcharts.net/wp-content/uploads/2017/05/Tech-Charts-logo-FINAL-CLEAN-340w.png
Aksel Kibar2019-04-27 05:53:262019-04-27 05:53:26Inverse Head & Shoulder and Head & Shoulder Continuation – April 2019 Tech Charts Webinar
https://blog.techcharts.net/wp-content/uploads/2018/03/Mar-19-Featured-Image.png
644
962
Aksel Kibar
https://blog.techcharts.net/wp-content/uploads/2017/05/Tech-Charts-logo-FINAL-CLEAN-340w.png
Aksel Kibar2019-01-17 19:19:402019-04-04 19:10:06Reversal Chart Patterns – January 2019 Tech Charts Webinar
https://blog.techcharts.net/wp-content/uploads/2018/03/Mar-19-Featured-Image.png
644
962
Aksel Kibar
https://blog.techcharts.net/wp-content/uploads/2017/05/Tech-Charts-logo-FINAL-CLEAN-340w.png
Aksel Kibar2018-10-02 14:38:152020-01-14 12:25:59Symmetrical Triangle Chart Patterns – September 2018 Tech Charts Webinar
https://blog.techcharts.net/wp-content/uploads/2018/05/Year-in-Review-.jpg
426
640
Aksel Kibar
https://blog.techcharts.net/wp-content/uploads/2017/05/Tech-Charts-logo-FINAL-CLEAN-340w.png
Aksel Kibar2018-05-24 14:46:382019-04-04 19:09:21Tech Charts Year in Review – Year One
https://blog.techcharts.net/wp-content/uploads/2018/03/Mar-19-Featured-Image.png
644
962
Jolleen Oleson
https://blog.techcharts.net/wp-content/uploads/2017/05/Tech-Charts-logo-FINAL-CLEAN-340w.png
Jolleen Oleson2018-03-19 07:12:272020-01-14 12:59:10Ascending Triangle Chart Patterns – March 2018 Tech Charts Webinar
https://blog.techcharts.net/wp-content/uploads/2018/03/Mar-19-Featured-Image.png
644
962
Jolleen Oleson
https://blog.techcharts.net/wp-content/uploads/2017/05/Tech-Charts-logo-FINAL-CLEAN-340w.png
Jolleen Oleson2017-12-22 07:59:492020-01-14 14:47:22Rectangle Chart Patterns – December 2017 Tech Charts Webinar https://blog.techcharts.net/wp-content/uploads/2017/09/WEBINAR-IMAGE.png
640
961
Jolleen Oleson
https://blog.techcharts.net/wp-content/uploads/2017/05/Tech-Charts-logo-FINAL-CLEAN-340w.png
Jolleen Oleson2017-09-27 12:46:282019-04-04 19:56:11Factor LLC and Tech Charts Member Webinar – September 2017
https://blog.techcharts.net/wp-content/uploads/2017/09/WEBINAR-IMAGE.png
640
961
Jolleen Oleson
https://blog.techcharts.net/wp-content/uploads/2017/05/Tech-Charts-logo-FINAL-CLEAN-340w.png
Jolleen Oleson2017-09-27 12:46:282019-04-04 19:56:11Factor LLC and Tech Charts Member Webinar – September 2017 https://blog.techcharts.net/wp-content/uploads/2017/10/WEBINAR-IMAGE-III.png
638
954
Aksel Kibar
https://blog.techcharts.net/wp-content/uploads/2017/05/Tech-Charts-logo-FINAL-CLEAN-340w.png
Aksel Kibar2017-05-30 08:44:152019-04-04 19:55:34Tech Charts Public Webinar – May 2017
https://blog.techcharts.net/wp-content/uploads/2017/10/WEBINAR-IMAGE-III.png
638
954
Aksel Kibar
https://blog.techcharts.net/wp-content/uploads/2017/05/Tech-Charts-logo-FINAL-CLEAN-340w.png
Aksel Kibar2017-05-30 08:44:152019-04-04 19:55:34Tech Charts Public Webinar – May 2017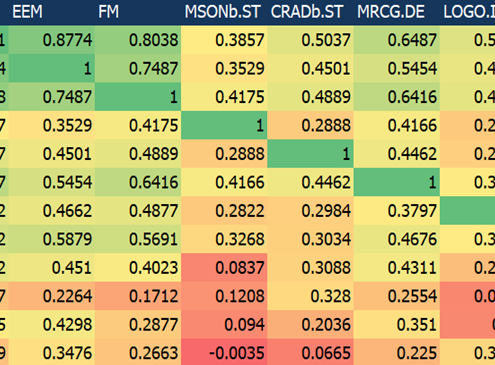 https://blog.techcharts.net/wp-content/uploads/2020/07/CORRELATION-IMAGE.png
365
835
Aksel Kibar
https://blog.techcharts.net/wp-content/uploads/2017/05/Tech-Charts-logo-FINAL-CLEAN-340w.png
Aksel Kibar2020-07-08 13:38:362020-07-08 13:38:36CORRELATION MATRIX
https://blog.techcharts.net/wp-content/uploads/2020/07/CORRELATION-IMAGE.png
365
835
Aksel Kibar
https://blog.techcharts.net/wp-content/uploads/2017/05/Tech-Charts-logo-FINAL-CLEAN-340w.png
Aksel Kibar2020-07-08 13:38:362020-07-08 13:38:36CORRELATION MATRIX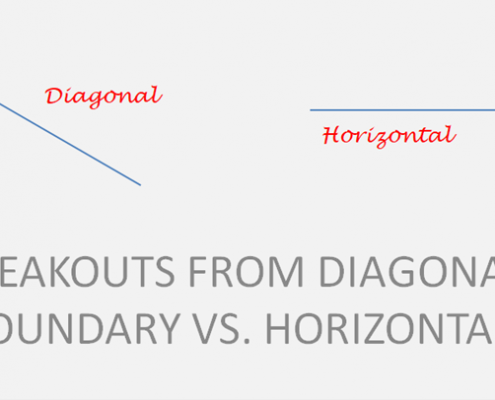 https://blog.techcharts.net/wp-content/uploads/2020/03/DIAGONAL-VS-HORIZONTAL.png
406
748
Aksel Kibar
https://blog.techcharts.net/wp-content/uploads/2017/05/Tech-Charts-logo-FINAL-CLEAN-340w.png
Aksel Kibar2020-03-02 03:57:182020-03-02 03:59:10DIAGONAL VS. HORIZONTAL BREAKOUTS
https://blog.techcharts.net/wp-content/uploads/2020/03/DIAGONAL-VS-HORIZONTAL.png
406
748
Aksel Kibar
https://blog.techcharts.net/wp-content/uploads/2017/05/Tech-Charts-logo-FINAL-CLEAN-340w.png
Aksel Kibar2020-03-02 03:57:182020-03-02 03:59:10DIAGONAL VS. HORIZONTAL BREAKOUTS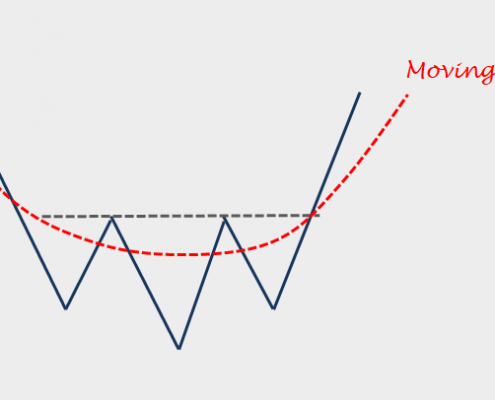 https://blog.techcharts.net/wp-content/uploads/2019/04/MOVING-AVERAGE-IMAGE.png
406
924
Aksel Kibar
https://blog.techcharts.net/wp-content/uploads/2017/05/Tech-Charts-logo-FINAL-CLEAN-340w.png
Aksel Kibar2019-04-05 15:30:012019-04-05 15:30:01Moving Averages
https://blog.techcharts.net/wp-content/uploads/2019/04/MOVING-AVERAGE-IMAGE.png
406
924
Aksel Kibar
https://blog.techcharts.net/wp-content/uploads/2017/05/Tech-Charts-logo-FINAL-CLEAN-340w.png
Aksel Kibar2019-04-05 15:30:012019-04-05 15:30:01Moving Averages https://blog.techcharts.net/wp-content/uploads/2018/05/May-22-Featured-Image.png
977
1487
Aksel Kibar
https://blog.techcharts.net/wp-content/uploads/2017/05/Tech-Charts-logo-FINAL-CLEAN-340w.png
Aksel Kibar2018-05-22 05:46:242018-05-22 05:46:24DUBAI TRADERS SUMMIT – RECTANGLE
https://blog.techcharts.net/wp-content/uploads/2018/05/May-22-Featured-Image.png
977
1487
Aksel Kibar
https://blog.techcharts.net/wp-content/uploads/2017/05/Tech-Charts-logo-FINAL-CLEAN-340w.png
Aksel Kibar2018-05-22 05:46:242018-05-22 05:46:24DUBAI TRADERS SUMMIT – RECTANGLE https://blog.techcharts.net/wp-content/uploads/2018/05/May-8-Featured-Image-II.png
620
959
Aksel Kibar
https://blog.techcharts.net/wp-content/uploads/2017/05/Tech-Charts-logo-FINAL-CLEAN-340w.png
Aksel Kibar2018-05-08 16:33:092019-12-27 12:51:59DUBAI TRADERS SUMMIT – H&S BOTTOM
https://blog.techcharts.net/wp-content/uploads/2018/05/May-8-Featured-Image-II.png
620
959
Aksel Kibar
https://blog.techcharts.net/wp-content/uploads/2017/05/Tech-Charts-logo-FINAL-CLEAN-340w.png
Aksel Kibar2018-05-08 16:33:092019-12-27 12:51:59DUBAI TRADERS SUMMIT – H&S BOTTOM https://blog.techcharts.net/wp-content/uploads/2017/05/Tech-charts-public-blog-1.jpg
822
1233
Aksel Kibar
https://blog.techcharts.net/wp-content/uploads/2017/05/Tech-Charts-logo-FINAL-CLEAN-340w.png
Aksel Kibar2017-05-25 15:48:582017-09-07 13:52:25Long Term Charts – Trading Themes – Averages and Sectors
https://blog.techcharts.net/wp-content/uploads/2017/05/Tech-charts-public-blog-1.jpg
822
1233
Aksel Kibar
https://blog.techcharts.net/wp-content/uploads/2017/05/Tech-Charts-logo-FINAL-CLEAN-340w.png
Aksel Kibar2017-05-25 15:48:582017-09-07 13:52:25Long Term Charts – Trading Themes – Averages and Sectors
