Every week Tech Charts Global Equity Markets report features some of the well-defined, mature classical chart patterns under a lengthy watchlist and the chart pattern breakout signals that took place during that week. Global Equity Markets report covers single stocks from developed, emerging and frontier markets, ETF’s and global equity indices. The report starts with a review section that highlights the important chart developments on global equity benchmarks. This blog post features a multi year-long Head and Shoulder continuation and a 10 month-long descending triangle on GLOBAL X URANIUM ETF (URA).
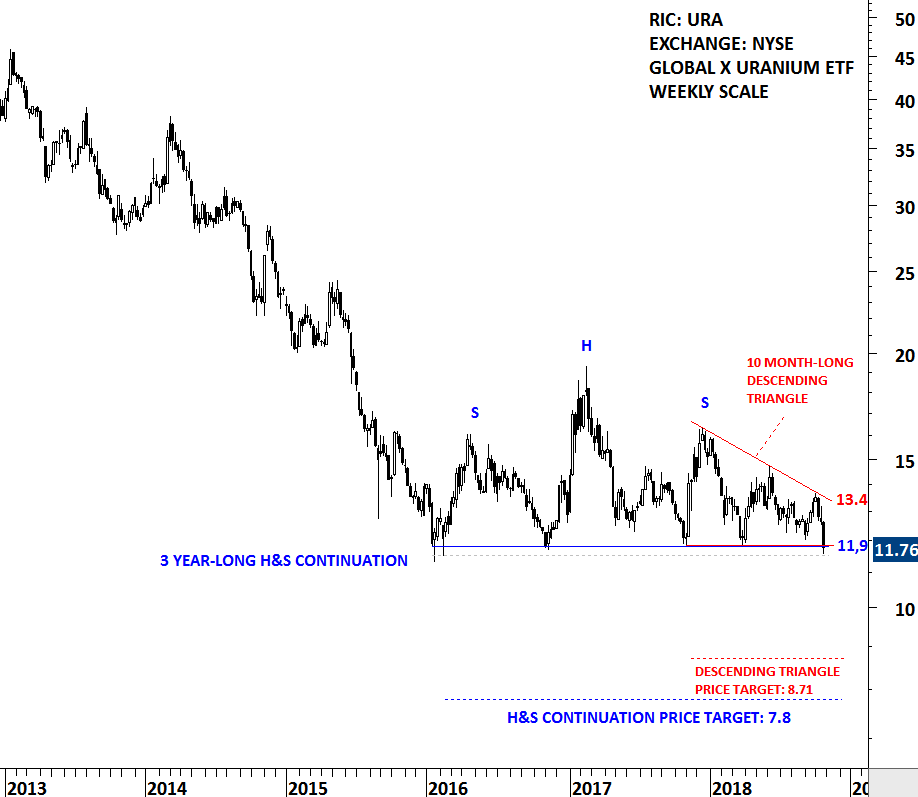
GLOBAL X URANIUM ETF (URA)
The Fund seeks to provide investment results that correspond generally to the price and yield performance, before fees and expenses, of the Solactive Global Uranium Index. The Fund is designed to measure broad based equity market performance of global companies involved in the uranium industry. Price chart formed a 3 year-long H&S continuation with the right shoulder possibly in the form of a 10 month-long descending triangle. Both chart patters are bearish and once completed on the downside, suggest lower levels. Possible chart pattern price target for the 10 month-long descending triangle stands at 8.71 levels and the price target for the 3 year-long H&S continuation at 7.8 levels. A daily close below 11.55 levels will confirm the breakdown.
Tech Charts Membership

By becoming a Premium Member, you’ll be able to improve your knowledge of the principles of classical charting.
With this knowledge, you can merge them with your investing system. In fact, some investors use my analyses to modify their existing style to invest more efficiently and successfully.
Get Access Now
As a Premium Member of Aksel Kibar’s Tech Charts,
You will receive:
-
Global Equities Report. Delivered weekly.
-
Classical charting principles. Learn patterns and setups.
-
Actionable information. Worldwide indices and stocks of interest.
-
Risk management advice. The important trading points of each chart.
-
Information on breakout opportunities. Identify the ones you want to take action on.
-
Video tutorials. How patterns form and why they succeed or fail.
-
Watch list alerts. As they become available so you can act quickly.
-
Breakout alerts. Usually once a week.
-
Access to everything (now and as it becomes available)
o Reports
o Videos and video series
-
Multi-part webinar course. You learn the 8 most common charting principles.
-
Webinars. Actionable and timely advice on breaking out chart patterns.
For your convenience your membership auto renews each year.
Get Access Now

 Read More