Posts

RECTANGLE – BREAKOUT ALERTS

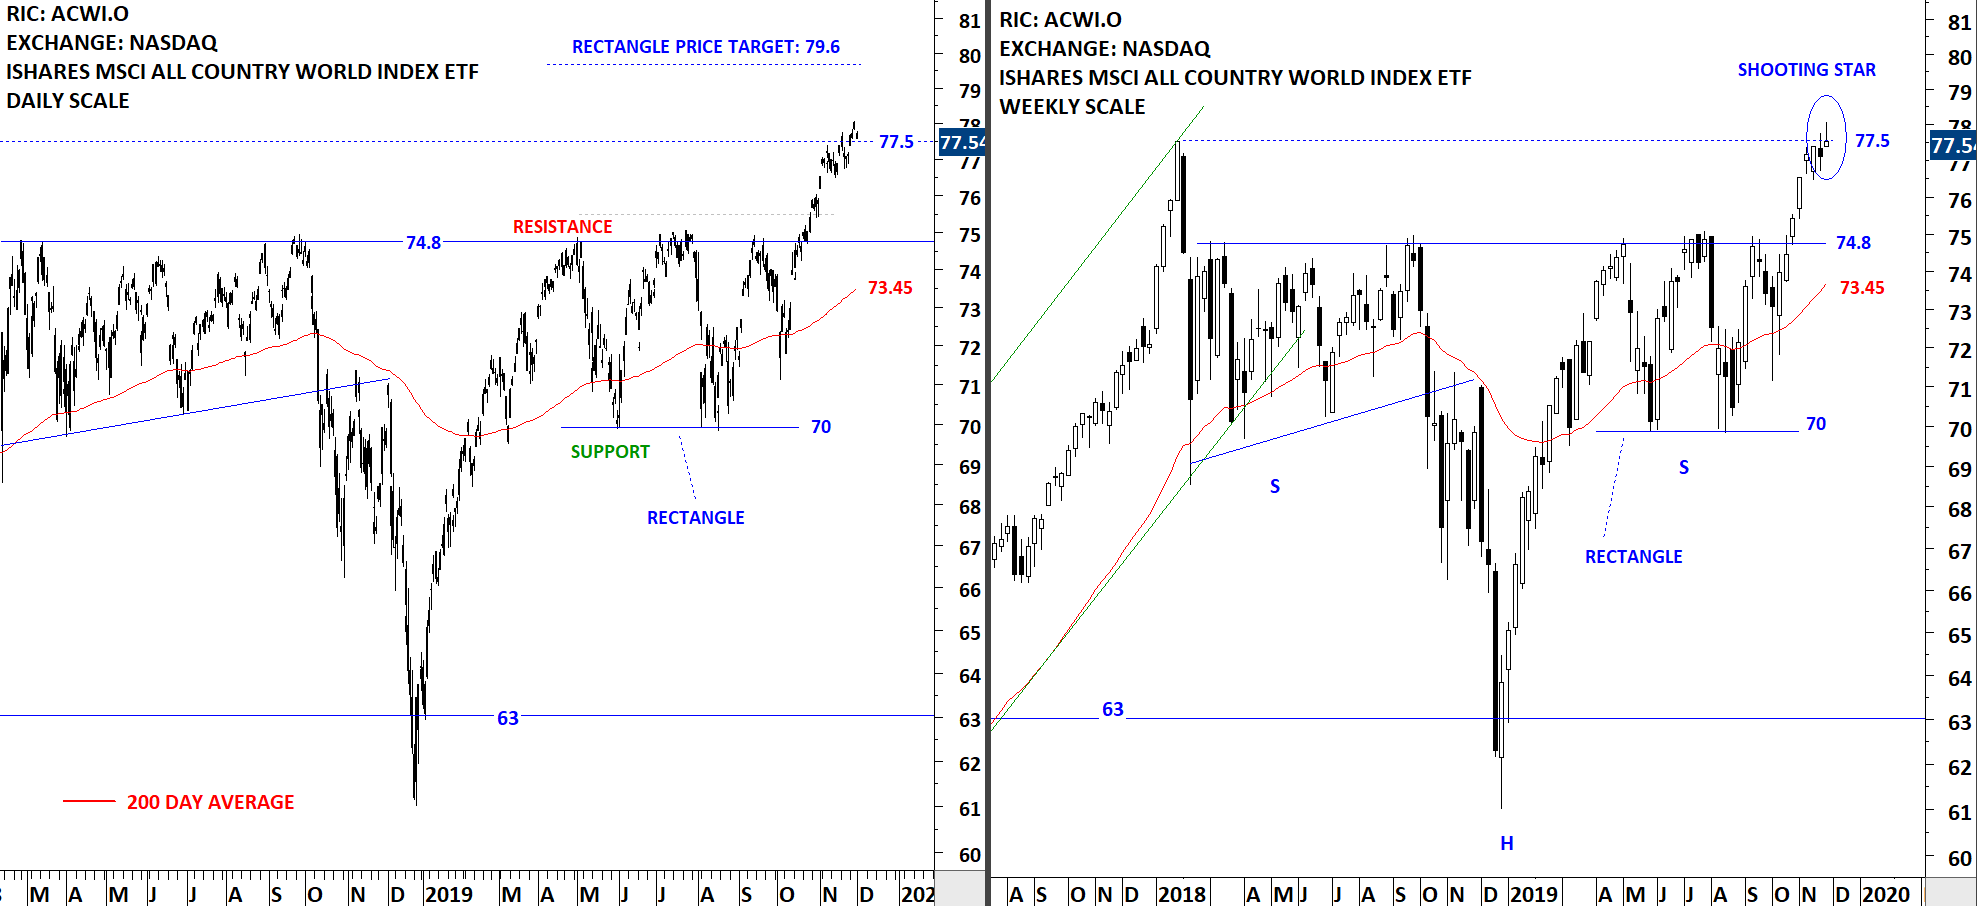
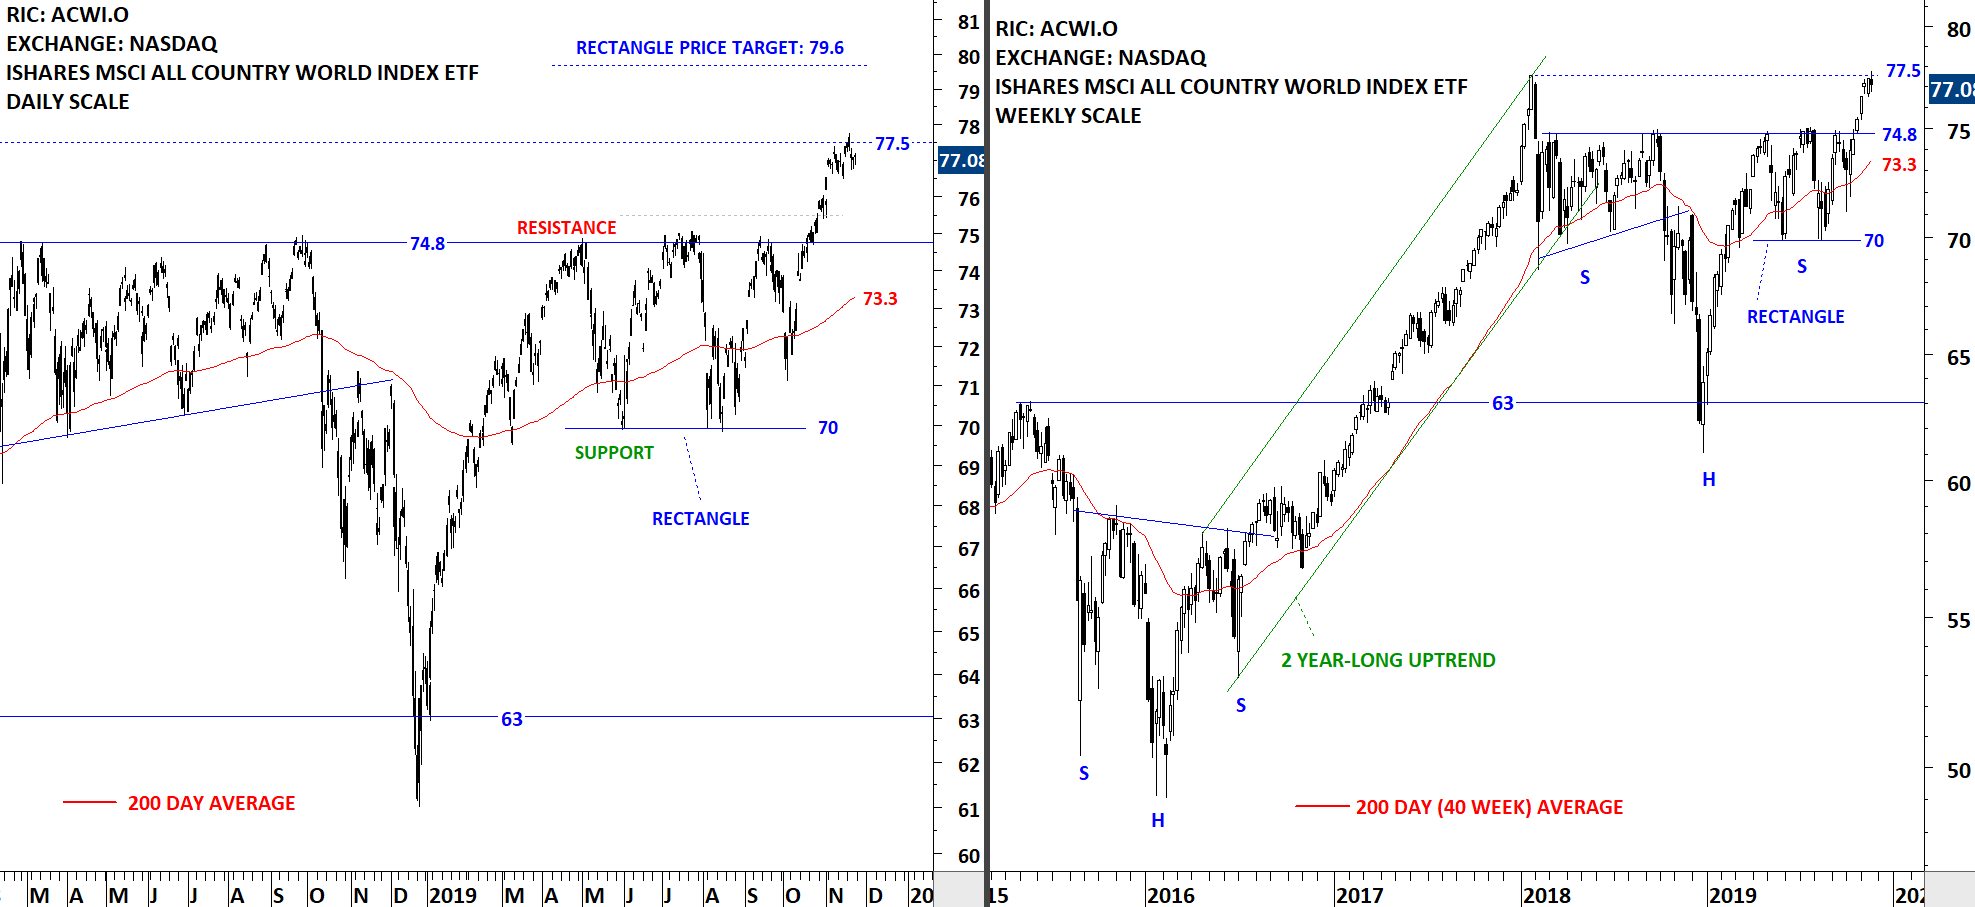
Every week Tech Charts Global Equity Markets report features some of the well-defined, mature classical chart patterns under a lengthy watchlist and the chart pattern breakout signals that took place during that week. Global Equity Markets report covers single stocks from developed, emerging and frontier markets, ETF’s and global equity indices. The report starts with a review section that highlights the important chart developments on global equity benchmarks. This blog post features from the breakout section two rectangle breakout opportunities that are listed on U.S. Exchanges. The first chart is a breakout on a weekly scale and the second is a shorter-term duration chart pattern breakout taking place on a daily scale.

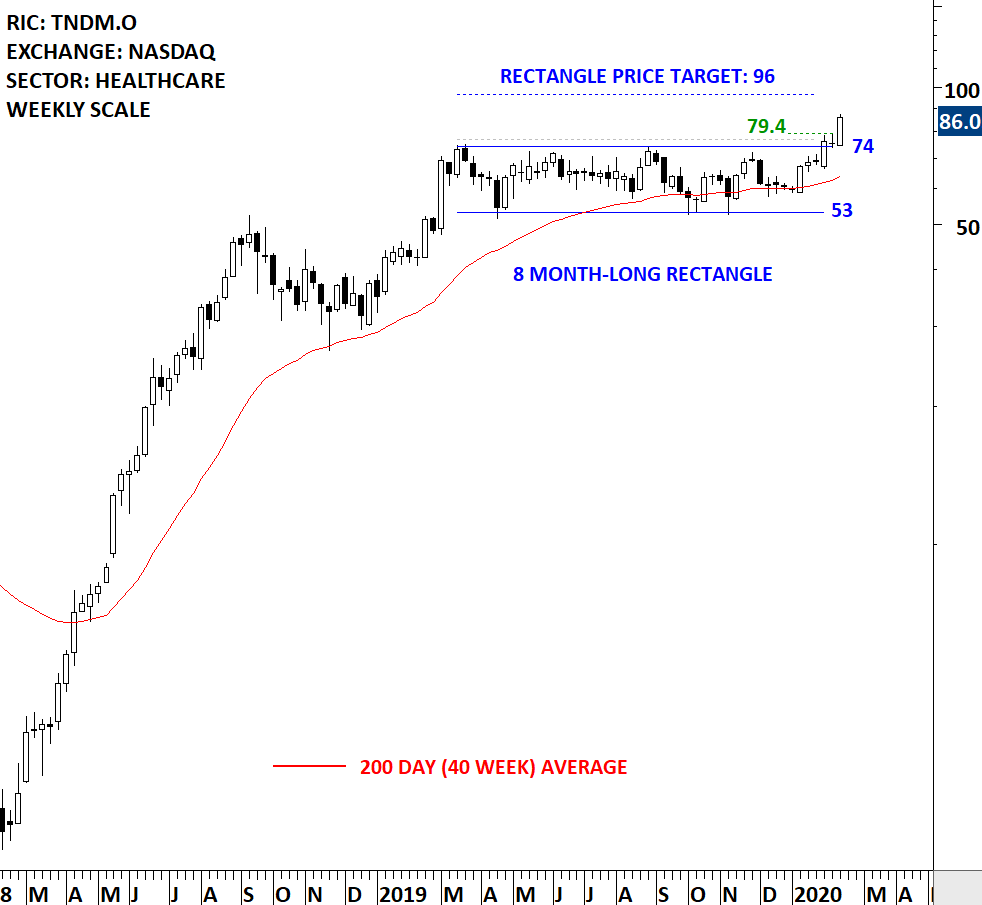
TANDEM DIABETES CARE INC (TNDM.O)

Tandem Diabetes Care, Inc. is a medical device company. The Company is engaged in designing, developing and commercializing products for people with insulin-dependent diabetes. The stock is listed on the Nasdaq Stock Exchange. Price chart formed an 8 month-long rectangle with the horizontal boundary acting as strong resistance at 74.0 levels. The horizontal boundary was tested several times over the course of the chart pattern. The daily close above 77.0 levels confirmed the breakout from the 8 month-long rectangle with the possible chart pattern price target of 96.00 levels. Tight and lengthy consolidations like these can have 2x or even 3x price targets. 2x price target stands at 118 levels (not shown on the chart)

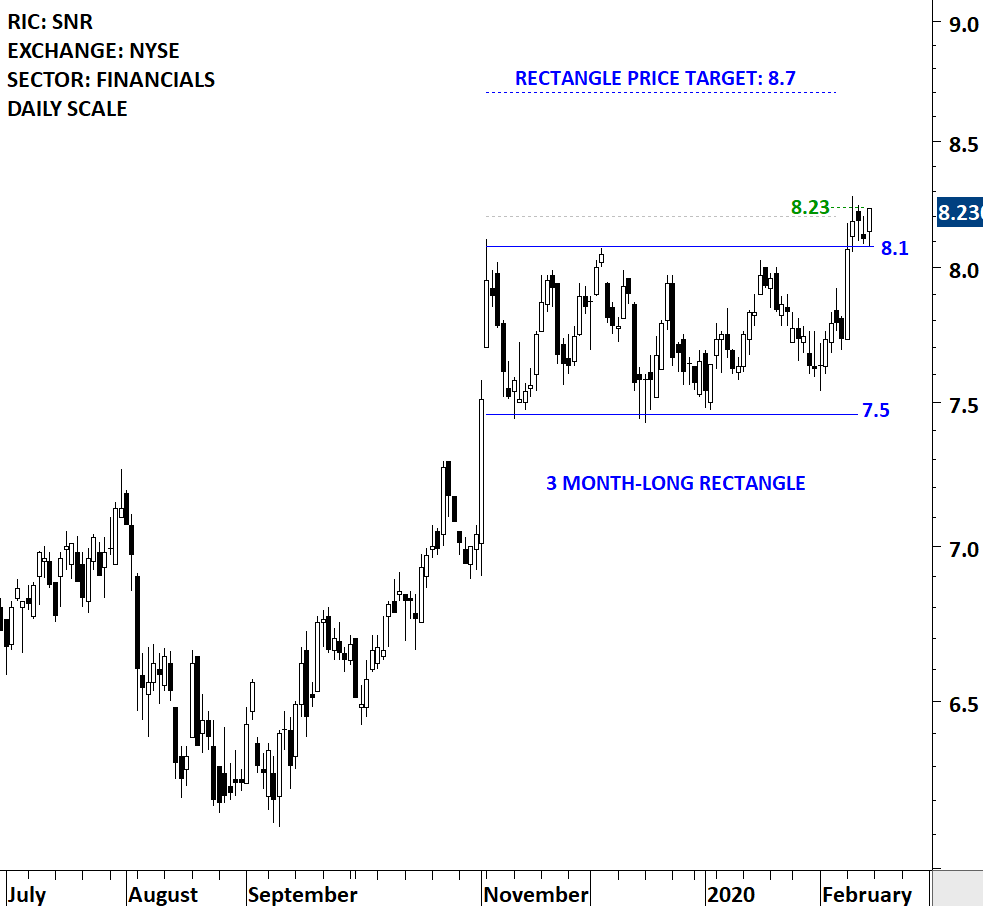
NEW SENIOR INVESTMENT GROUP INC (SNR)

New Senior Investment Group Inc. is a real estate investment trust with a diversified portfolio of primarily private pay senior housing properties located across the United States. The stock is listed on the New York Stock Exchange. Price chart formed a 3 month-long rectangle with the horizontal boundary acting as strong resistance at 8.10 levels. The daily close above 8.20 levels confirmed the breakout from the 3 month-long rectangle with the possible chart pattern price target of 8.70 levels.


Tech Charts Membership

By becoming a Premium Member, you’ll be able to improve your knowledge of the principles of classical charting.

With this knowledge, you can merge them with your investing system. In fact, some investors use my analyses to modify their existing style to invest more efficiently and successfully.

Get Access Now

As a Premium Member of Aksel Kibar’s Tech Charts,

You will receive:

  • Global Equities Report. Delivered weekly.
  • Classical charting principles. Learn patterns and setups.
  • Actionable information. Worldwide indices and stocks of interest.
  • Risk management advice. The important trading points of each chart.
  • Information on breakout opportunities. Identify the ones you want to take action on.
  • Video tutorials. How patterns form and why they succeed or fail.
  • Watch list alerts. As they become available so you can act quickly.
  • Breakout alerts. Usually once a week.
  • Access to everything (now and as it becomes available)
    o Reports
    o Videos and video series
  • Multi-part webinar course. You learn the 8 most common charting principles.
  • Webinars. Actionable and timely advice on breaking out chart patterns.

For your convenience your membership auto renews each year.

Get Access Now

GLOBAL EQUITY MARKETS – January 18, 2020

REVIEW


The benchmark for the Global equity markets performance, the iShares MSCI All Country World Index ETF (ACWI.O) continues to remain strong after completing both rectangle and H&S continuation chart patterns. ACWI ETF is in a steady uptrend. During any pullback, the high of 2018 (77.5) can act as support. It is usually difficult to pick tops and bottoms. The best way to approach strong trending markets is to trail it with trend following indicators such as ATR based trailing stops or different period moving averages. Selection of moving average period will depend on your time frame. Short-term moving averages will trail the price closely, resulting in an early exit signal.

  Read More

GLOBAL EQUITY MARKETS – January 4, 2020

REVIEW


The benchmark for the Global equity markets performance, the iShares MSCI All Country World Index ETF (ACWI.O) reached its initial price target after completing both rectangle and H&S continuation chart patterns. The right shoulder of a possible H&S continuation was identified as a rectangle with the price target of 79.6 levels. So far the price remained stable after reaching price objective. ACWI ETF is in a steady uptrend. During any pullback, the high of 2018 (77.5) can act as support.

Read More

GLOBAL EQUITY MARKETS – December 28, 2019

Dear Tech Charts members,

Another year is almost behind us. 2019 has been a productive year. Your communications and feedback has been helpful in improving the membership service and I'm thankful for that. Without your support I would not be able to put out this product. I hope the ideas, the educational content, webinars and reports have added value in your decision making. Guided and motivated by our members feedback and comments there will be several new additions to Tech Charts membership service in the new Year. I look forward to announcing them as the new Year progresses. I wish all of you a healthy and successful new Year and I would like to thank you for being a Tech Charts member.

Regards,

Aksel Kibar, CMT

REVIEW


The benchmark for the Global equity markets performance, the iShares MSCI All Country World Index ETF (ACWI.O) reached its initial price target after completing both the rectangle and H&S continuation chart patterns. The right shoulder of a possible H&S continuation was identified as a rectangle with the price target of 79.6 levels. This week's price action pushed the ETF towards its rectangle chart pattern price target. Long-term chart pattern price objective stands at 85.5 levels. During any pullback, the high of 2018 (77.5) can act as support. Daily and weekly price charts show a steady uptrend.

Read More

GLOBAL EQUITY MARKETS – December 14, 2019

REVIEW


The benchmark for the Global equity markets performance, the iShares MSCI All Country World Index ETF (ACWI.O) cleared the resistance at 77.5 levels. After a week of short-term volatility and pullback the ETF resumed higher towards its possible rectangle chart pattern price target at 79.6 levels. Both the daily and weekly price charts show a steady uptrend.

Read More

GLOBAL EQUITY MARKETS – December 7, 2019

REVIEW


The benchmark for the Global equity markets performance, the iShares MSCI All Country World Index ETF (ACWI.O) found resistance at 77.5 levels. Last week's bearish shooting star candlestick pattern proved to be a short-term correction signal. Following a quick sell-off (intra-week) the ETF recovered to test its previous high.

Is the short-term correction over? Read More

GLOBAL EQUITY MARKETS – November 30, 2019

REVIEW


The benchmark for the Global equity markets performance, the iShares MSCI All Country World Index ETF (ACWI.O) found resistance at 77.5 levels. This week's price action formed a shooting star candlestick around the resistance area. The shooting star is common candlestick that indicates the potential for a bearish reversal. This candlestick is characterized by a small body with a long upper wick and a short or nonexistent lower wick. In order to be classified as a shooting star, the upper wick of the candlestick should be at least twice as long as its body. The shooting star candlestick looks very similar to the inverted hammer candlestick. The defining difference is that shooting stars are bearish reversal signals at the top of of uptrends, while inverted hammers are bullish reversal signals at the bottom of downtrends.

The 5 month-long rectangle price target stands at 79.6 levels. Breakout above the minor resistance can push the ETF towards the price target at 79.6. Both the daily and weekly price charts show a steady uptrend. Unless we see a strong breakout above this week's high, ACWI ETF can trade between 74.8 and 77.5 levels in the following weeks.

Read More

GLOBAL EQUITY MARKETS – November 23, 2019

REVIEW


The benchmark for the Global equity markets performance, the iShares MSCI All Country World Index ETF (ACWI.O) continued to trade close to the resistance level at 77.5 levels. The ETF found short-term resistance around 77.5 levels. The 5 month-long rectangle price target stands at 79.6 levels. Breakout above the minor resistance can push the ETF towards the price target at 79.6. Both the daily and weekly price charts show a steady uptrend. 74.8 levels will act as support during any pullback.

Read More