Posts

GLOBAL EQUITY MARKETS – July 29, 2017

REVIEW


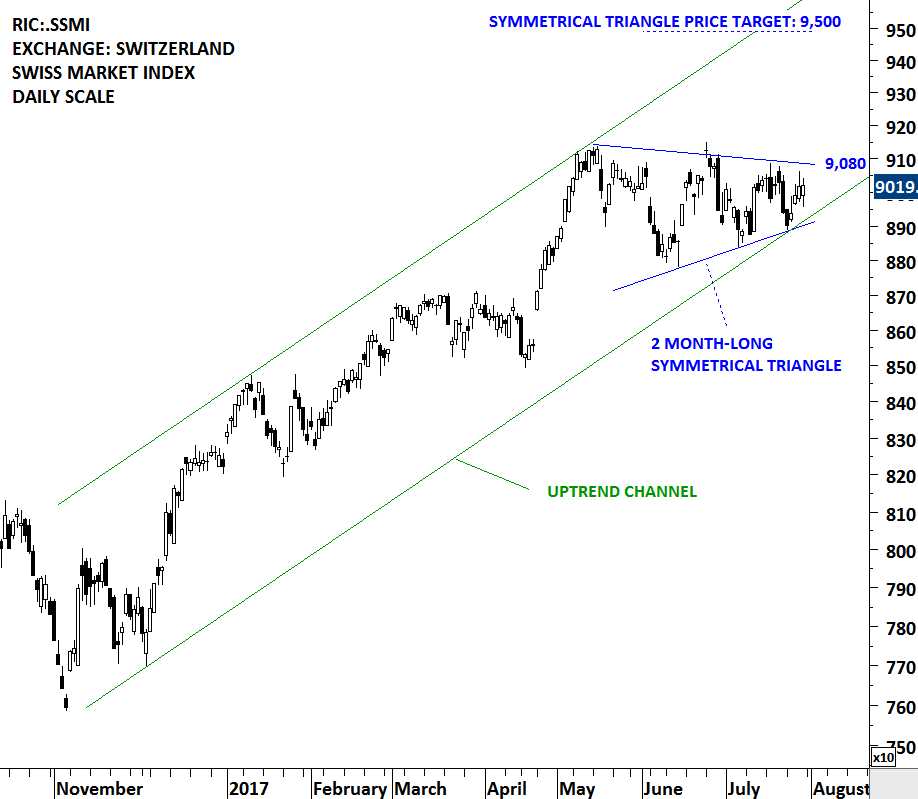
Swiss Market Index is possibly preparing for a breakout from its 2 month-long sideways consolidation. Last 2 month's price action can be identified as a symmetrical triangle and it can act as a bullish continuation. The upper boundary of the triangle stands as resistance at 9,080 levels. Symmetrical triangle possible chart pattern price target stands at 9,500 levels. Swiss benchmark equity index performed better than its European peers. This week's report features three different bullish chart developments on the Swiss financial stocks. Swiss Market Index ETF is available in local (CHF) currency via iShares SMI ETF that is listed on the Swiss Exchange. Also, a USD denominated ETF is listed on the New York Stock Exchange via iShares MSCI Switzerland Capped ETF (EWL).

Read More

TURKCELL (TKC) – TURKEY

Every week Tech Charts Global Equity Markets report features some of the well-defined, mature classical chart patterns under a lengthy watchlist and the chart pattern breakout signals that took place during that week. Global Equity Markets report covers single stocks from developed and emerging markets, ETF's and global equity indices. The main focus of the weekly report is to bring member's attention some of the best examples of classical charting. Chart patterns that are likely to resolve in a directional move. This blog post highlights one of several great chart setups from the latest Global Equity Markets report. Below you will also find a sample educational video on rectangle chart pattern as well as past examples of Tech Charts Breakout Alerts on Rectangles.

TURKCELL ILETISIM HIZMETLERI (TKC)

Turkcell Iletisim Hizmetleri AS is engaged in establishing and operating a Global System for Mobile Communications (GSM) network in Turkey and regional states. The stock is listed on the New York Stock Exchange via depository receipts. Price chart formed a 4 month-long rectangle with the horizontal boundary standing as resistance at 8.75 levels. A daily close above 9 levels will confirm the breakout from the bullish continuation chart pattern with a possible price target of 9.65 levels. Rectangle can act as a bullish continuation chart pattern.

Read More

GLOBAL EQUITY MARKETS – July 22, 2017

REVIEW


U.S. Biotech stocks resume uptrend after their strong breakout in the last week of June. June 17, 2017 and June 24, 2017 Global Equity Markets reports drew attention to the strength in the Biotech ETFs and alerted members on the multi-month bullish chart pattern completions. Both SPDR S&P BIOTECH ETF and ISHARES NASDAQ BIOTECH ETF had strong breakouts. After few weeks of pull back to the previously broken chart pattern boundary, NASDAQ BIOTECH INDEX resumed its uptrend. Read More