Posts

GLOBAL EQUITY MARKETS – August 12, 2017

REVIEW


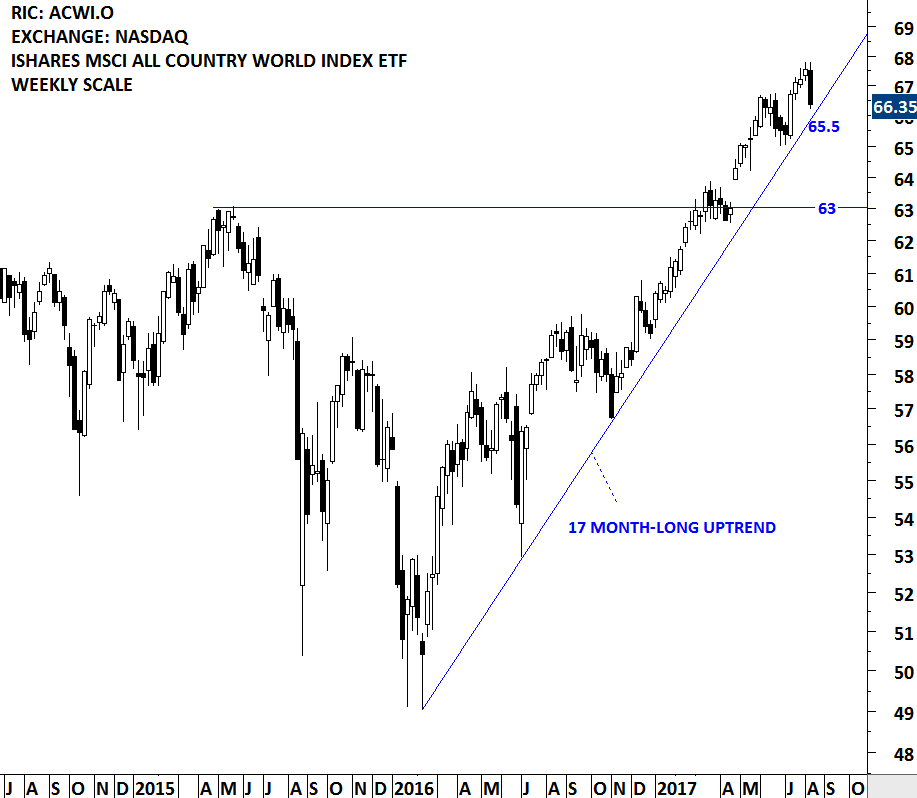
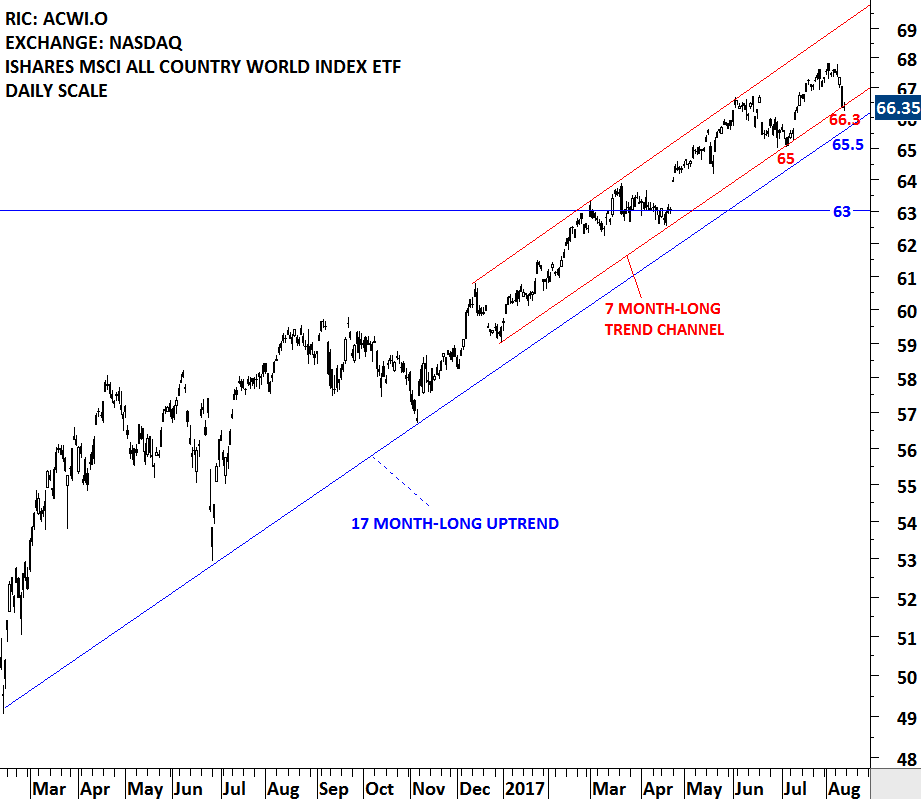
This week's price action did some technical damage on the charts. MSCI ALL COUNTRY WORLD INDEX ETF, a benchmark for global equity market performance gave back three weeks of gains in one weekly bar. The discussion on the financial networks and social media was about buying the dip. 66.3 is the lower boundary of the 7 month-long trend channel for the ACWI ETF. Failure to hold this support level can push the price to the next support at 65.5, which is the 17 month-long upward trendline. There is no clear chart pattern forming on the MSCI ACWI ETF. For those who are looking for sell signals on the ACWI, the breakdown of the trend channels should give some guidance. In case of further weakness in the global equity markets (a breakdown on the ACWI), this week's report should be helpful in identifying some of the bearish chart setups in the global equities and ETFs.

Read More

SOUTH AFRICA ALL SHARE INDEX

South Africa equities are possibly entering into a strong uptrend with the completion of a 2 year-long sideways consolidation. Last week's price action breached the multi-year trend resistance on the South Africa All Share index and pushed the local equity benchmark to all-time highs. Breakouts from multi-year consolidations usually result in multi-month trends. 54,600 levels will remain as strong support. Possible chart pattern price target for the South Africa All Share Index stands at 63,700 levels.

There are several tradable ETFs listed on the local exchange and also on the global exchanges. Below is a chart of South Africa listed ETF.

Read More

GLOBAL EQUITY MARKETS – August 5, 2017

REVIEW


South Africa equities are possibly entering into a strong uptrend with the completion of a 2 year-long sideways consolidation. This week's price action breached the multi-year trend resistance on the South Africa All Share index and pushed the local equity benchmark to all-time highs. Breakouts from multi-year consolidations usually result in multi-month trends. 54,600 levels will remain as strong support. Possible chart pattern price target for the South Africa All Share Index stands at 63,700 levels.

There are several tradable ETFs listed on the local exchange and also on the global exchanges. Below is a chart of South Africa listed ETF.

Read More