Posts

GLOBAL EQUITY MARKETS – January 18, 2020

REVIEW


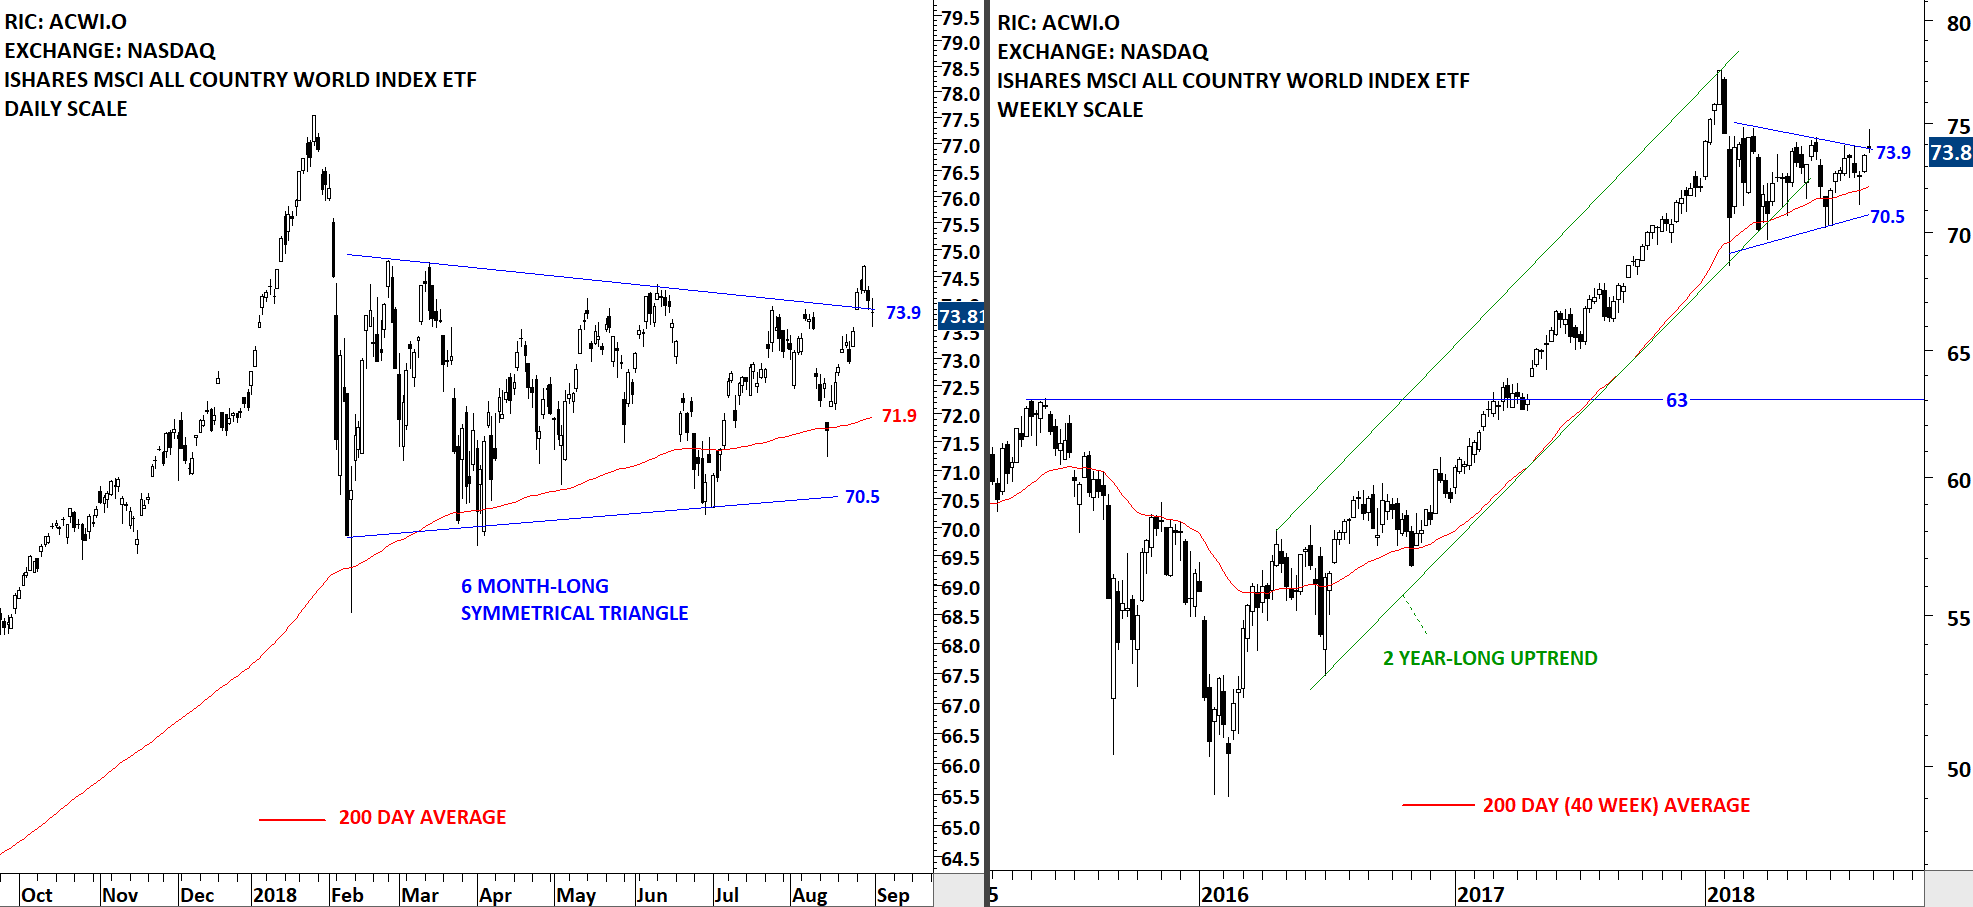
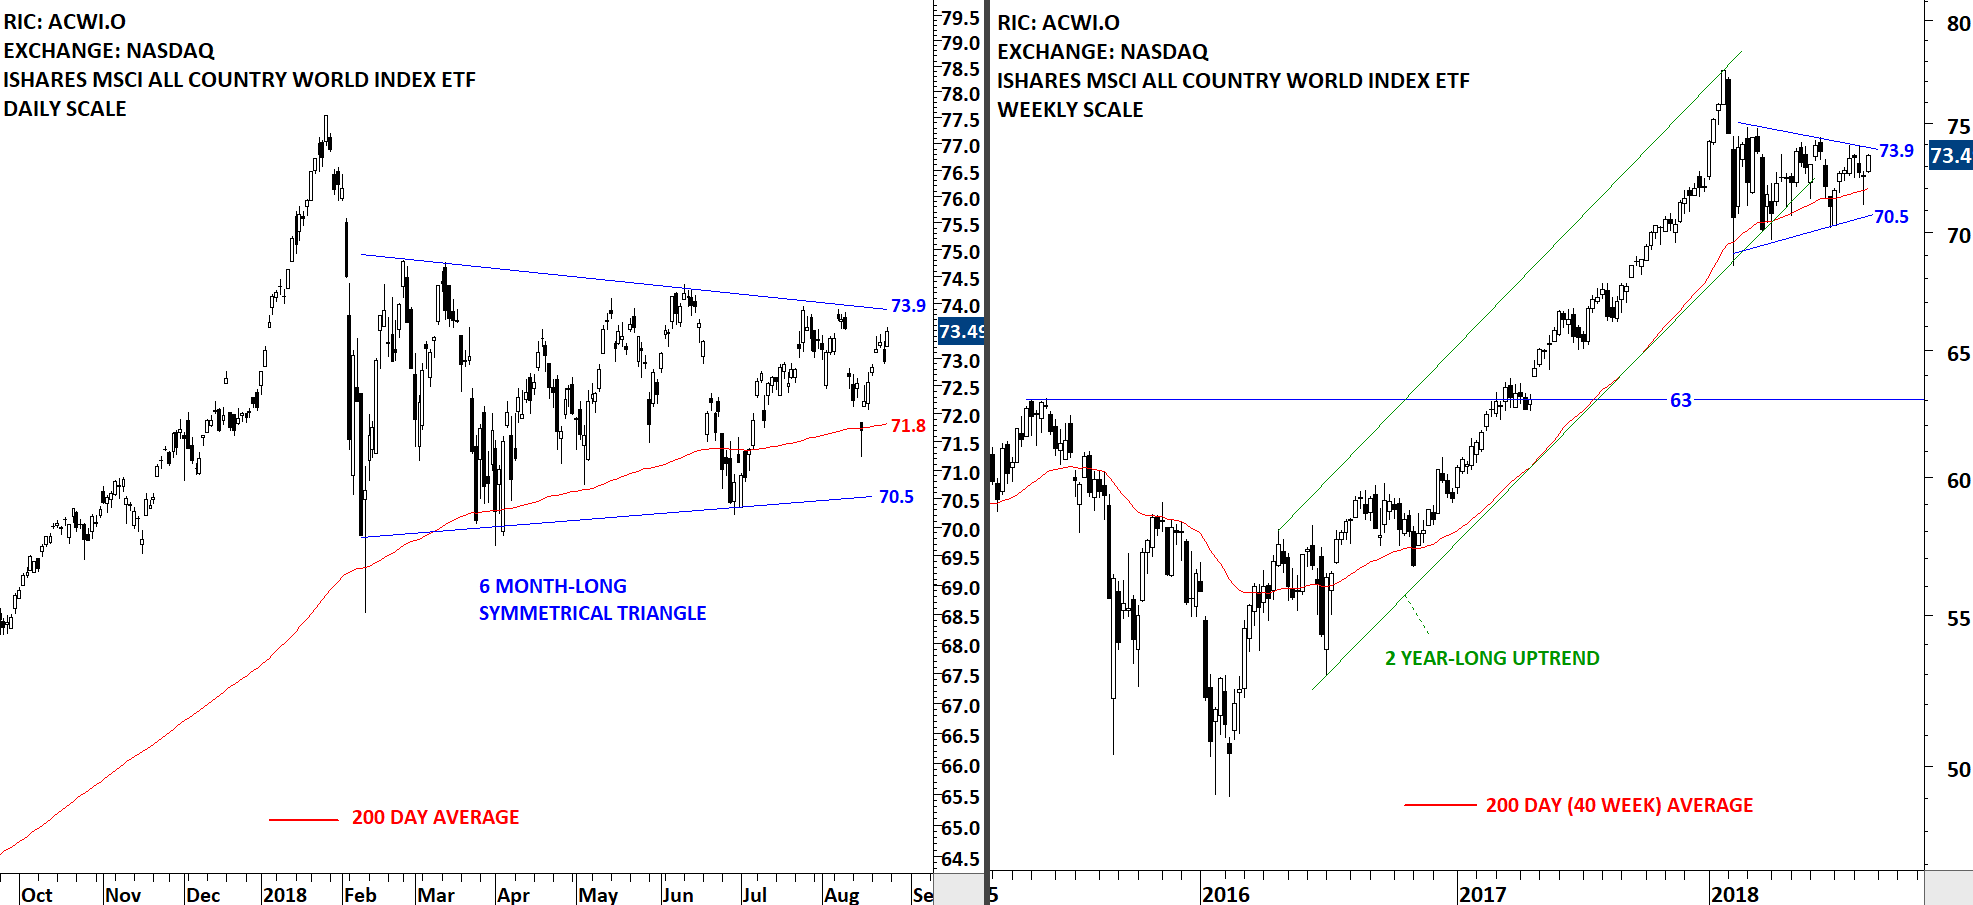
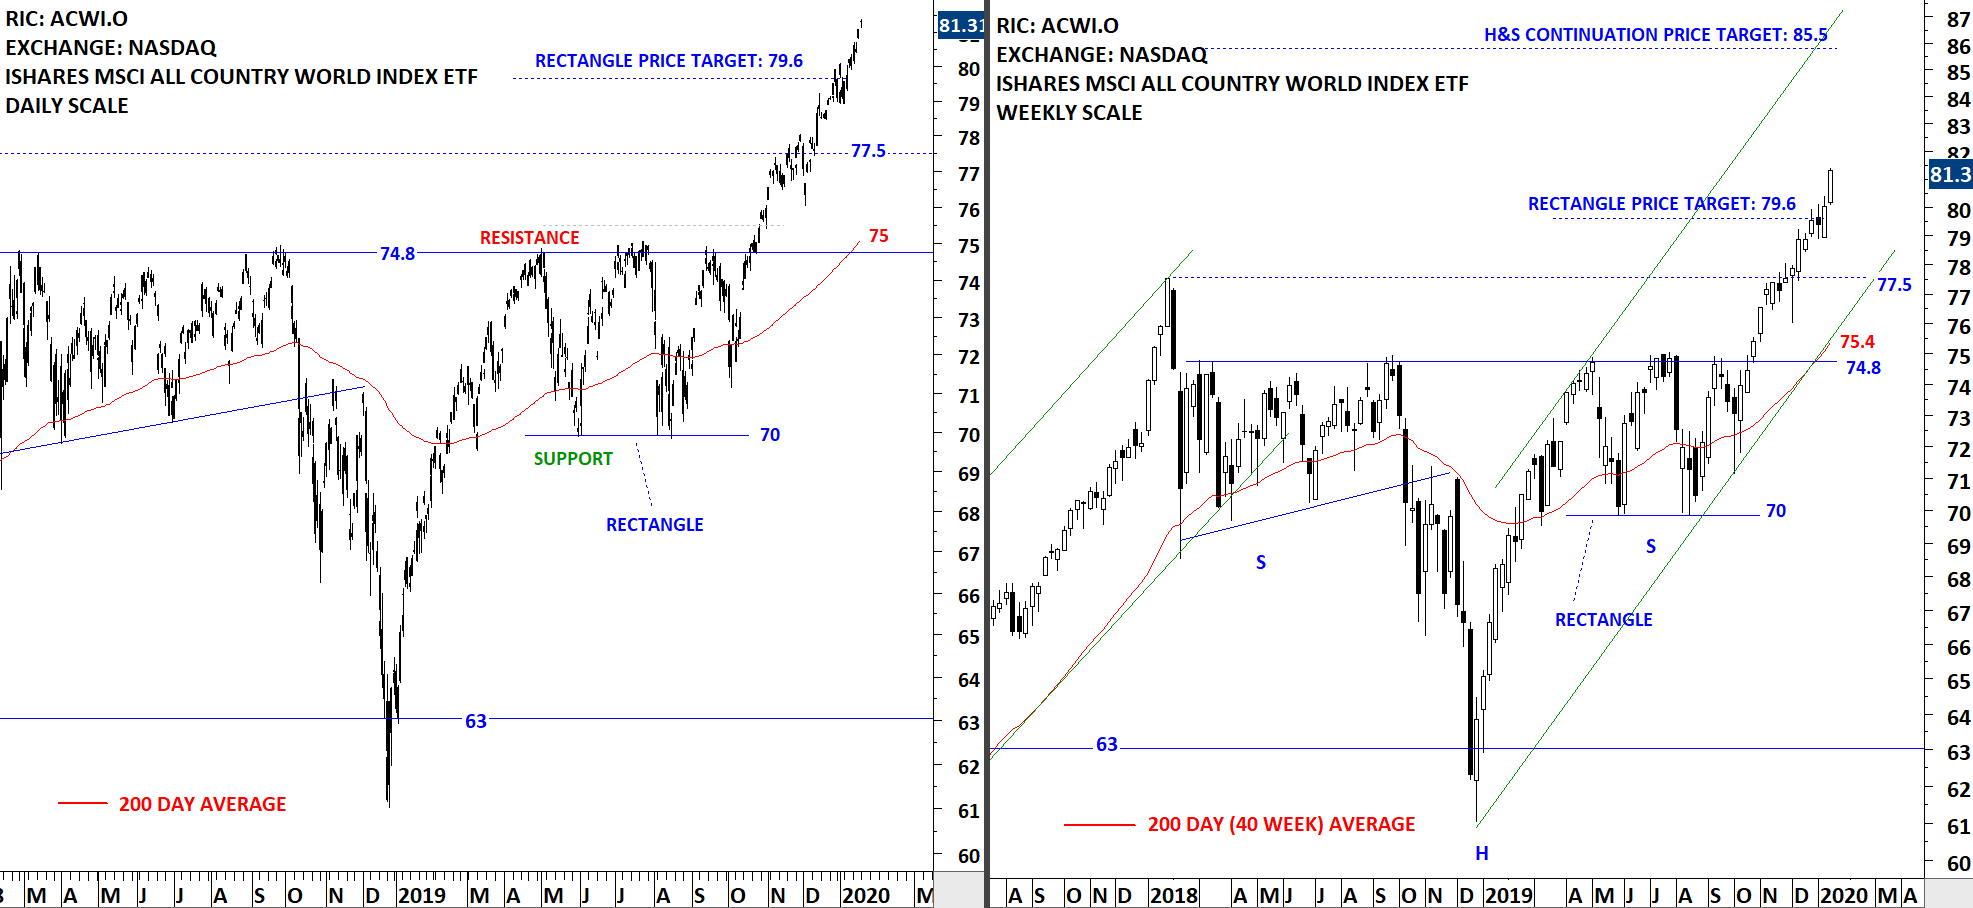
The benchmark for the Global equity markets performance, the iShares MSCI All Country World Index ETF (ACWI.O) continues to remain strong after completing both rectangle and H&S continuation chart patterns. ACWI ETF is in a steady uptrend. During any pullback, the high of 2018 (77.5) can act as support. It is usually difficult to pick tops and bottoms. The best way to approach strong trending markets is to trail it with trend following indicators such as ATR based trailing stops or different period moving averages. Selection of moving average period will depend on your time frame. Short-term moving averages will trail the price closely, resulting in an early exit signal.

  Read More

GLOBAL EQUITY MARKETS – September 1, 2018

REVIEW


The iShares MSCI All Country World Index ETF (ACWI.O) breached the upper boundary of its 6 month-long symmetrical triangle. The upper boundary is acting as resistance at 73.9 levels. The jury is still out. We need to see a follow through in the following week to call for a breakout from the lengthy sideways consolidation. This week's price action can be a premature breakout that can be followed by a secondary completion. More on: Premature & False breakouts

Read More

SCIENCE APPLICATIONS INTL. – H&S CONTINUATION

Every week Tech Charts Global Equity Markets report features some of the well-defined, mature classical chart patterns under a lengthy watchlist and the chart pattern breakout signals that took place during that week. Global Equity Markets report covers single stocks from developed, emerging and frontier markets, ETF’s and global equity indices. The report starts with a review section that highlights the important chart developments on global equity benchmarks. This blog post features an head and shoulder continuation chart pattern on Science Application International Corp. listed on the New York Stock Exchange.

Read More

GLOBAL EQUITY MARKETS – August 25, 2018

REVIEW


Once again the benchmark for Global Equity Markets performance, the iShares MSCI All Country World Index ETF (ACWI.O) is challenging the upper boundary of its 6 month-long sideways consolidation. The upper boundary was tested several times over the past few months. Resistance stands at 73.9. The lower boundary of the possible symmetrical triangle is acting as support at 70.5 levels. The ACWI ETF is trading above its long-term (200-day) average. Breakout above the upper boundary can complete the multi-month sideways consolidation and result in a directional move. The ACWI ETF still remains in a trading range.

Read More