
SUPPORT & RESISTANCE
Every week Tech Charts Global Equity Markets report features some of the well-defined, mature classical chart patterns under a lengthy watchlist and the chart pattern breakout signals that took place during that week. Global Equity Markets report covers single stocks from developed, emerging and frontier markets, ETF’s and global equity indices. The report starts with a review section that highlights the important chart developments on global equity benchmarks. This blog post features from the watchlist section a rectangle chart pattern that is listed on U.S. Exchange. The well-defined range can be utilized for trading opportunity between the boundaries until price experiences a confirmed breakout/breakdown. A link is provided here to learn more about Support and Resistances.
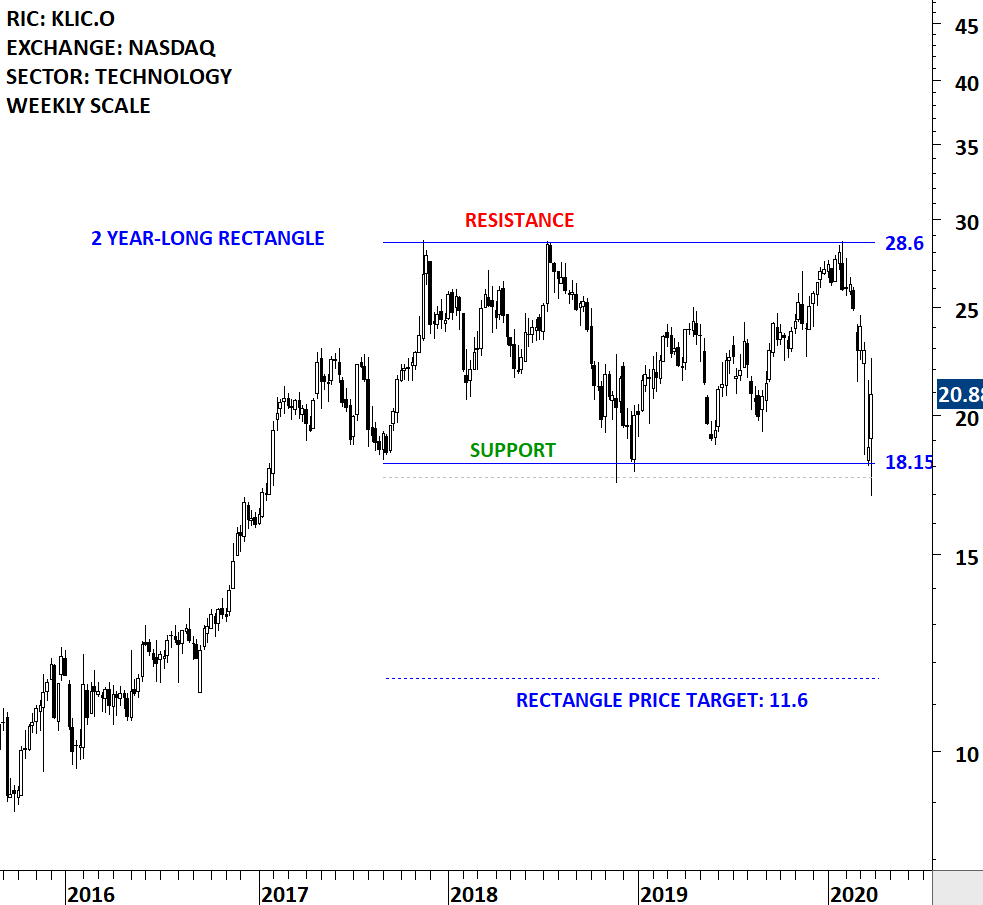
KULICKE AND SOFFA INDUSTRIES INC (KLIC.O)
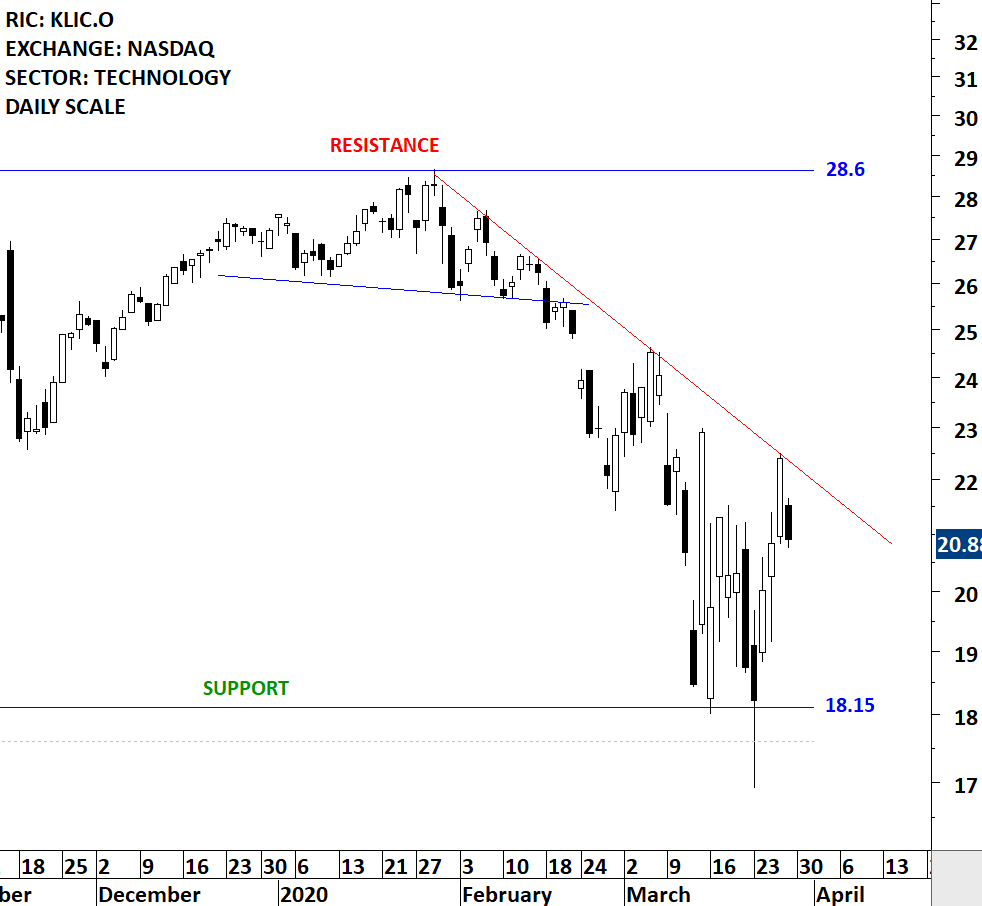
Kulicke and Soffa Industries, Inc. designs, manufactures and sells capital equipment and expendable tools used to assemble semiconductor devices, including integrated circuits (ICs), high and low powered discrete devices, light-emitting diodes (LEDs) and power modules. The stock is listed on the Nasdaq Stock Exchange. Price chart formed a 2 year-long rectangle with the horizontal boundaries acting as strong support at 18.15 levels and resistance at 28.6 levels. Both boundaries were tested several times over the course of the chart pattern. A daily close below 17.6 levels will confirm the breakdown from the 2 year-long rectangle with the possible chart pattern price target of 11.6 levels. Until a breakdown takes place the stock can offer a trading opportunity between the wide range 18.15-28.6. A re-test of the previous low and the support area can form a short-term reversal chart pattern. The daily chart is added below. (Data as of March 27, 2020)
Tech Charts Membership

By becoming a Premium Member, you’ll be able to improve your knowledge of the principles of classical charting.
With this knowledge, you can merge them with your investing system. In fact, some investors use my analyses to modify their existing style to invest more efficiently and successfully.

As a Premium Member of Aksel Kibar’s Tech Charts,
You will receive:
-
Global Equities Report. Delivered weekly.
-
Classical charting principles. Learn patterns and setups.
-
Actionable information. Worldwide indices and stocks of interest.
-
Risk management advice. The important trading points of each chart.
-
Information on breakout opportunities. Identify the ones you want to take action on.
-
Video tutorials. How patterns form and why they succeed or fail.
-
Watch list alerts. As they become available so you can act quickly.
-
Breakout alerts. Usually once a week.
-
Access to everything (now and as it becomes available)o Reports
o Videos and video series -
Multi-part webinar course. You learn the 8 most common charting principles.
-
Webinars. Actionable and timely advice on breaking out chart patterns.
For your convenience your membership auto renews each year.

