GLOBAL EQUITY MARKETS – June 29, 2019
REVIEW
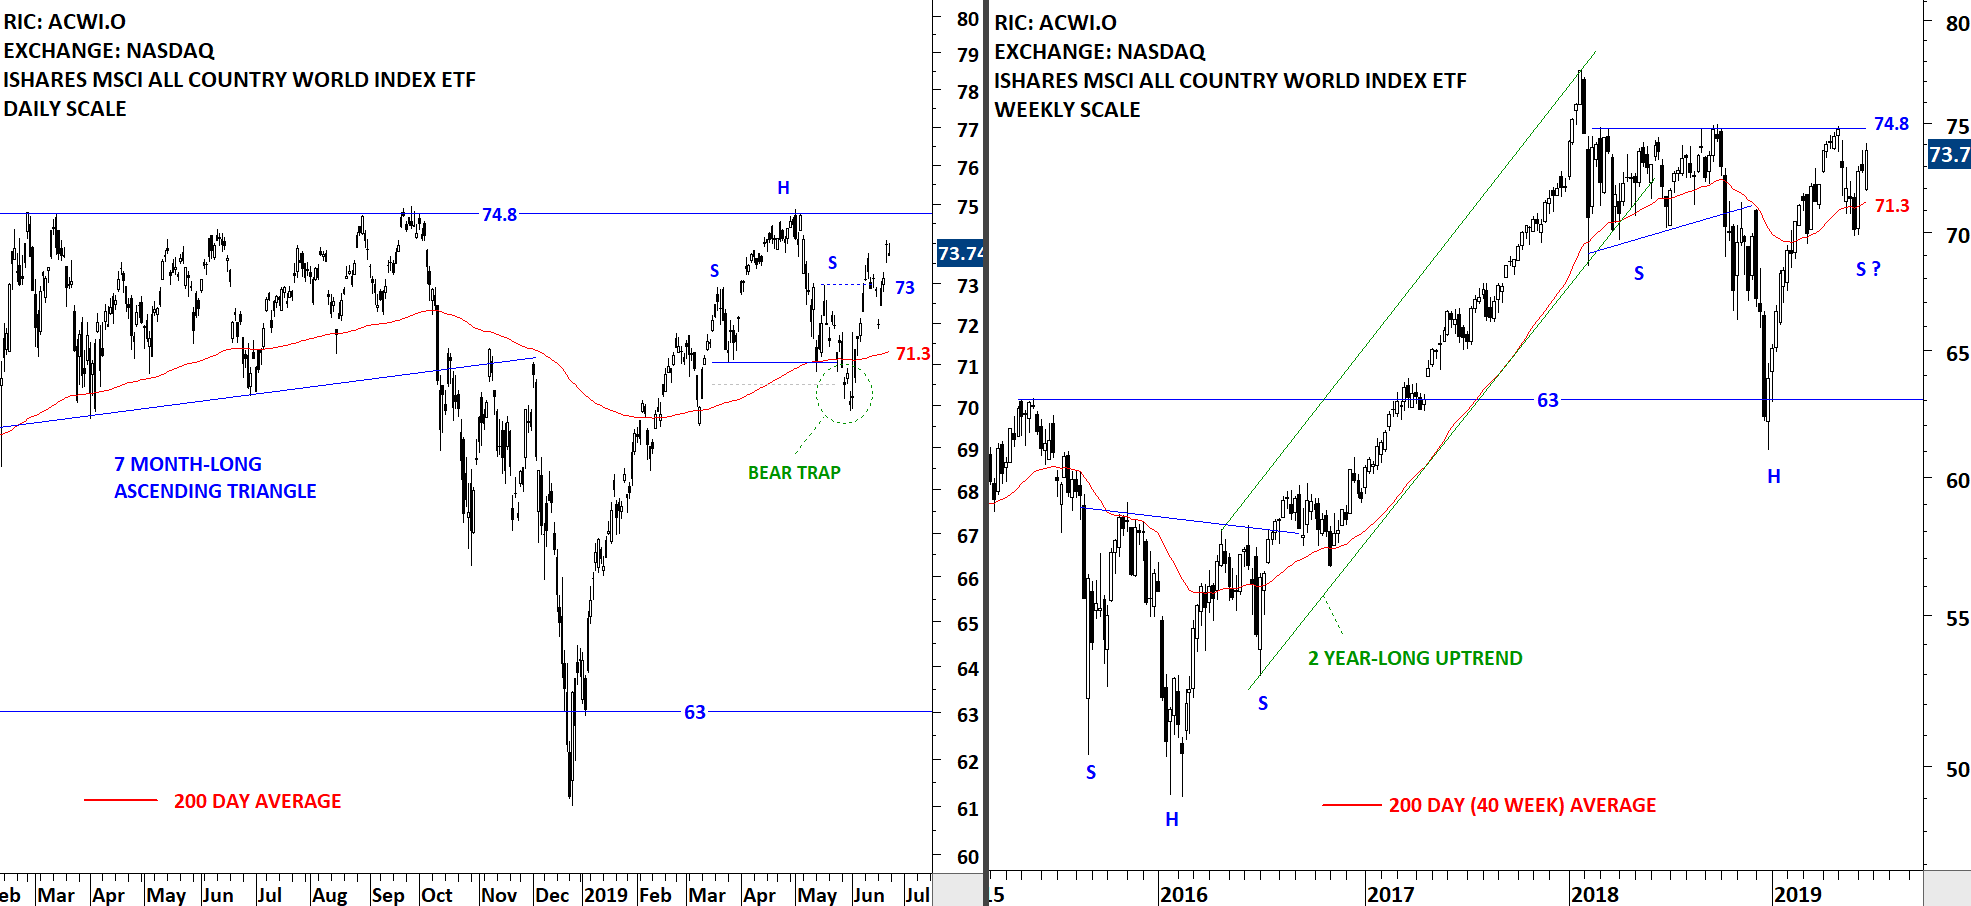
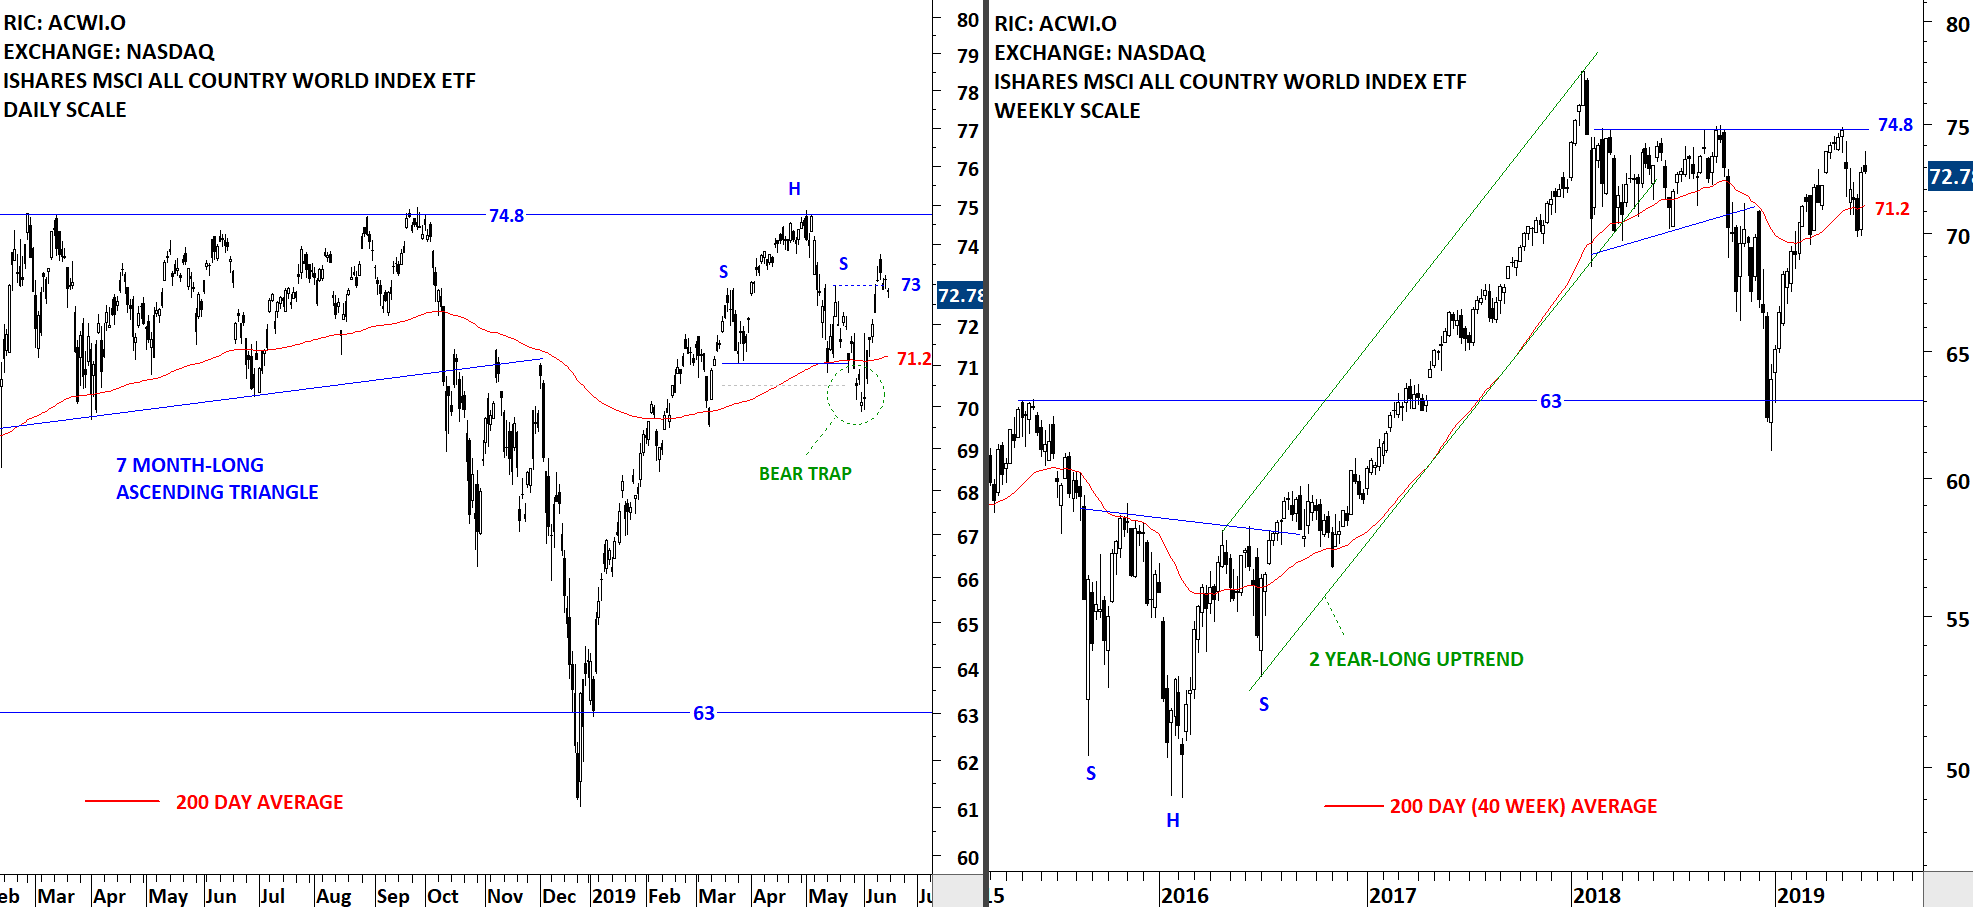
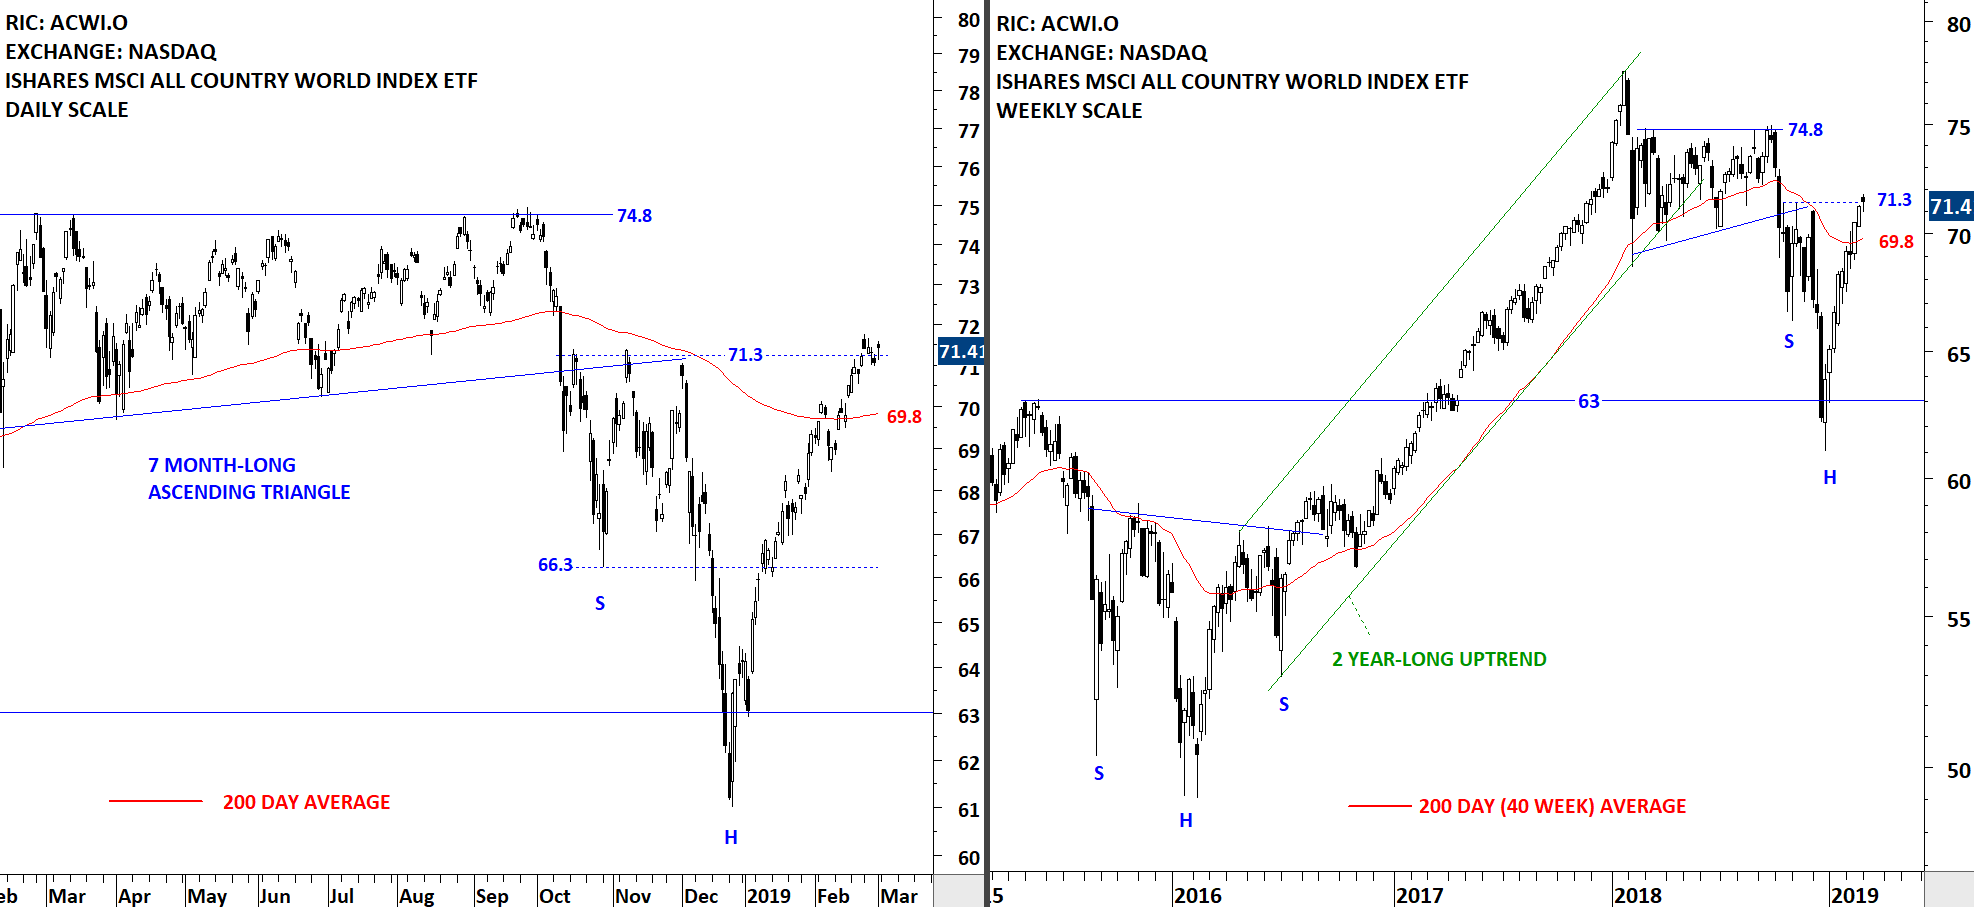
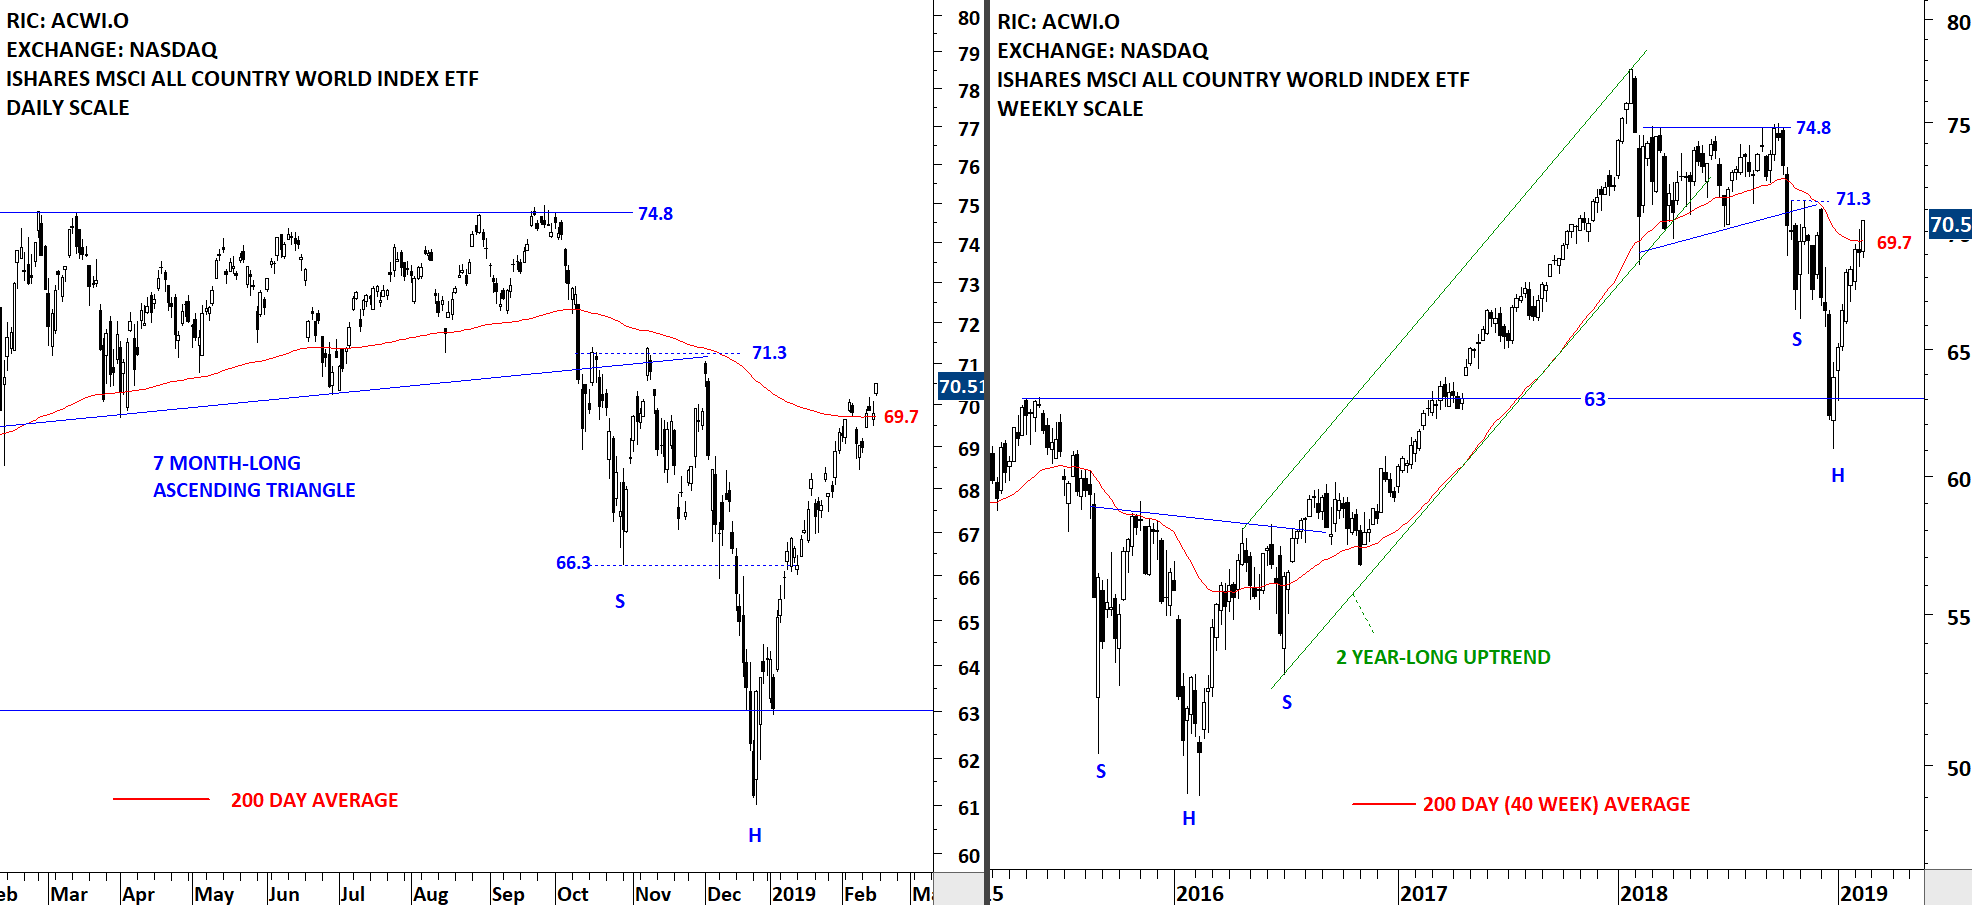
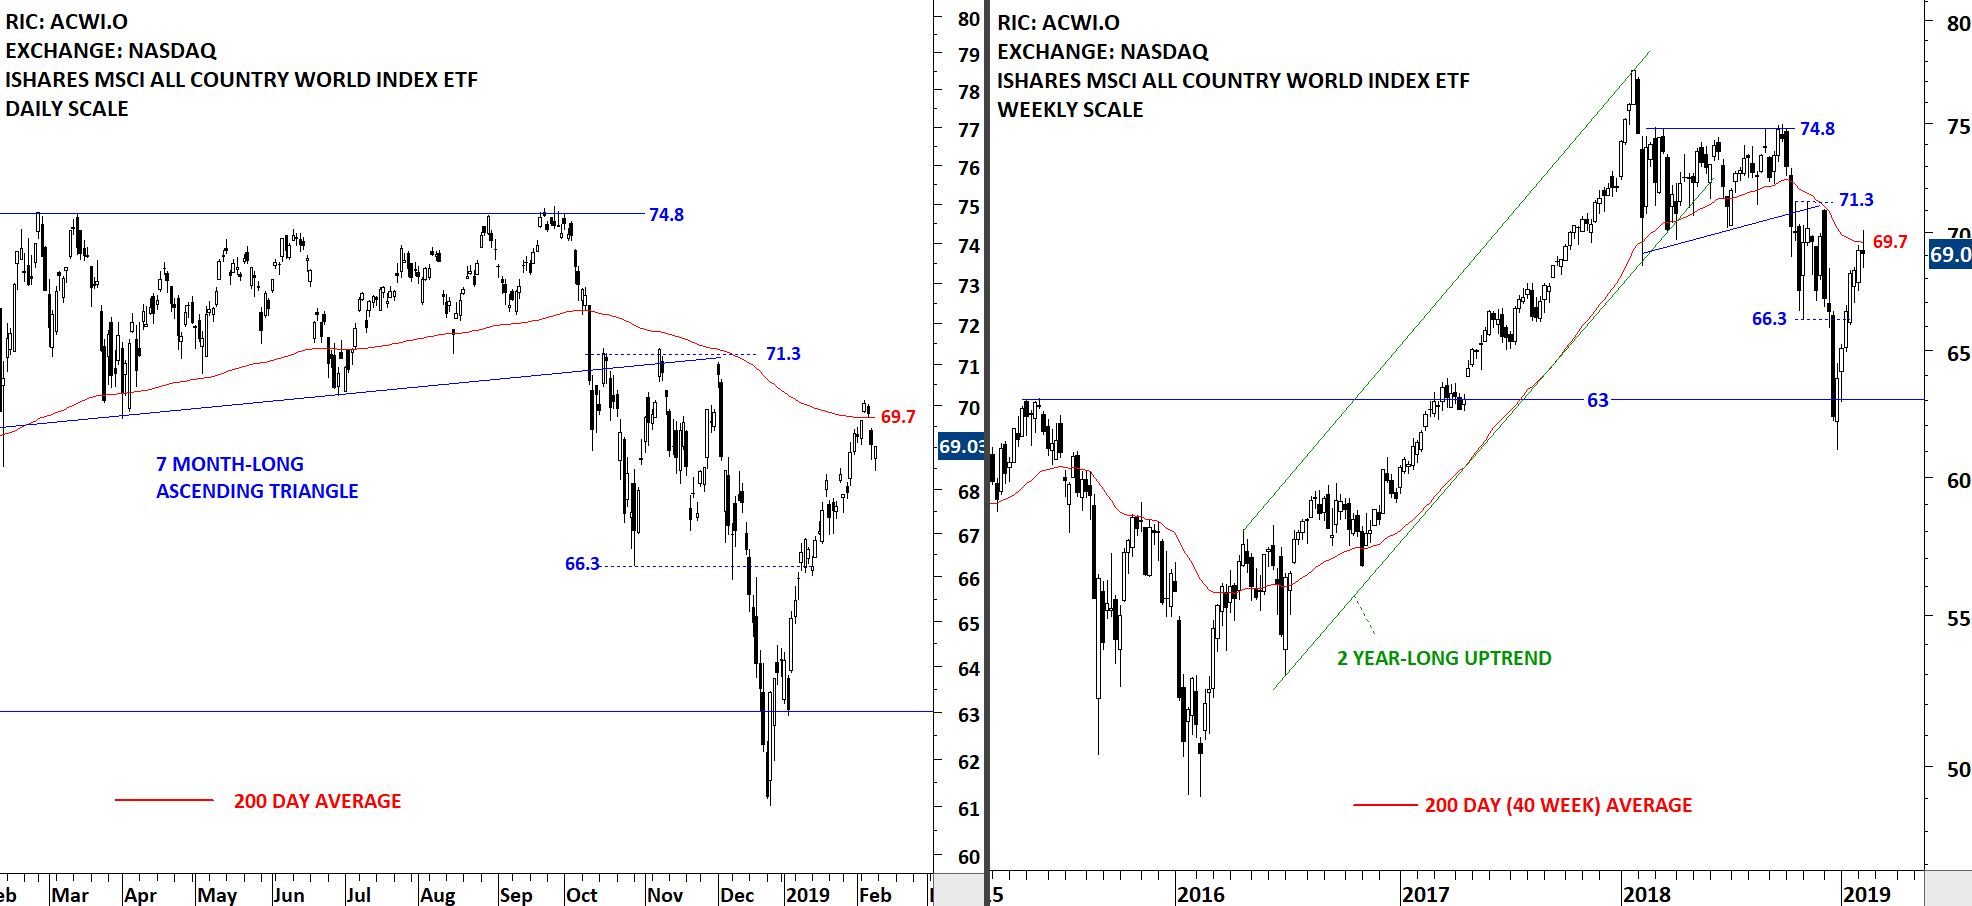
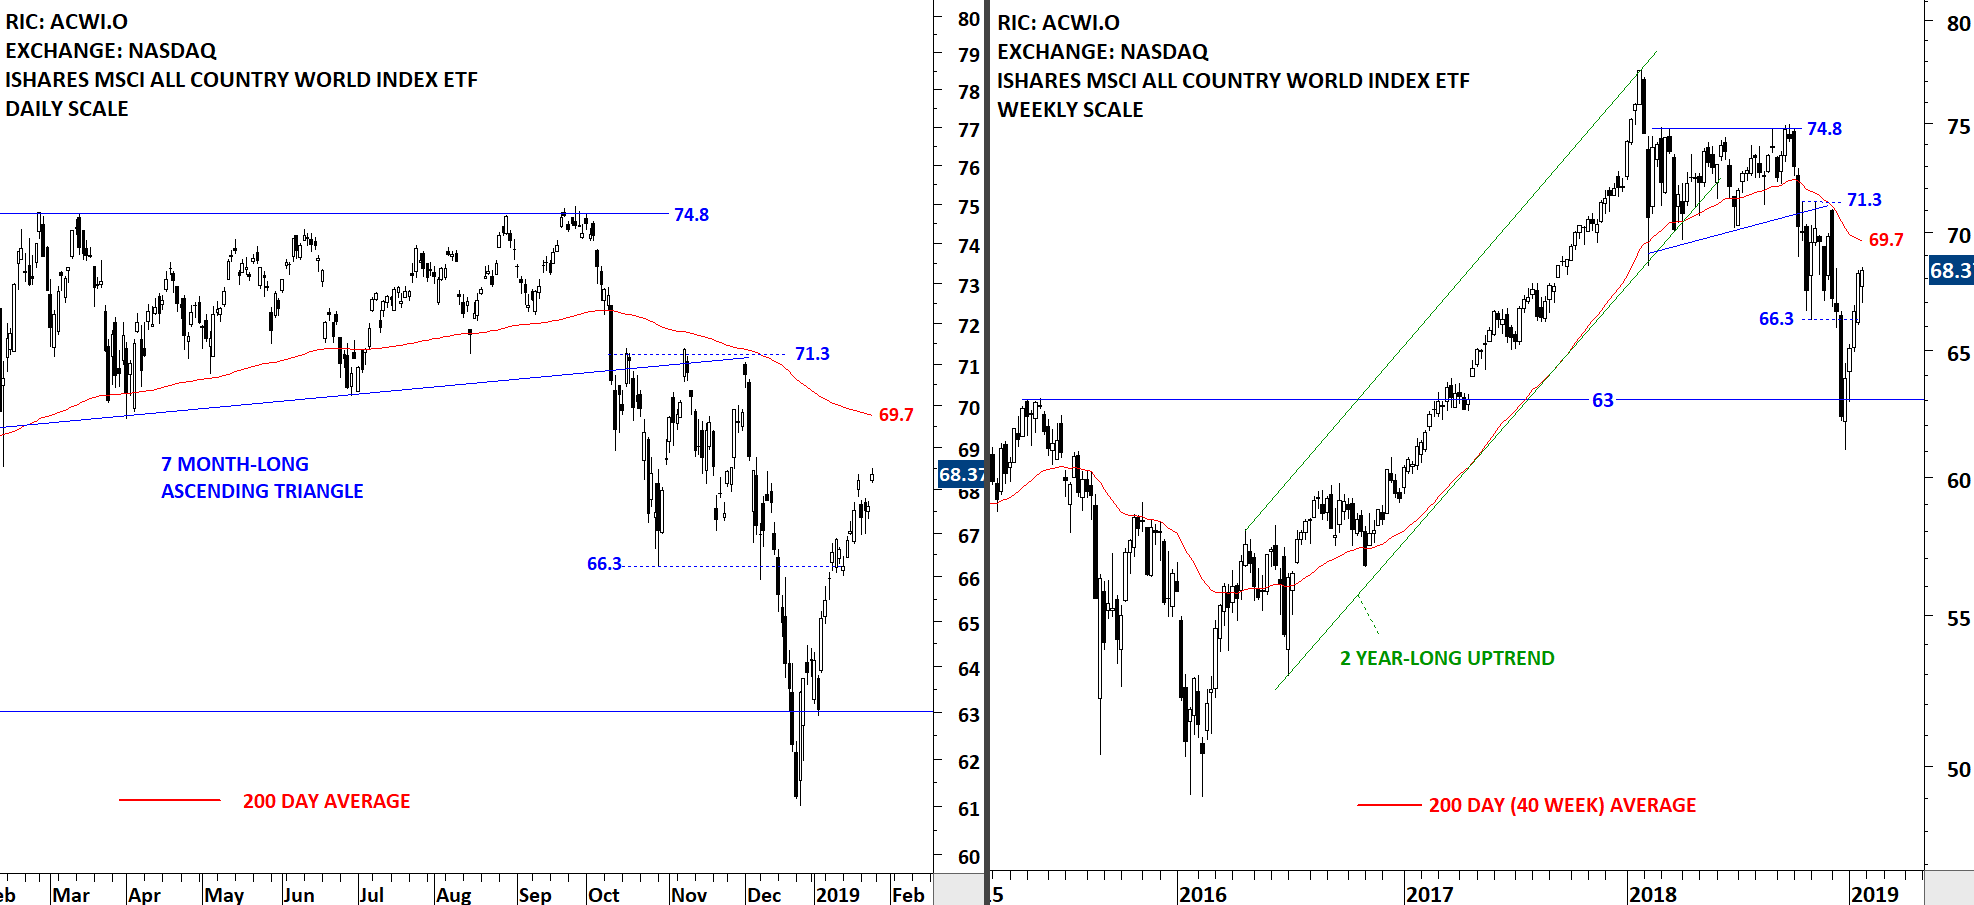
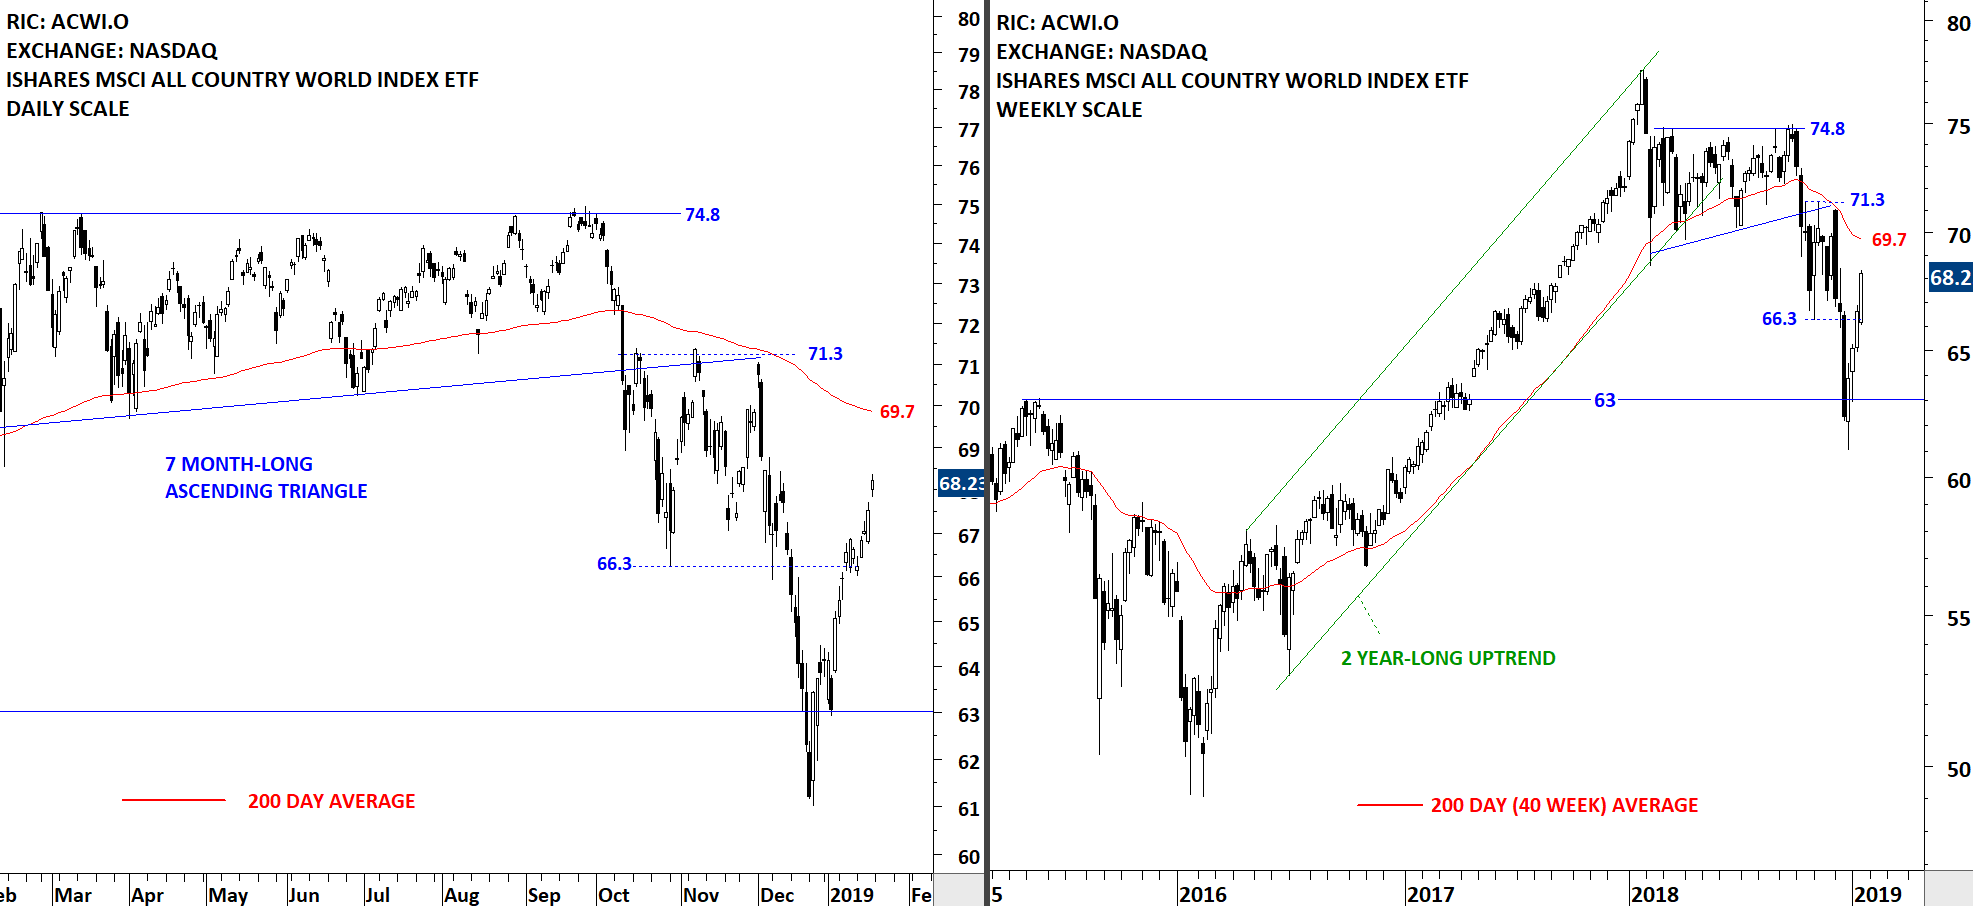
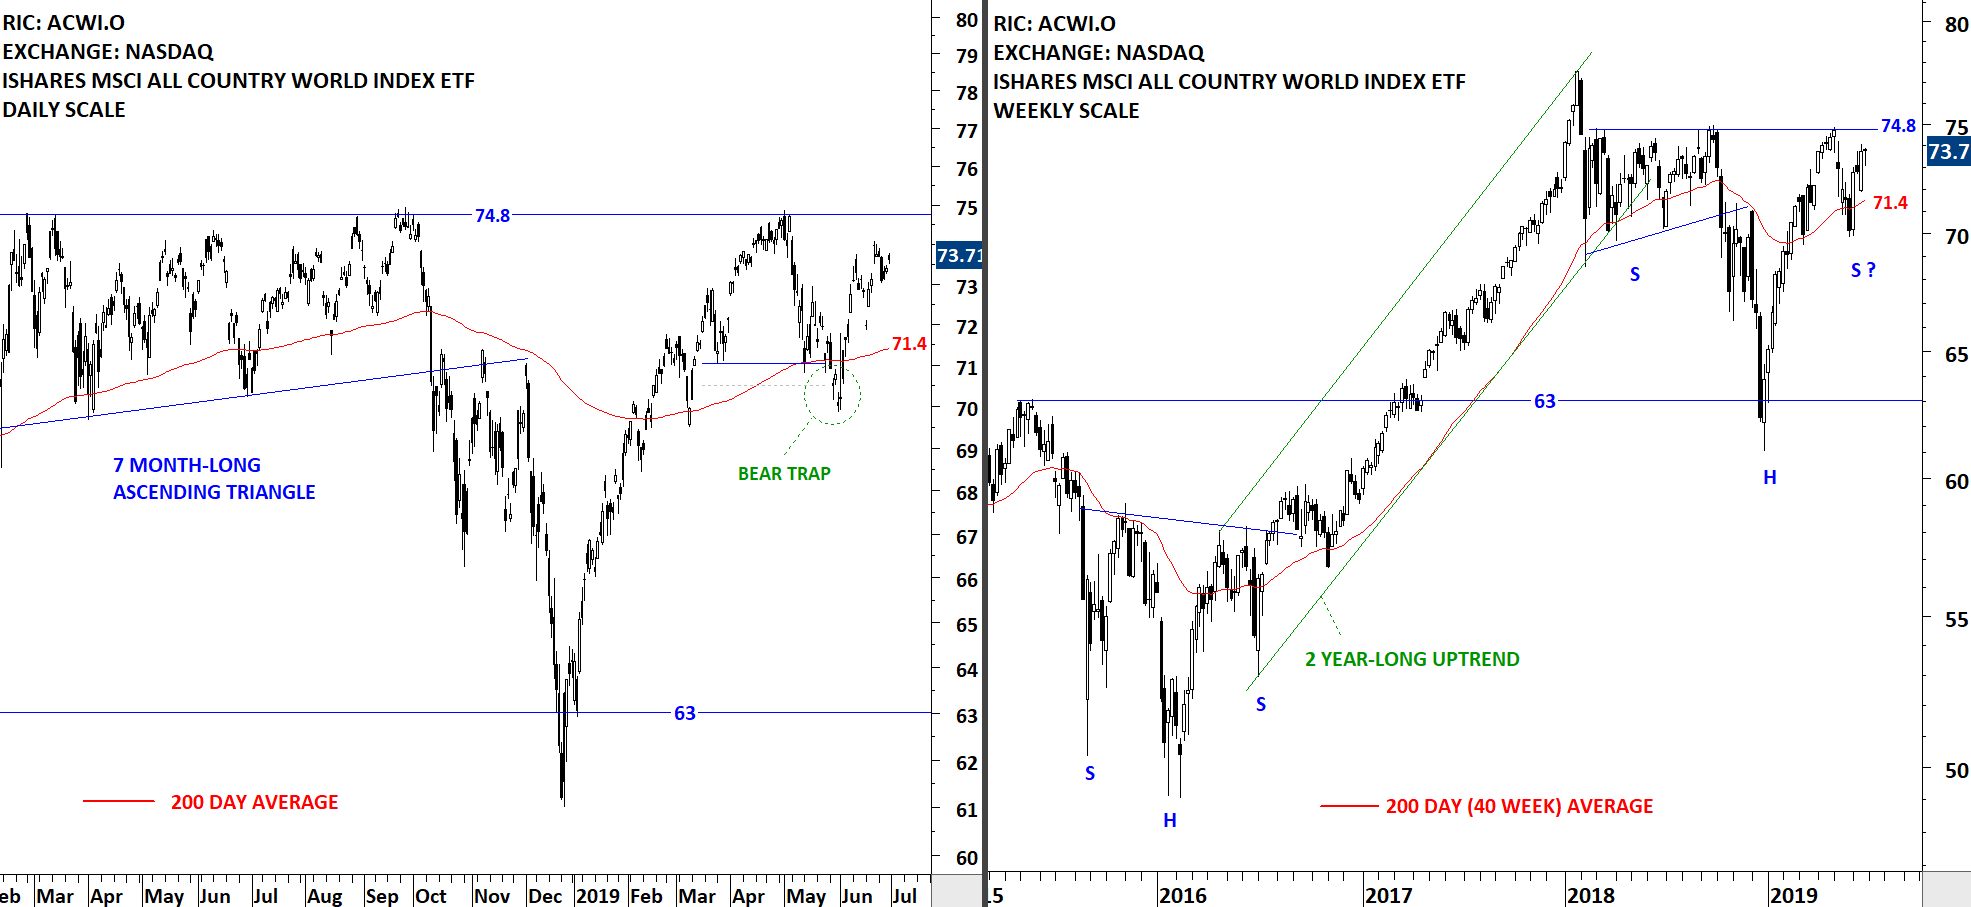
The benchmark for the Global equity markets performance, the iShares MSCI All Country World Index ETF continues to remain in a range between the horizontal resistance at 74.8 and the 200-day moving average at 71.4 levels. In the previous report I discussed the possibility of a H&S continuation chart pattern with the neckline standing at 74.8 levels. Price can continue to consolidate between the two important technical levels. A breakout above the horizontal resistance will be very positive for Global equities.
 Read More