H&S CONTINUATION
Head and shoulder chart pattern can form as a continuation on price charts. In uptrends, a H&S continuation will be similar to a H&S bottom and in downtrends it will resemble an inverse H&S. The implications and interpretations continuation H&S are usually the same with reversals. Price objectives can be derived in the same way as it is calculated on a reversal chart pattern.
Head and shoulder continuation is one of my favorite chart pattern. A head and shoulder continuation that forms in an uptrend, will usually breakout to all-time highs once the chart pattern is completed. Breakout to all-time highs from bullish continuation chart patterns are usually reliable and powerful.
A head and shoulder continuation that forms in a downtrend will usually take out the minor lows and move in the path of least resistance. Price that is already in a downtrend is likely to accelerate on the downside (sometimes in a sharp fall) as it breaks down a well-defined horizontal support.
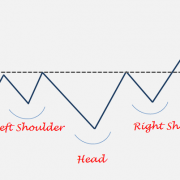
Below are some examples of H&S continuation chart patterns in up and down trends.
Read More
