Posts

iShares MSCI UAE Capped ETF

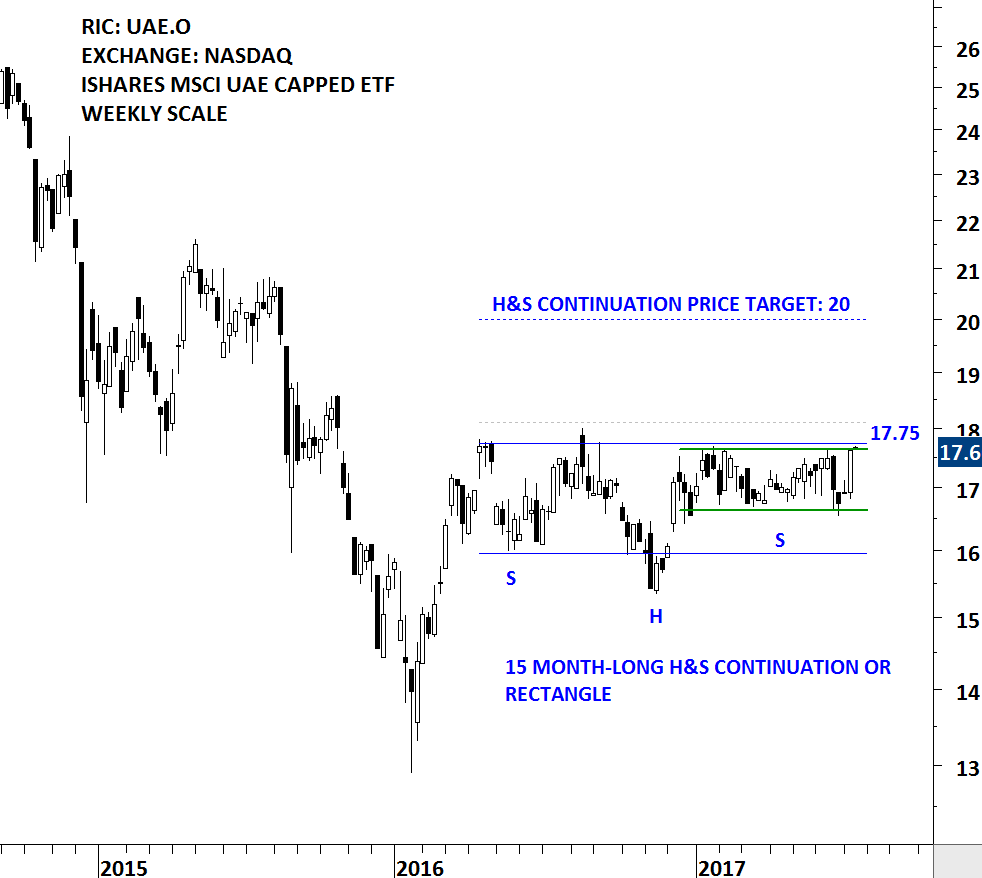
The Fund seeks to track the investment results of the MSCI All UAE Capped Index, which is designed to measure the equity market performance in the United Arab Emirates. The Fund generally invests at least 80% of its assets in securities of the underlying index or in depository receipts representing securities of the underlying index. The ETF is listed on the Nasdaq Stock Exchange. Price chart possibly formed a 15 month-long H&S continuation or a rectangle with the strong horizontal boundary standing at 17.75 levels. Last 6 month's price action can also be identified as a rectangle; another short-term consolidation, usually acting as a preparation for a breakout. A daily close above 18.10 levels will confirm the breakout from the multi-month trading range with the chart pattern price target of 20 levels. Top 10 holdings of the iShares MSCI UAE Capped ETF is compiled in a table below. Also you can find below some examples of H&S continuation chart patterns that Tech Charts Global Equity Markets reports featured in the past issues.
Read More

GLOBAL EQUITY MARKETS – July 1, 2017

REVIEW


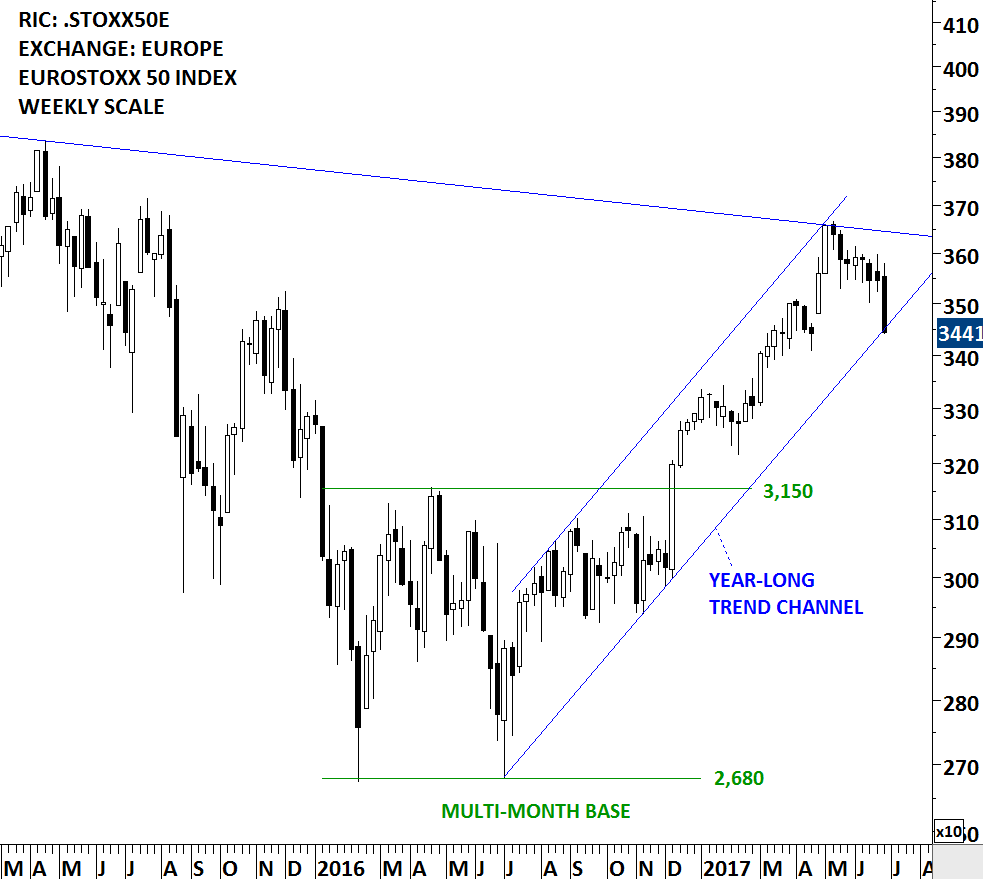
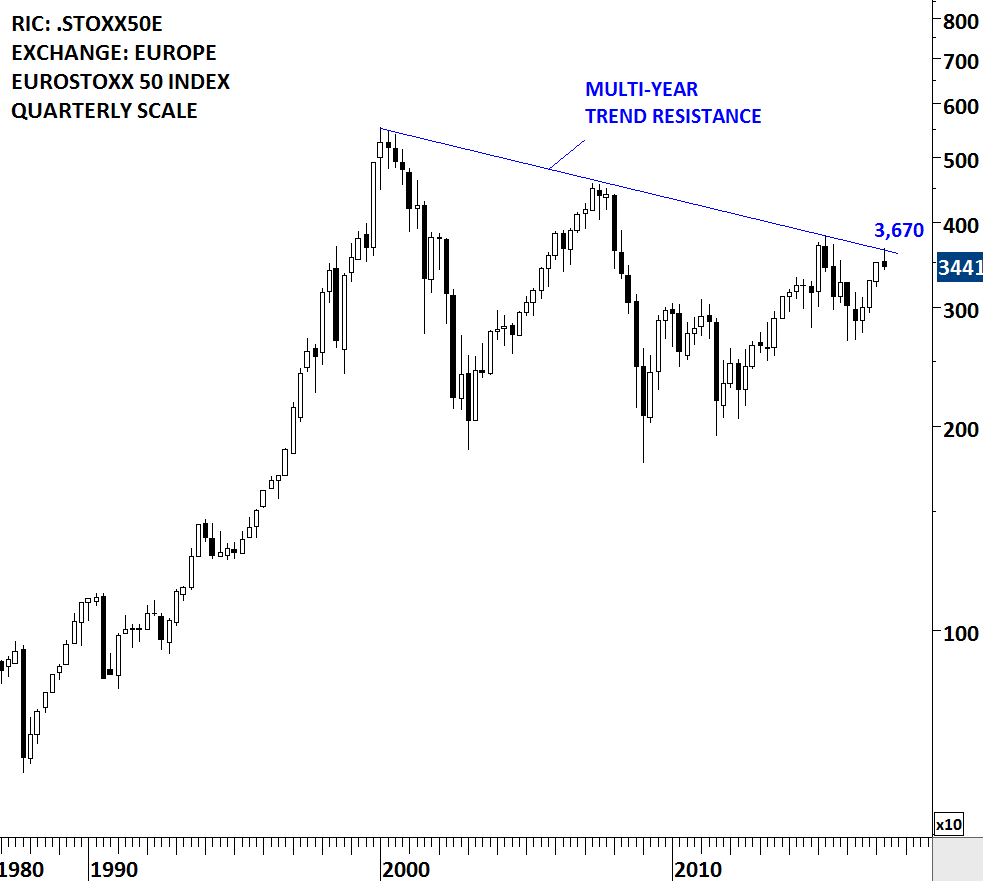
Europe's equity benchmarks tested critical long-term resistances. After reversing from the multi-year trend line, Euro Stoxx 50 index pulled back to the lower boundary of its year-long trend channel. If the 2 month-long correction has run its course (still no sign of reversal), Europe's equity benchmark can possibly rebound from the lower boundary of its trend channel. During May 2017 the index tested 3,670 levels and since then retreated towards the lower boundary of its year-long trend channel. Failure to hold at the lower boundary of the trend channel can extend the duration of the corrective period.

Read More

GLOBAL EQUITY MARKETS – June 3, 2017

This week's Global Equity Markets report covers several ETFs and global equity indices and single stocks from Developed and Emerging countries. You will find that some of the themes are longer-term and can offer great opportunity once these chart patterns are resolved on the upside. The info-graphic below explains what each label on the charts and section headers stand for. I hope this will make it easier to navigate through the charts.

Read More