Posts

NATURAL GAS and COCOA

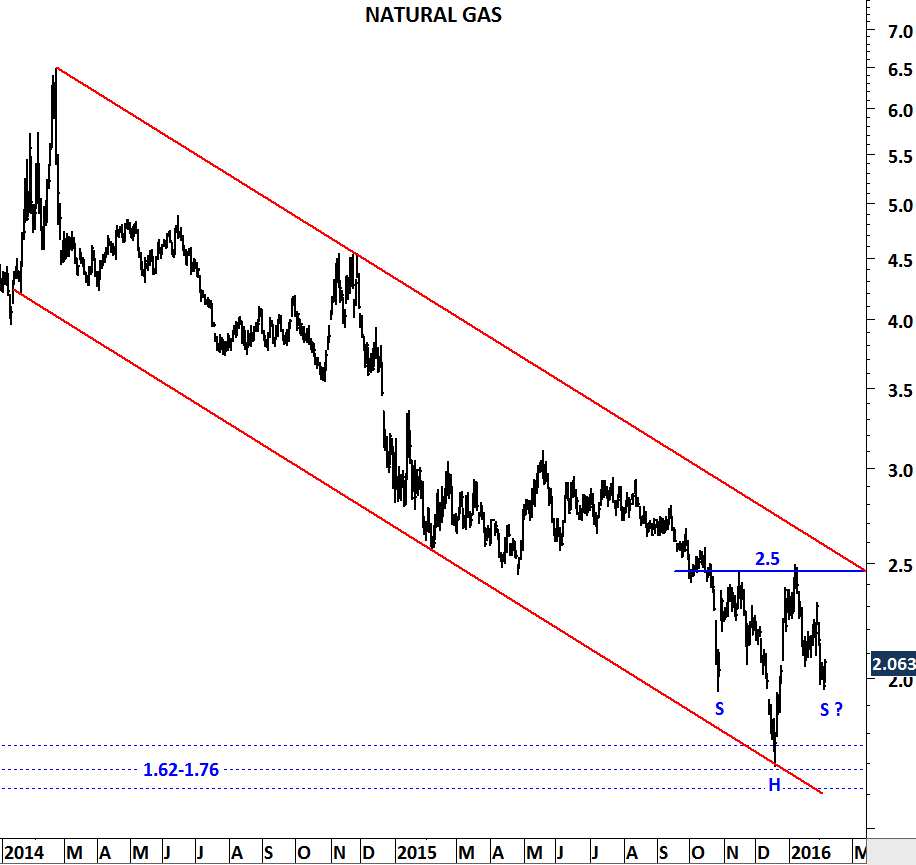
Long-term price chart of Natural Gas suggests that the volatile commodity is now trying to recover from historical strong support area. Over the past two decades Natural Gas (Henry Hub) prices traded as low as 1.62. There has been several instances when price reversed sharply from the strong support area between 1.62 and 1.76.

NGAS I

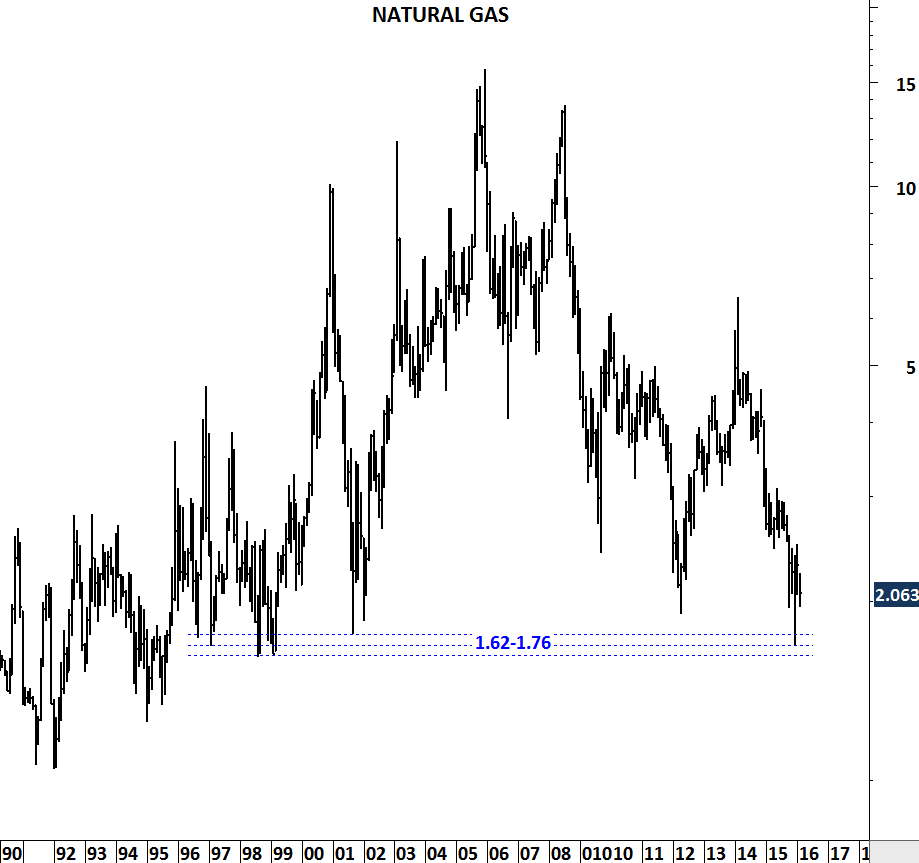
Natural Gas might be forming a base formation above strong support area. Possible head and shoulder bottom might be completing with the right shoulder now testing the left shoulder price level and forming symmetry. It is important to note that a breakout above 2.5 levels will confirm the H&S base formation and suggest higher levels in the following months.

NGAS II

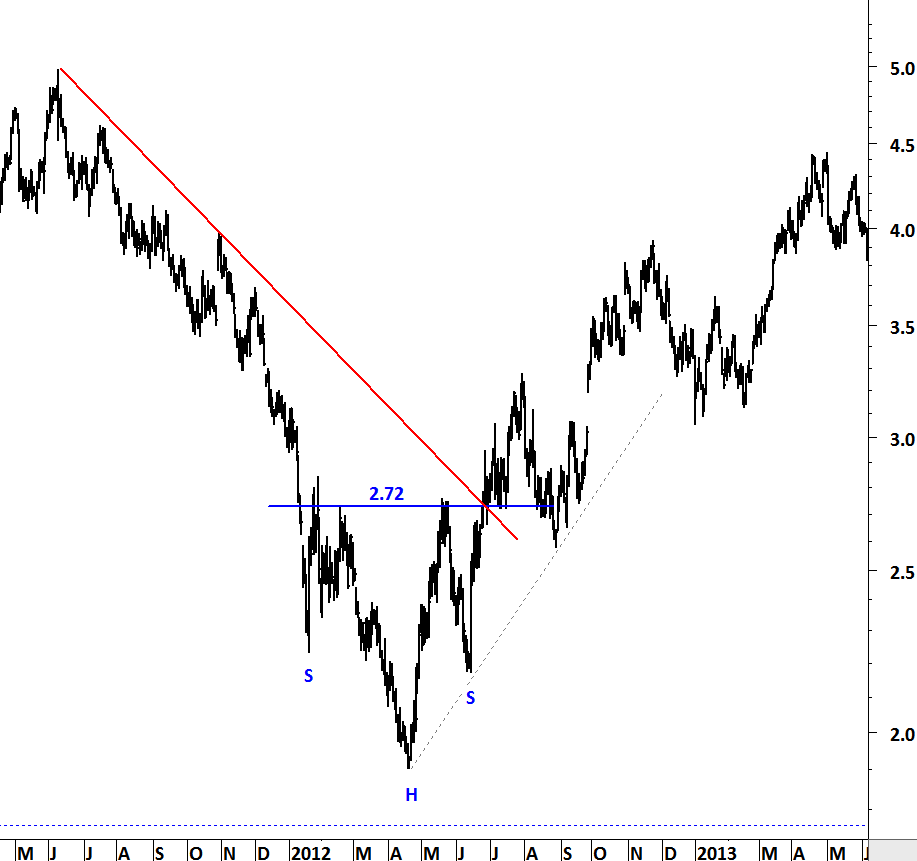
Head and shoulder bottom and top chart patterns usually form after prolonged down/up trends. Natural gas has been in a consistent downtrend since the beginning of 2014. A similar reversal took place in 2012 after the energy price fell from 5 levels to 1.9 in less than a year. Below chart shows the base formation (head and shoulder bottom) in the first half of 2012.

NGAS III

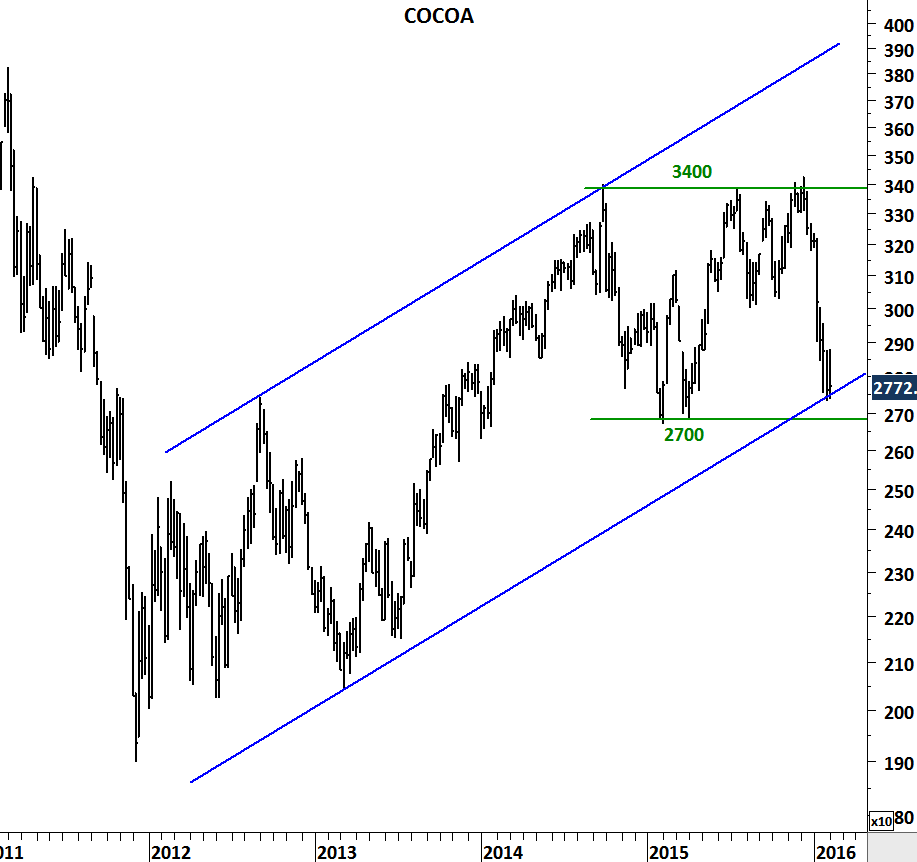
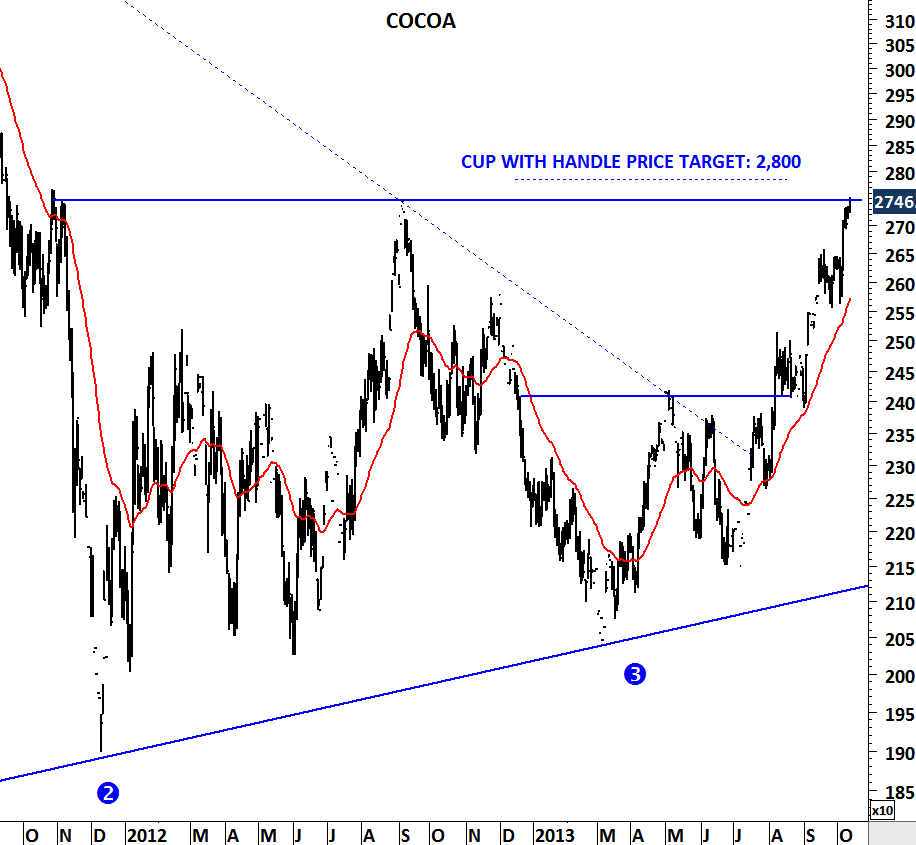
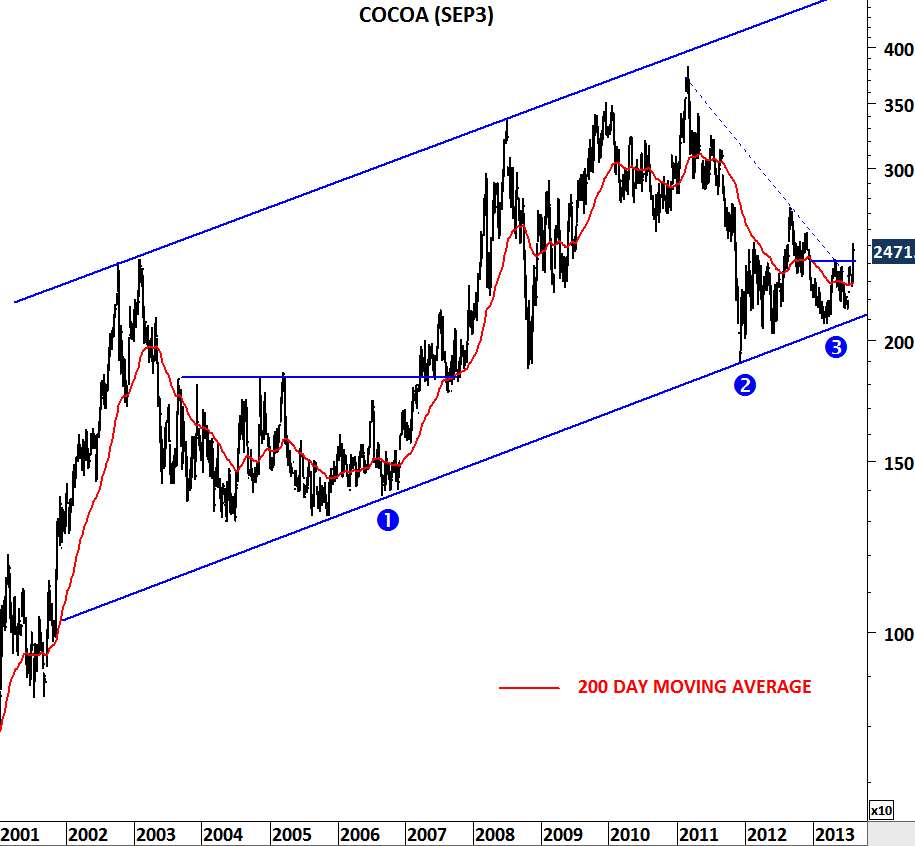
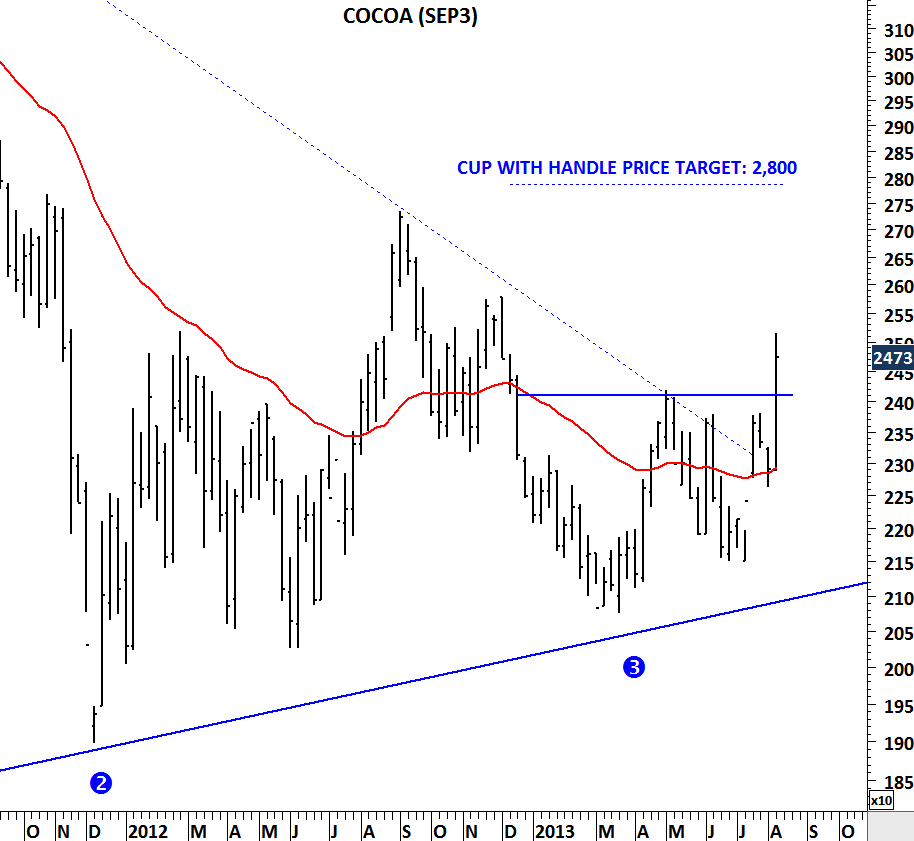
Cocoa is another commodity that could enjoy higher prices in the following weeks/months if strong trend channel and horizontal support holds. Last one year’s consolidation has been between 2700 and 3400 levels. Price is now back to 2700 levels. While long-term trend is upwards, intermediate-term trend is still sideways. Though, Cocoa can present a low risk/reward entry around the strong support level.

COCOA

COCOA & SOY MEAL

COCOA

I analyzed Cocoa prices in October and drew attention to the strong horizontal resistance at 2,800 levels. That study needs an update now as the price is challenging the strong resistance for a possible breakout. Higher prices could be seen in the following weeks once this base formation completes with a similar breakout that took place in the beginning of 2007.

SOY MEAL

Soy Meal is another commodity that could move higher in the following weeks as the price finds support between 380 and 390 for the 5th time over the past two years. Last one year’s trading range has been between 380 and 550. A buy signal on weekly MACD, similar to earlier reversals, will confirm the bullish outlook for the short/medium-term. Price could target 550 levels once again.

COCOA

COCOA

COCOA daily

Cocoa moved higher after its breakout from the base formation – a cup with handle. This chart pattern is usually regarded as bullish and a breakout above the horizontal resistance suggest higher prices. Price target is calculated by adding the width of the formation to the breakout level. In the beginning of August (August 8, 2013), I’ve analyzed Cocoa prices and drew attention to the breakout and calculated a price target of 2,800. Since then prices have climbed higher and reached the formation price target.

Cocoa can slow down at these levels but a breakout above this flat resistance could send prices higher resulting in a similar uptrend that took place between 2007 and 2008.


COCOA (SEP3)

COCOA I COCOA II

Cocoa prices might be forming a short/medium-term base at the long-term trend channel support. Cocoa had sharp and wide swings over the past decade. The uptrend remained intact as it can be seen from the upward sloping trend channel. In the beginning of 2011, price reversed from the upper boundary of the trend channel at 4,000 levels and reached the lower boundary at 2,000. Since then the soft commodity has been consolidating above the long-term trend channel support. With this week’s breakout above 2,400 levels Cocoa might be forming a cup & handle chart pattern, usually regarded as a bullish chart formation that could target 2,800 levels. In the short-term technical outlook on Cocoa turns positive. As long as price remains above 2,400 levels, the soft commodity will have an upward bias.