Posts

GLOBAL EQUITY MARKETS – August 3, 2019

REVIEW


The benchmark for the Global equity markets performance, the iShares MSCI All Country World Index ETF (ACWI.O) failed to break above the strong horizontal resistance once again. Failure to break above the strong resistance resulted in a pullback towards the long-term average at 72 levels. On Friday the ETF tested the 200-day and closed the day off its lows. If we see the price stabilizing above the support at 72, the new trading range can become 72 and 74.8. Failure to hold above the 200-day can result in a larger scale correction. Next support is at 70 levels.

Read More

GLOBAL EQUITY MARKETS – July 27, 2019

REVIEW


The benchmark for the Global equity markets performance, the iShares MSCI All Country World Index ETF (ACWI.O) continues to challenge the strong horizontal resistance at 74.8 levels. A breakout can be very positive for Global equities. Failure at the strong resistance can result in a pullback towards the long-term average at 71.9 levels.

Read More

GLOBAL EQUITY MARKETS – July 20, 2019

REVIEW


The benchmark for the Global equity markets performance, the iShares MSCI All Country World Index ETF (ACWI.O) is testing the horizontal resistance at 74.8 levels. Breakout can be positive for Global equities. This week's price action once again challenged the horizontal resistance at 74.8 levels. I'm monitoring ACWI ETF for a possible breakout to all-time highs. The 200-day moving average at 71.9 levels will act as support during any pullback.

Read More

GLOBAL EQUITY MARKETS – July 13, 2019

REVIEW


The benchmark for the Global equity markets performance, the iShares MSCI All Country World Index ETF (ACWI.O) is testing the horizontal resistance at 74.8 levels. Breakout can be positive for Global equities. There are several major equity benchmarks that are testing long-term resistance levels. I'm weighing the possibility of a breakout to all-time highs. Usually top reversals do not take place after several tests of horizontal resistance. In this case, several tests of the horizontal boundary can be an indication of a breakout to all-time highs and the continuation of the existing uptrend. The 200-day moving average at 71.6 levels will act as support during any pullback.

Read More

GLOBAL EQUITY MARKETS – July 6, 2019

REVIEW


The benchmark for the Global equity markets performance, the iShares MSCI All Country World Index ETF (ACWI.O) is now testing the horizontal resistance at 74.8 levels. Breakout can be positive for Global equities. This week's candlestick shows that 74.8 levels remains a resistance. The 200-day moving average at 71.5 levels will act as support during any pullback.

Read More

GLOBAL EQUITY MARKETS – June 29, 2019

REVIEW


The benchmark for the Global equity markets performance, the iShares MSCI All Country World Index ETF continues to remain in a range between the horizontal resistance at 74.8 and the 200-day moving average at 71.4 levels. In the previous report I discussed the possibility of a H&S continuation chart pattern with the neckline standing at 74.8 levels. Price can continue to consolidate between the two important technical levels. A breakout above the horizontal resistance will be very positive for Global equities.

Read More

GLOBAL EQUITY MARKETS – June 22, 2019

REVIEW


The benchmark for the Global equity markets performance, the iShares MSCI All Country World Index ETF (ACWI.O) remains above its 200-day average. Strong resistance stands at 74.8 levels and the 200-day moving average as support at 71.3 levels. The weekly scale price chart can form a possible H&S continuation. So far the right shoulder formed symmetry in price but not in time. In other words the time it took for the left shoulder has been longer than the right shoulder. Perfect symmetry is rare. Breakout above 74.8 levels will be positive for Global equities.

Read More

GLOBAL EQUITY MARKETS – June 15, 2019

REVIEW


The benchmark for the Global equity markets performance, the iShares MSCI All Country World Index ETF (ACWI.O) held onto its past week's gains. The ETF didn't move much and remained in a range between the 200-day moving average at 71.2 and the horizontal resistance at 74.8 levels. There is no clear trend or a recognizable chart pattern in the short-term. The ETF offers short-term trading opportunity between the boundaries at 71.2 and 74.8.

Read More

GLOBAL EQUITY MARKETS – June 8, 2019

REVIEW


The benchmark for the Global equity markets performance, the iShares MSCI All Country World Index ETF (ACWI.O) had a sharp reversal above its 200-day average and the horizontal resistance at 71 levels. Previous week's breakdown from the H&S top was possibly a bear trap. Global equities are going through a volatile, trend-less period. Read More

SUPPORT & RESISTANCE

Every week Tech Charts Global Equity Markets report features some of the well-defined, mature classical chart patterns under a lengthy watchlist and the chart pattern breakout signals that took place during that week. Global Equity Markets report covers single stocks from developed, emerging and frontier markets, ETF’s and global equity indices. The report starts with a review section that highlights the important chart developments on global equity benchmarks. This blog post features from the watchlist section ADVANCE AUTO PARTS, listed on the New York Stock Exchange.

ADVANCE AUTO PARTS INC (AAP)

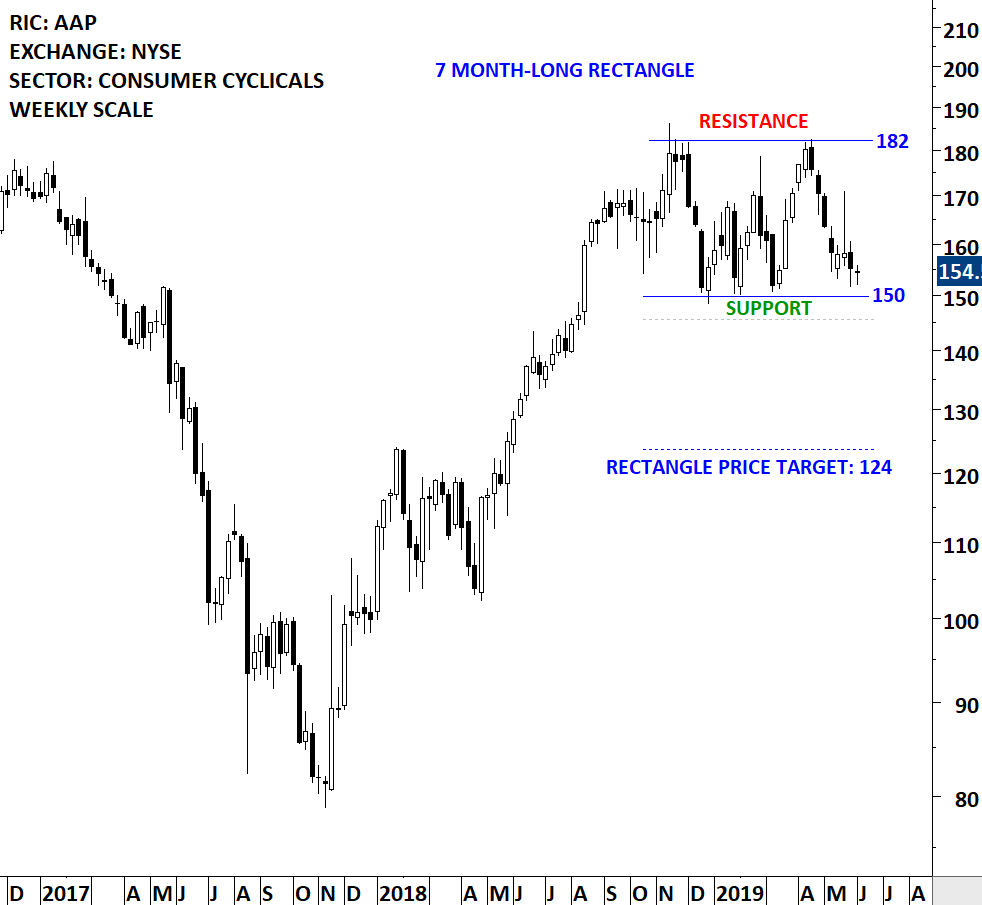
Advance Auto Parts, Inc. provides automotive aftermarket parts in North America, serving do-it-for-me (Professional) and do-it-yourself (DIY), customers. The Company’s stores and branches offer a selection of brand name, original equipment manufacturer (OEM) and private label automotive replacement parts, accessories, batteries and maintenance items for domestic and imported cars, vans, sport utility vehicles and light and heavy duty trucks. The stock is listed on the Nasdaq Stock Exchange. Price chart formed a 7 month-long rectangle with the upper boundary acting as resistance at 182 and the lower boundary as support at 150 levels. Both boundaries were tested several times over the course of the chart pattern. A daily close below 145.5 levels will confirm the breakdown from the 7 month-long rectangle with the possible chart pattern price target of 124 levels. Rectangle can act as a reversal as well as a continuation. Until there is a breakout above 182 levels or a breakdown below 150 levels the chart pattern offers a trading opportunity between the boundaries. (Data as of 04/06/2019 EST 12:30 pm)


Tech Charts Membership

By becoming a Premium Member, you’ll be able to improve your knowledge of the principles of classical charting.

With this knowledge, you can merge them with your investing system. In fact, some investors use my analyses to modify their existing style to invest more efficiently and successfully.

Get Access Now

As a Premium Member of Aksel Kibar’s Tech Charts,

You will receive:

  • Global Equities Report. Delivered weekly.
  • Classical charting principles. Learn patterns and setups.
  • Actionable information. Worldwide indices and stocks of interest.
  • Risk management advice. The important trading points of each chart.
  • Information on breakout opportunities. Identify the ones you want to take action on.
  • Video tutorials. How patterns form and why they succeed or fail.
  • Watch list alerts. As they become available so you can act quickly.
  • Breakout alerts. Usually once a week.
  • Access to everything (now and as it becomes available)
    o Reports
    o Videos and video series
  • Multi-part webinar course. You learn the 8 most common charting principles.
  • Webinars. Actionable and timely advice on breaking out chart patterns.

For your convenience your membership auto renews each year.

Get Access Now