
Every week Tech Charts Global Equity Markets report features some of the well-defined, mature classical chart patterns under a lengthy watchlist and the chart pattern breakout signals that took place during that week. Global Equity Markets report covers single stocks from developed, emerging and frontier markets, ETF’s, select commodities, cryptocurrencies and global equity indices. Below charts, U.S. Dollar Index (DXY) is from the review section of the weekly report. It is featuring possible strength for the Dollar Index.
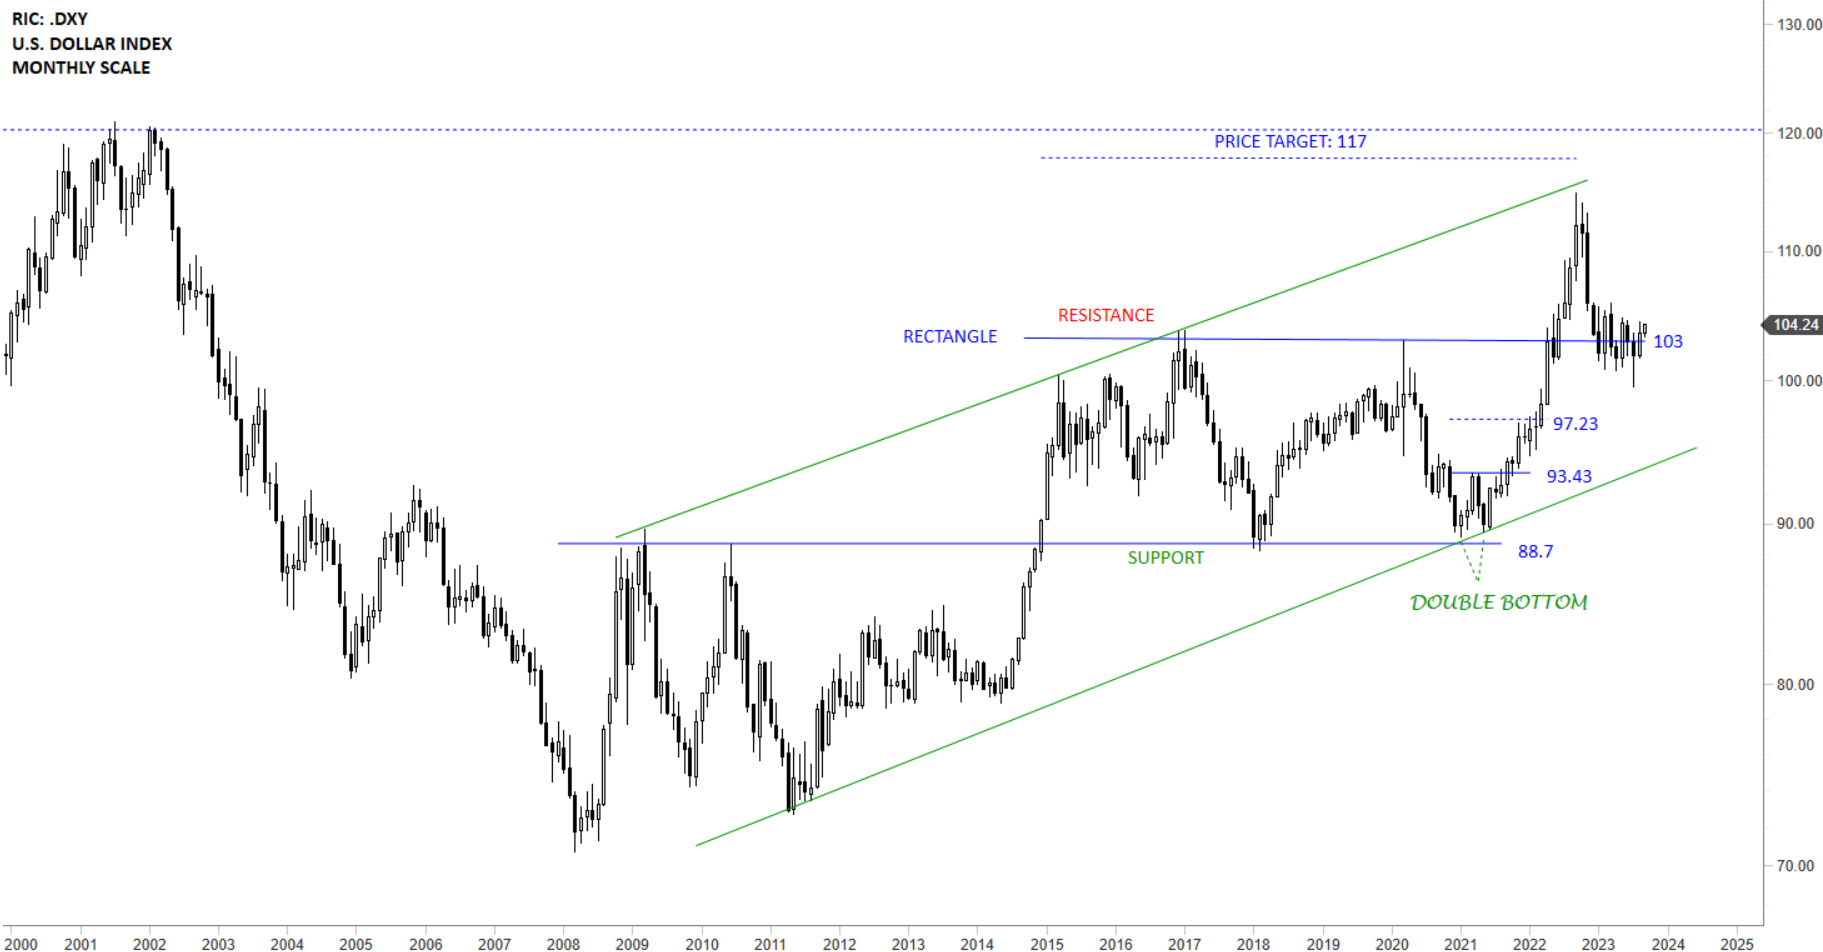
U.S. DOLLAR INDEX (DXY)
The USD Index is once again trying to recover above the horizontal support at 103 levels. Recovery above the horizontal support/resistance with a strong monthly close (September close will be important) can put the bullish interpretation (continuation of the existing long-term uptrend) on the cards.
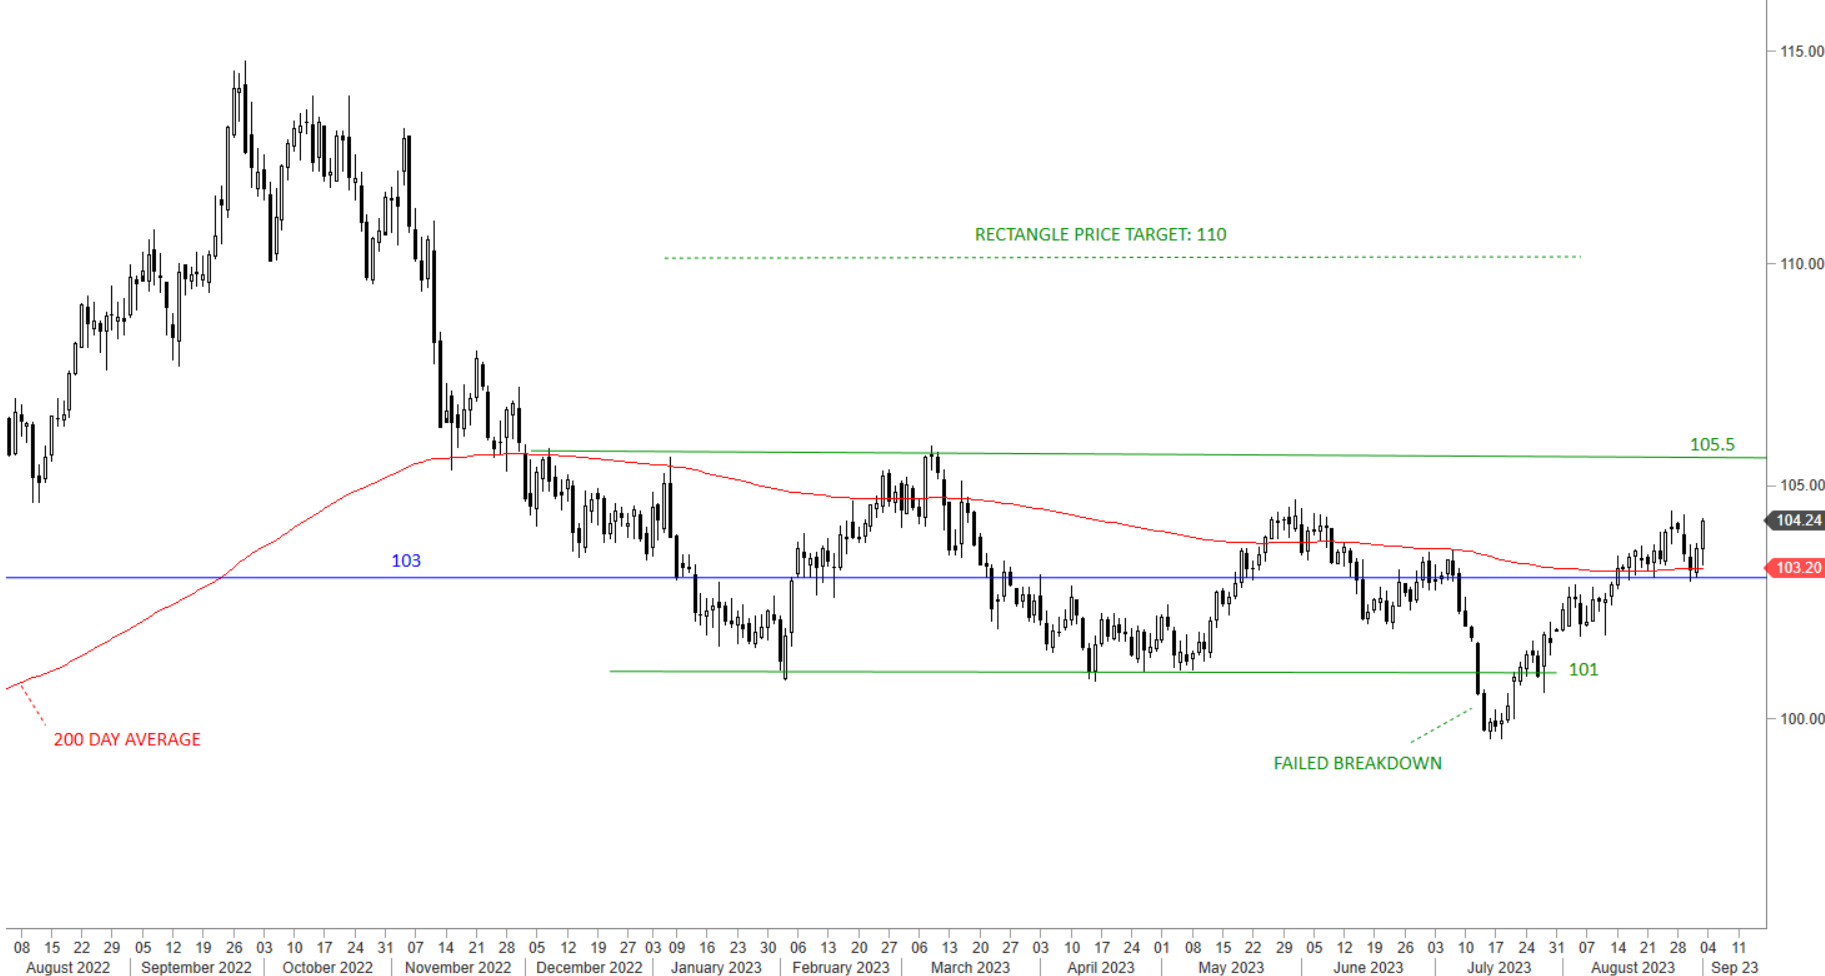
The daily scale price chart shows the consolidation and the breakdown of the support at 101 levels. With the sharp recovery above 101 levels, it became clear that the recent breakdown failed. This week’s price action was strong with price holding above the 200-day average. 103-103.2 area becomes the short-term support. Continued strength can target 105.5 resistance.
Tech Charts Membership

By becoming a Premium Member, you’ll be able to improve your knowledge of the principles of classical charting.
With this knowledge, you can merge them with your investing system. In fact, some investors use my analyses to modify their existing style to invest more efficiently and successfully.
Get Access Now [1]
As a Premium Member of Aksel Kibar’s Tech Charts,
You will receive:
-
Global Equities Report. Delivered weekly.
-
Classical charting principles. Learn patterns and setups.
-
Actionable information. Worldwide indices and stocks of interest.
-
Risk management advice. The important trading points of each chart.
-
Information on breakout opportunities. Identify the ones you want to take action on.
-
Video tutorials. How patterns form and why they succeed or fail.
-
Watch list alerts. As they become available so you can act quickly.
-
Breakout alerts. Usually once a week.
-
Access to everything (now and as it becomes available)o Reports
o Videos and video series -
Multi-part webinar course. You learn the 8 most common charting principles.
-
Webinars. Actionable and timely advice on breaking out chart patterns.
For your convenience your membership auto renews each year.
Get Access Now [1]