
Every week Tech Charts Global Equity Markets report features some of the well-defined, mature classical chart patterns under a lengthy watchlist and the chart pattern breakout signals that took place during that week. Global Equity Markets report covers single stocks from developed, emerging and frontier markets, ETF’s, select commodities, cryptocurrencies and global equity indices. Below charts are from the review section of the weekly report. It is featuring two major bottom reversal chart patterns on European equity benchmarks. I’m seeing similar setups on several single equities as well.
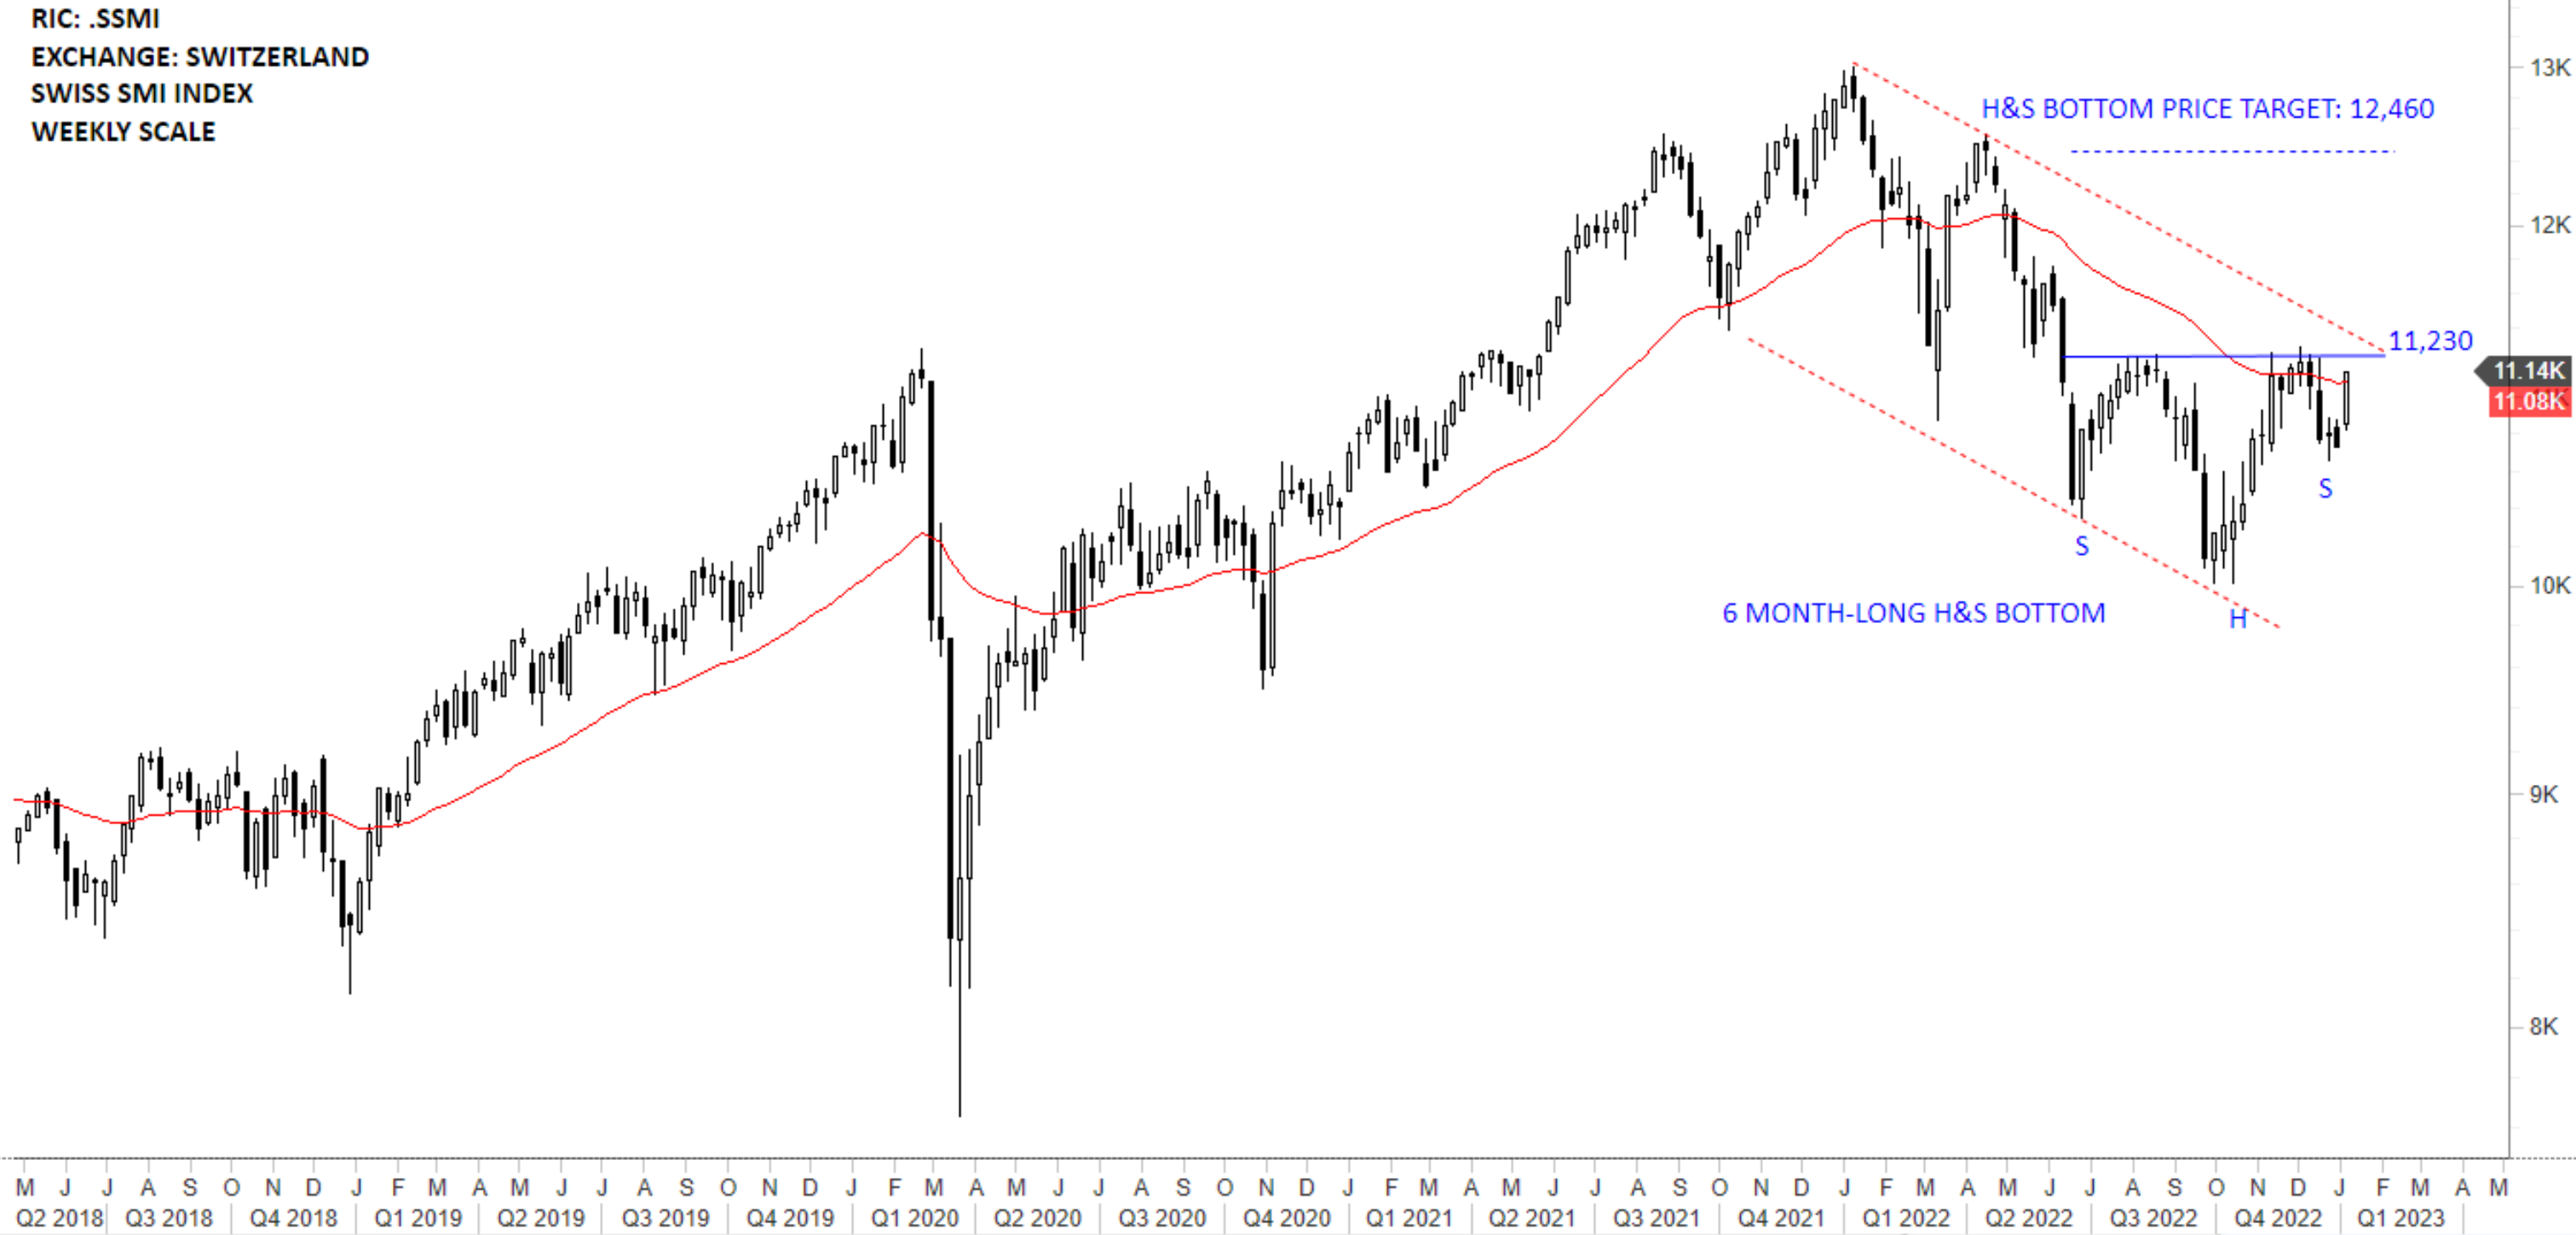
Several European stocks and equity benchmarks are forming possible H&S bottom reversals. One of them is the Swiss SMI with the 6 month-long H&S bottom reversal on the weekly scale price chart. The neckline stands at 11,230 levels. Breakout can clear the 200-day (40 week) average and target 12,460 levels. Next couple of weeks are going to be important for European benchmarks in their decision of continued downtrend or a reversal and establishment of new uptrends.
 [1]
[1]
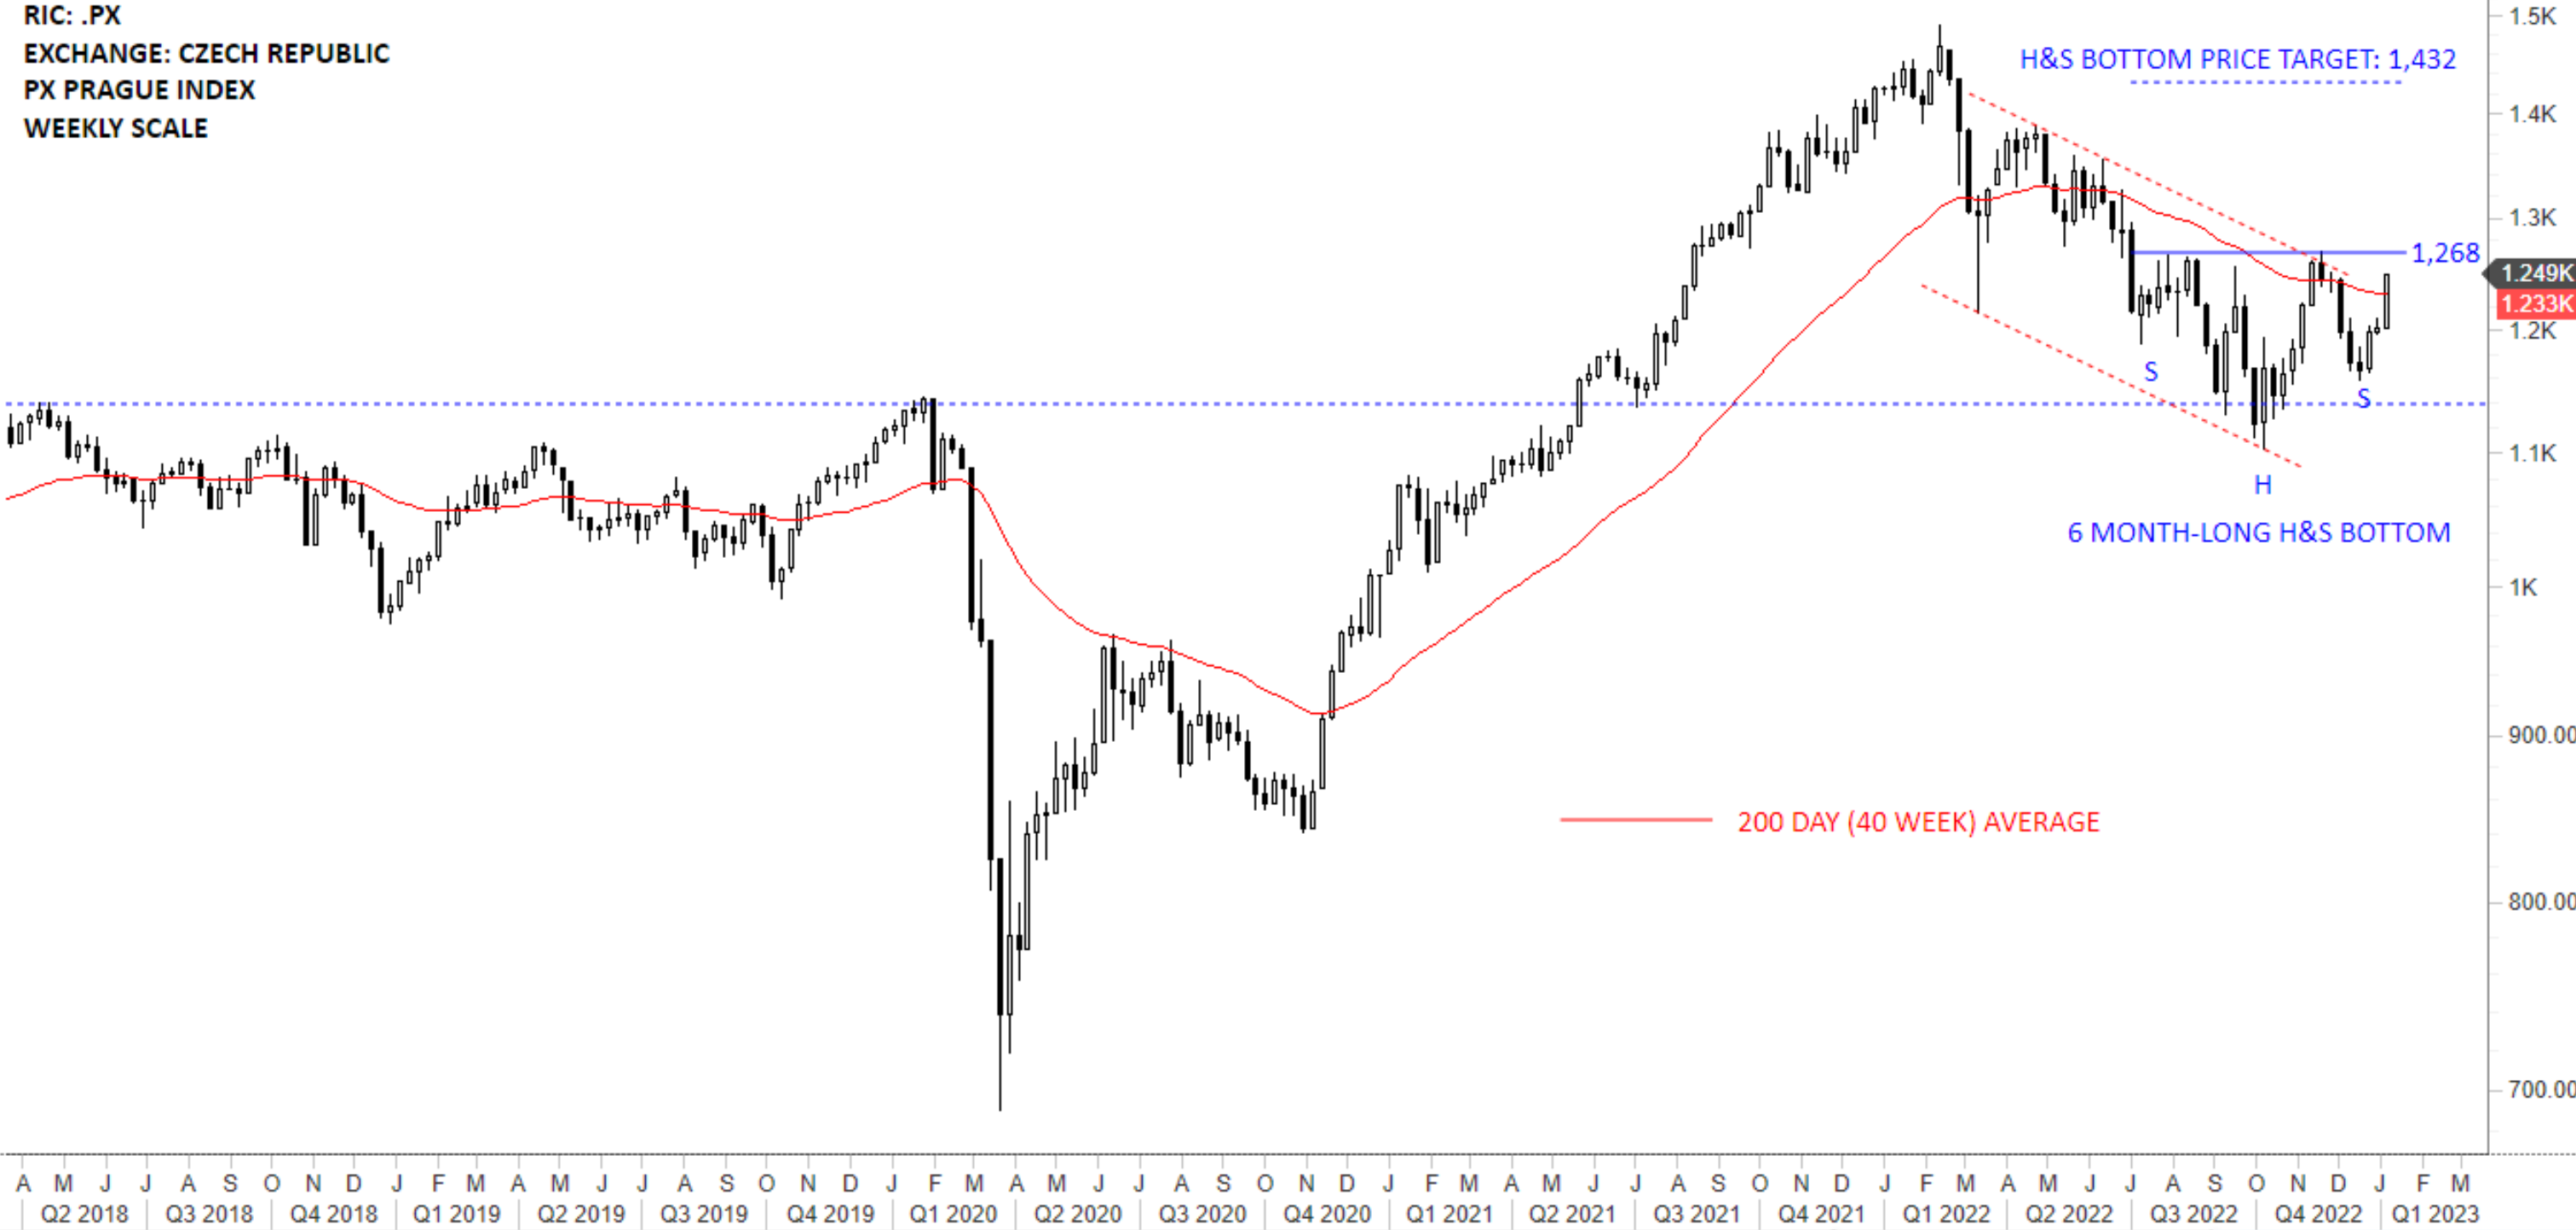
Another text-book H&S bottom reversal can be seen on PX Prague Index with the neckline acting as resistance at 1,268 levels. The index trying to breach the long-term average. Breakout from the H&S bottom can confirm the new uptrend with the possible price target of 1,432 levels.
 [2]
[2]
Tech Charts Membership

By becoming a Premium Member, you’ll be able to improve your knowledge of the principles of classical charting.
With this knowledge, you can merge them with your investing system. In fact, some investors use my analyses to modify their existing style to invest more efficiently and successfully.
Get Access Now [3]
As a Premium Member of Aksel Kibar’s Tech Charts,
You will receive:
-
Global Equities Report. Delivered weekly.
-
Classical charting principles. Learn patterns and setups.
-
Actionable information. Worldwide indices and stocks of interest.
-
Risk management advice. The important trading points of each chart.
-
Information on breakout opportunities. Identify the ones you want to take action on.
-
Video tutorials. How patterns form and why they succeed or fail.
-
Watch list alerts. As they become available so you can act quickly.
-
Breakout alerts. Usually once a week.
-
Access to everything (now and as it becomes available)o Reports
o Videos and video series -
Multi-part webinar course. You learn the 8 most common charting principles.
-
Webinars. Actionable and timely advice on breaking out chart patterns.
For your convenience your membership auto renews each year.
Get Access Now [3]