Every week Tech Charts Global Equity Markets report features some of the well-defined, mature classical chart patterns under a lengthy watchlist and the chart pattern breakout signals that took place during that week. Global Equity Markets report covers single stocks from developed, emerging and frontier markets, ETF’s, select commodities, cryptocurrencies and global equity indices. Below chart is from the watchlist section of the weekly report. It is featuring Darling Ingredients Inc. listed on the New York Stock Exchange.
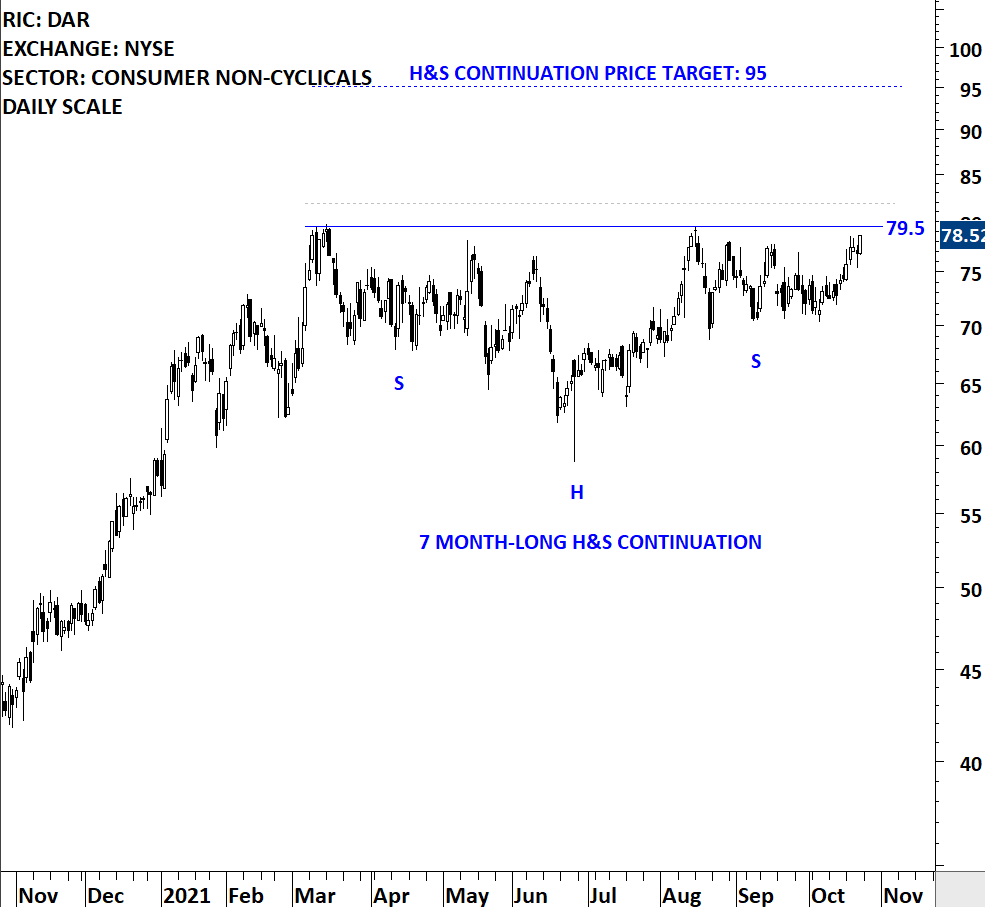
DARLING INGREDIENTS INC (DAR) – new addition to watchlist
Darling Ingredients Inc. is a developer & producer of sustainable natural ingredients from edible and inedible bio-nutrients, creating ingredients and customized specialty solutions for customers in the food, pet food, feed, fuel, bioenergy, and fertilizer industries. The stock is listed on the New York Stock Exchange. Price chart formed a 7 month-long head and shoulder continuation with the horizontal boundary acting as strong resistance at 79.50 levels. The horizontal boundary was tested several times over the course of the chart pattern. A daily close above 81.80 levels will confirm the breakout from the 7 month-long head and shoulder continuation with the possible chart pattern price target of 95.00 levels.
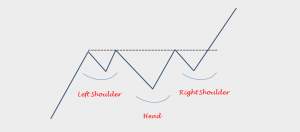
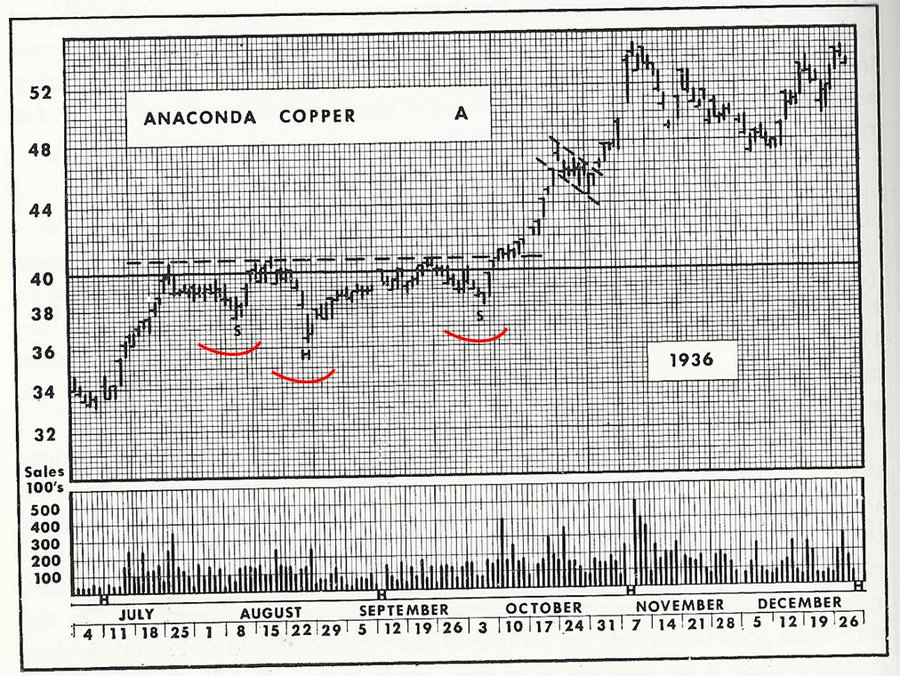
A common discussion is on the validity of H&S acting as a continuation chart pattern. It is widely believed that H&S can only form as a reversal chart pattern. Edwards & Magee in their book Technical Analysis of Stock Trends, discussed the continuation type with the below chart example from 1930s. I’ve come across and featured several examples of H&S continuation in the past reports. In fact the statistics on H&S continuation is solid.
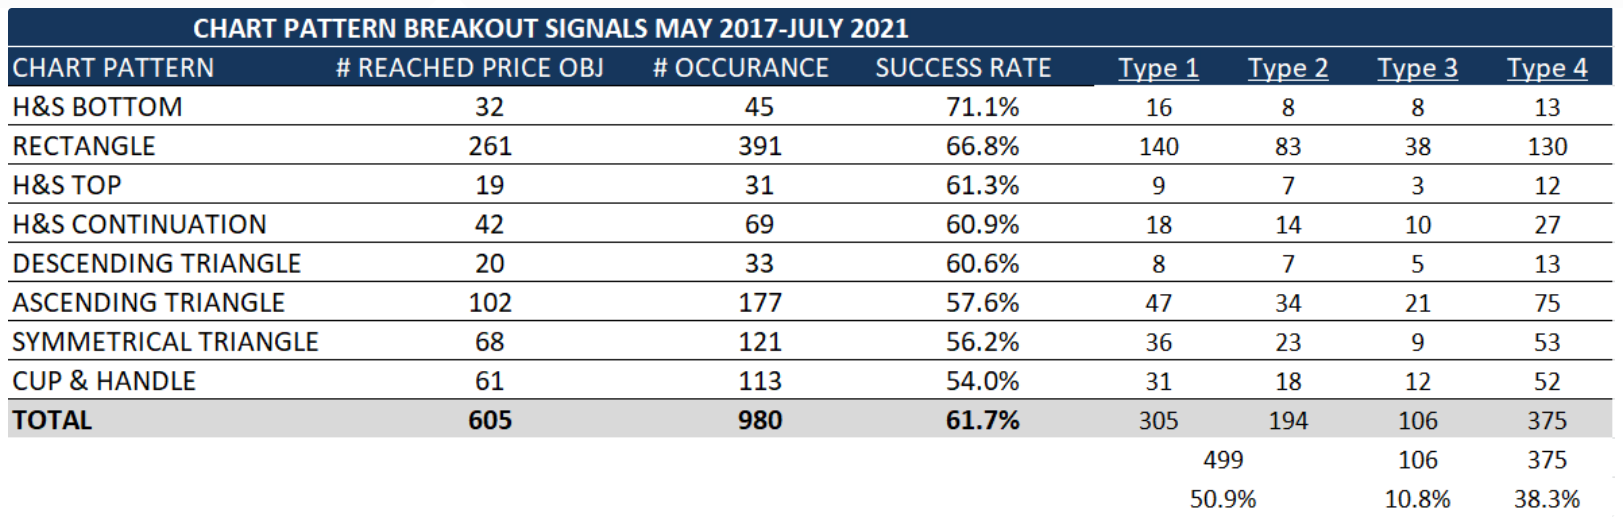
Below is the table showing chart pattern statistics for H&S continuation. These numbers cover the period of May 2017 till July 2021. H&S types with my favorite chart pattern rectangle are in the top 4 reliable chart patterns.
Tech Charts Membership

By becoming a Premium Member, you’ll be able to improve your knowledge of the principles of classical charting.
With this knowledge, you can merge them with your investing system. In fact, some investors use my analyses to modify their existing style to invest more efficiently and successfully.
Get Access Now [1]
As a Premium Member of Aksel Kibar’s Tech Charts,
You will receive:
-
Global Equities Report. Delivered weekly.
-
Classical charting principles. Learn patterns and setups.
-
Actionable information. Worldwide indices and stocks of interest.
-
Risk management advice. The important trading points of each chart.
-
Information on breakout opportunities. Identify the ones you want to take action on.
-
Video tutorials. How patterns form and why they succeed or fail.
-
Watch list alerts. As they become available so you can act quickly.
-
Breakout alerts. Usually once a week.
-
Access to everything (now and as it becomes available)o Reports
o Videos and video series -
Multi-part webinar course. You learn the 8 most common charting principles.
-
Webinars. Actionable and timely advice on breaking out chart patterns.
For your convenience your membership auto renews each year.
Get Access Now [1]