
Every week Tech Charts Global Equity Markets report features some of the well-defined, mature classical chart patterns under a lengthy watchlist and the chart pattern breakout signals that took place during that week. Global Equity Markets report covers single stocks from developed, emerging and frontier markets, ETF’s, select commodities, cryptocurrencies and global equity indices.
We have now added special cryptocurrency reports to our coverage as part of the premium membership. The below analysis is part of the special cryptocurrency updates.
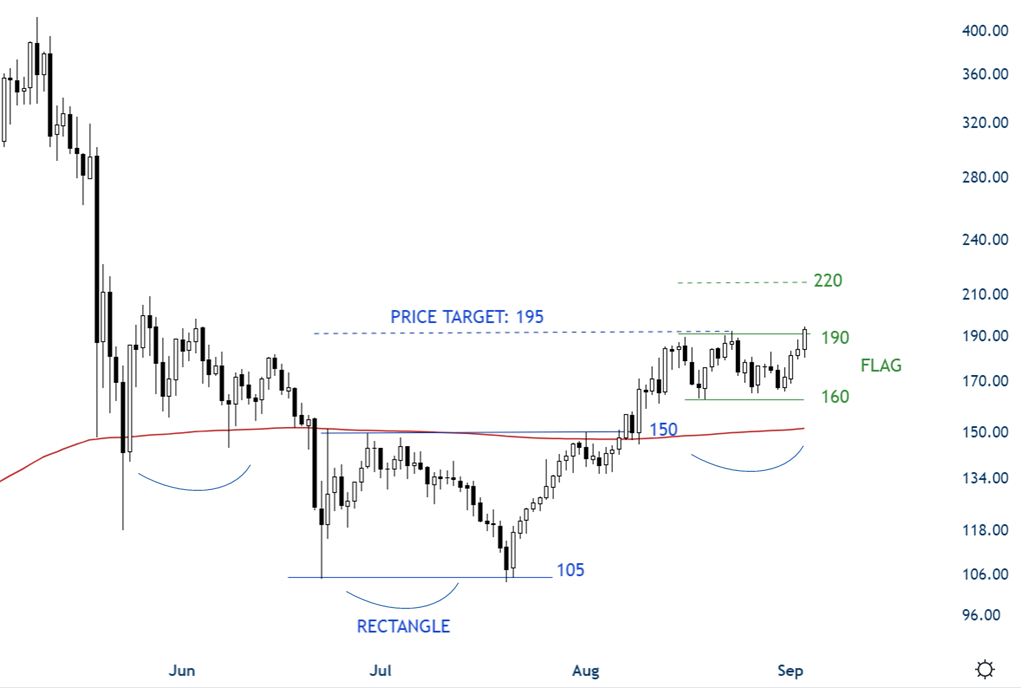
As on many other crypto pairs a bullish flag can be identified on LTCUSD as well. Earlier the price chart completed a rectangle bottom reversal with a breakout above 150 levels where price breached the long-term (365 day EMA) as well. The trend change has taken place. Following the change in trend we are now seeing a possible bullish continuation chart pattern with the resistance at 190 and support at 160 levels. From a larger scale perspective a multi-month long H&S bottom can be in progress as well. For now I want to focus on the latest bullish flag development. A breakout above 190 levels can target 220 levels in a short period of time and confirm the existing uptrend.
Tech Charts Membership

By becoming a Premium Member, you’ll be able to improve your knowledge of the principles of classical charting.
With this knowledge, you can merge them with your investing system. In fact, some investors use my analyses to modify their existing style to invest more efficiently and successfully.
Get Access Now [1]
As a Premium Member of Aksel Kibar’s Tech Charts,
You will receive:
-
Global Equities Report. Delivered weekly.
-
Classical charting principles. Learn patterns and setups.
-
Actionable information. Worldwide indices and stocks of interest.
-
Risk management advice. The important trading points of each chart.
-
Information on breakout opportunities. Identify the ones you want to take action on.
-
Video tutorials. How patterns form and why they succeed or fail.
-
Watch list alerts. As they become available so you can act quickly.
-
Breakout alerts. Usually once a week.
-
Access to everything (now and as it becomes available)o Reports
o Videos and video series -
Multi-part webinar course. You learn the 8 most common charting principles.
-
Webinars. Actionable and timely advice on breaking out chart patterns.
For your convenience your membership auto renews each year.
Get Access Now [1]