Every week Tech Charts Global Equity Markets report features some of the well-defined, mature classical chart patterns under a lengthy watchlist and the chart pattern breakout signals that took place during that week. Global Equity Markets report covers single stocks from developed, emerging and frontier markets, ETF’s and global equity indices. The report starts with a review section that highlights the important chart developments on global equity benchmarks. This blog post features from the watchlist section a head and shoulder bottom reversal chart pattern that is listed on the Paris Stock Exchange.
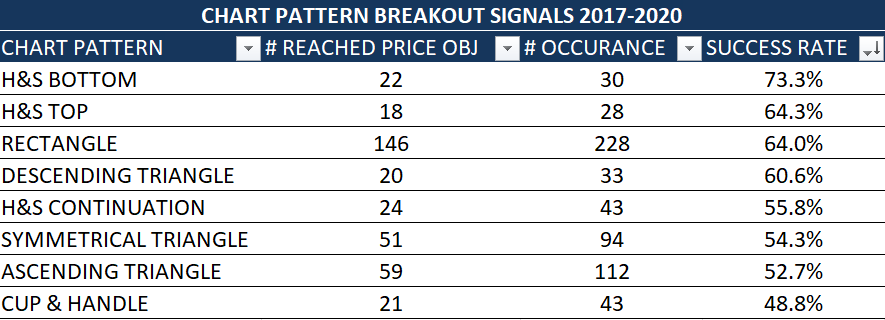
Over the past 3 years (2017-2020) Tech Charts Global Equity Markets report alerted members on 616 breakouts and breakdowns (long and short opportunities). The compiled statistics on those breakouts are as below. A chart pattern once completed with a confirmed breakout either reaches its chart pattern price target (successful) or it reaches chart pattern negation level (failed). It is interesting to note that H&S bottom reversal has been one of the best performing chart pattern followed by another H&S; the H&S top reversal. More detailed statistics will be shared during our members annual review which should take place by end of May.
REMY COINTREAU SA (RCOP.PA)
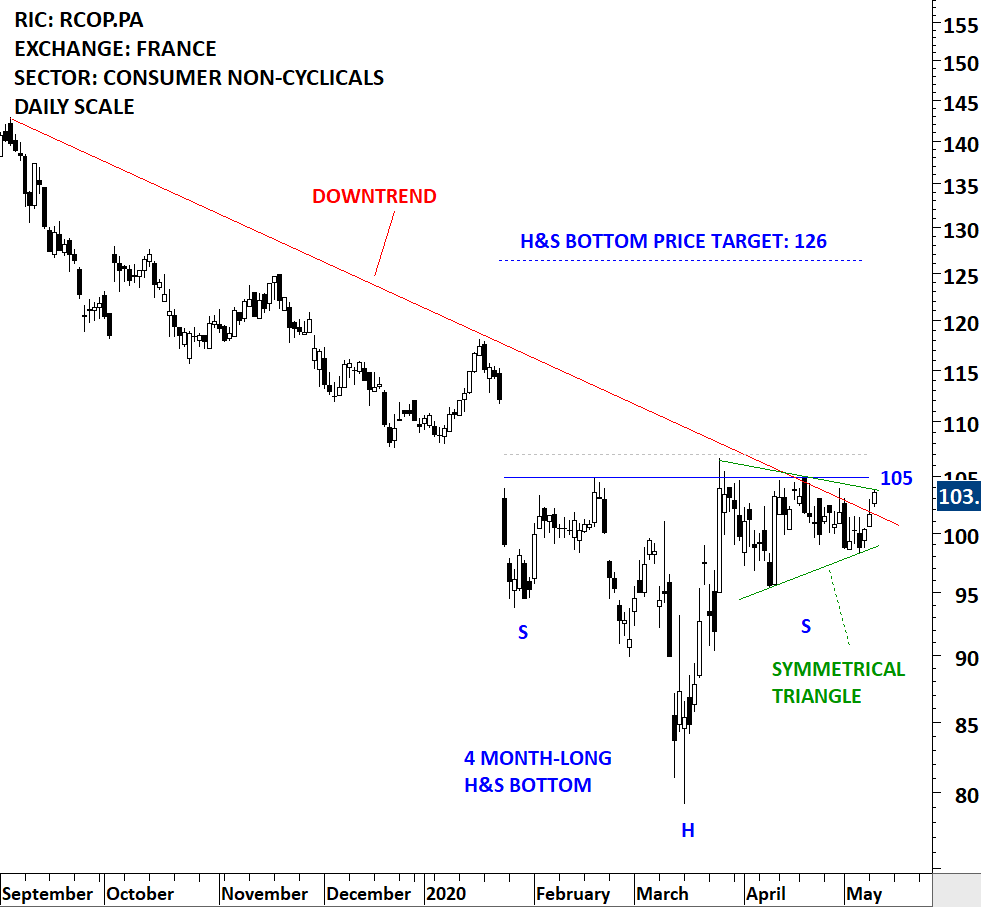
Remy Cointreau SA is a France-based company engaged in the production and distribution of wines and spirits. The stock is listed on the Paris Stock Exchange. Price chart formed a 4 month-long head and shoulder bottom with the horizontal boundary acting as strong resistance at 105.0 levels. The horizontal boundary was tested several times over the course of the chart pattern. A daily close above 107.0 levels will confirm the breakout from the 4 month-long head and shoulder bottom with the possible chart pattern price target of 126.0 levels. (Data as of May 12, 2020, CET 13:00)
Tech Charts Membership

By becoming a Premium Member, you’ll be able to improve your knowledge of the principles of classical charting.
With this knowledge, you can merge them with your investing system. In fact, some investors use my analyses to modify their existing style to invest more efficiently and successfully.
Get Access Now [1]
As a Premium Member of Aksel Kibar’s Tech Charts,
You will receive:
-
Global Equities Report. Delivered weekly.
-
Classical charting principles. Learn patterns and setups.
-
Actionable information. Worldwide indices and stocks of interest.
-
Risk management advice. The important trading points of each chart.
-
Information on breakout opportunities. Identify the ones you want to take action on.
-
Video tutorials. How patterns form and why they succeed or fail.
-
Watch list alerts. As they become available so you can act quickly.
-
Breakout alerts. Usually once a week.
-
Access to everything (now and as it becomes available)o Reports
o Videos and video series -
Multi-part webinar course. You learn the 8 most common charting principles.
-
Webinars. Actionable and timely advice on breaking out chart patterns.
For your convenience your membership auto renews each year.
Get Access Now [1]