
Long-time Tech Charts followers know that the Global Equity Markets report and blog posts feature well-defined classical chart patterns in duration between 4 months and 24 months on weekly scale price charts. I have been focusing on capturing long-term breakut opportunities. Going forward I will start adding classical chart patterns in shorter-term duration and cover those well-defined horizontal chart patterns in duration between 2 months and 4 months on daily scale. I hope this new addition to the weekly reports will offer more opportunities to those who trade classical chart pattern breakouts on Global equities. This blog post features from the watchlist section a rectangle chart pattern opportunity, listed on the Tokyo Stock Exchange.
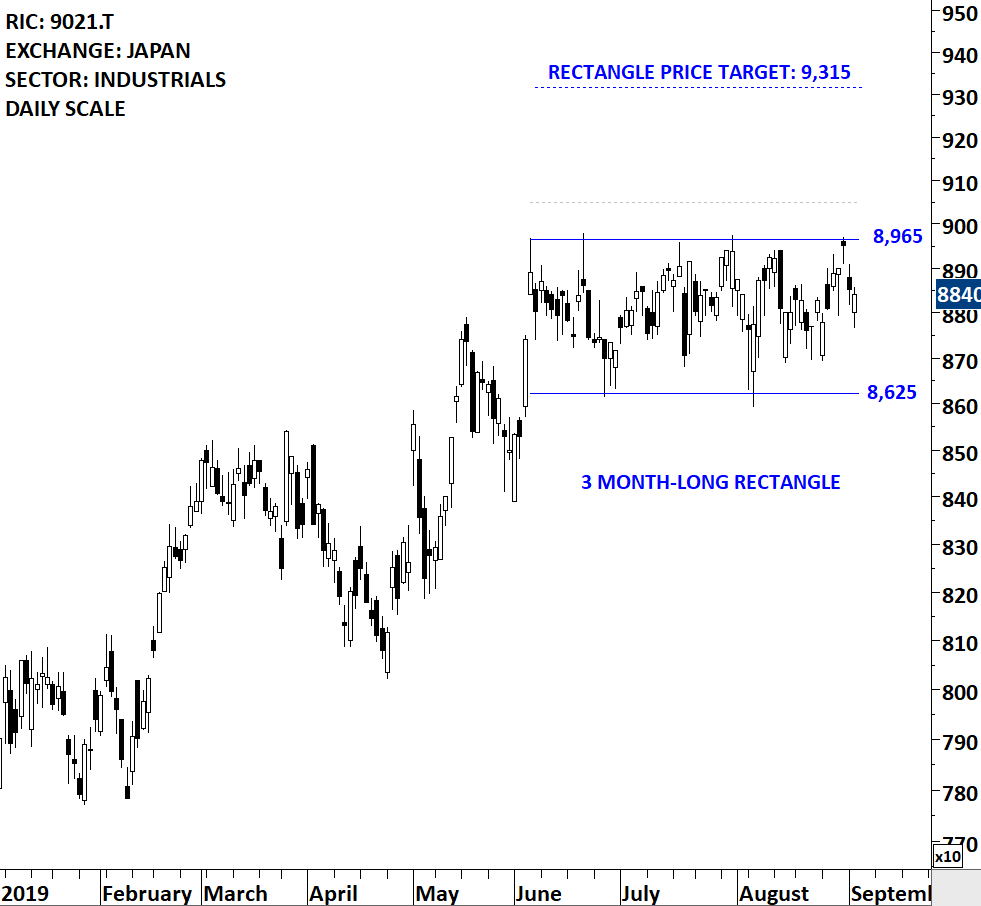
WEST JAPAN RAILWAY CO (9021.T [1])
West Japan Railway Company is mainly engaged in the provision of passenger railway transportation services. The stock is listed on the Tokyo Stock Exchange. Price chart formed a 3 month-long rectangle with the horizontal boundary acting as strong resistance at 8,965.00 levels. The horizontal boundary was tested several times over the course of the chart pattern. A daily close above 9,050.00 levels will confirm the breakout from the 3 month-long rectangle with the possible chart pattern price target of 9,315.00 levels. (Data as of Sep 3, 2019)
Tech Charts Membership

By becoming a Premium Member, you’ll be able to improve your knowledge of the principles of classical charting.
With this knowledge, you can merge them with your investing system. In fact, some investors use my analyses to modify their existing style to invest more efficiently and successfully.
Get Access Now [2]
As a Premium Member of Aksel Kibar’s Tech Charts,
You will receive:
-
Global Equities Report. Delivered weekly.
-
Classical charting principles. Learn patterns and setups.
-
Actionable information. Worldwide indices and stocks of interest.
-
Risk management advice. The important trading points of each chart.
-
Information on breakout opportunities. Identify the ones you want to take action on.
-
Video tutorials. How patterns form and why they succeed or fail.
-
Watch list alerts. As they become available so you can act quickly.
-
Breakout alerts. Usually once a week.
-
Access to everything (now and as it becomes available)o Reports
o Videos and video series -
Multi-part webinar course. You learn the 8 most common charting principles.
-
Webinars. Actionable and timely advice on breaking out chart patterns.
For your convenience your membership auto renews each year.
Get Access Now [2]