Every week Tech Charts Global Equity Markets report features some of the well-defined, mature classical chart patterns under a lengthy watchlist and the chart pattern breakout signals that took place during that week. Global Equity Markets report covers single stocks from developed, emerging and frontier markets, ETF’s and global equity indices. The report starts with a review section that highlights the important chart developments on global equity benchmarks. This blog post features from the breakout and watchlist sections two bullish cup & handle continuation chart pattern opportunities, listed on the Nasdaq Stock Exchange. You will also find an educational video on cup & handle chart pattern.
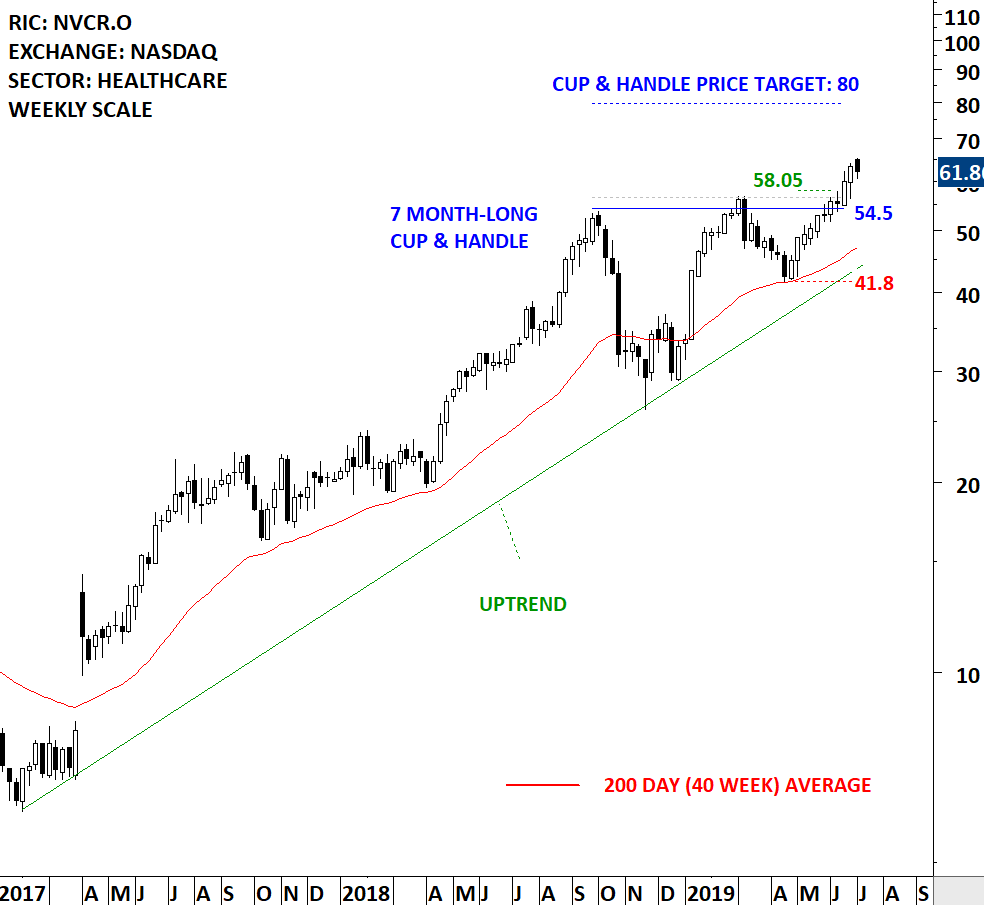
NOVOCURE LTD (NVCR.O [1])
NovoCure Limited is a commercial-stage oncology company. The Company is engaged in developing a cancer treatment centered on a therapy called TTFields, the use of electric fields tuned to specific frequencies to disrupt solid tumor cancer cell division. The stock is listed on the Nasdaq Stock Exchange. Price chart formed a 7 month-long cup & handle with the horizontal boundary acting as strong resistance at 54.5 levels. The horizontal boundary was tested several times over the course of the chart pattern. A daily close above 56.5 levels will confirm the breakout from the 7 month-long cup & handle with the possible chart pattern price target of 80 levels. Breakout can push the stock to all-time highs. This week’s price action was a borderline breakout. I will wait for another day of strength to confirm this breakout. (Learn more: Video Tutorial [2])
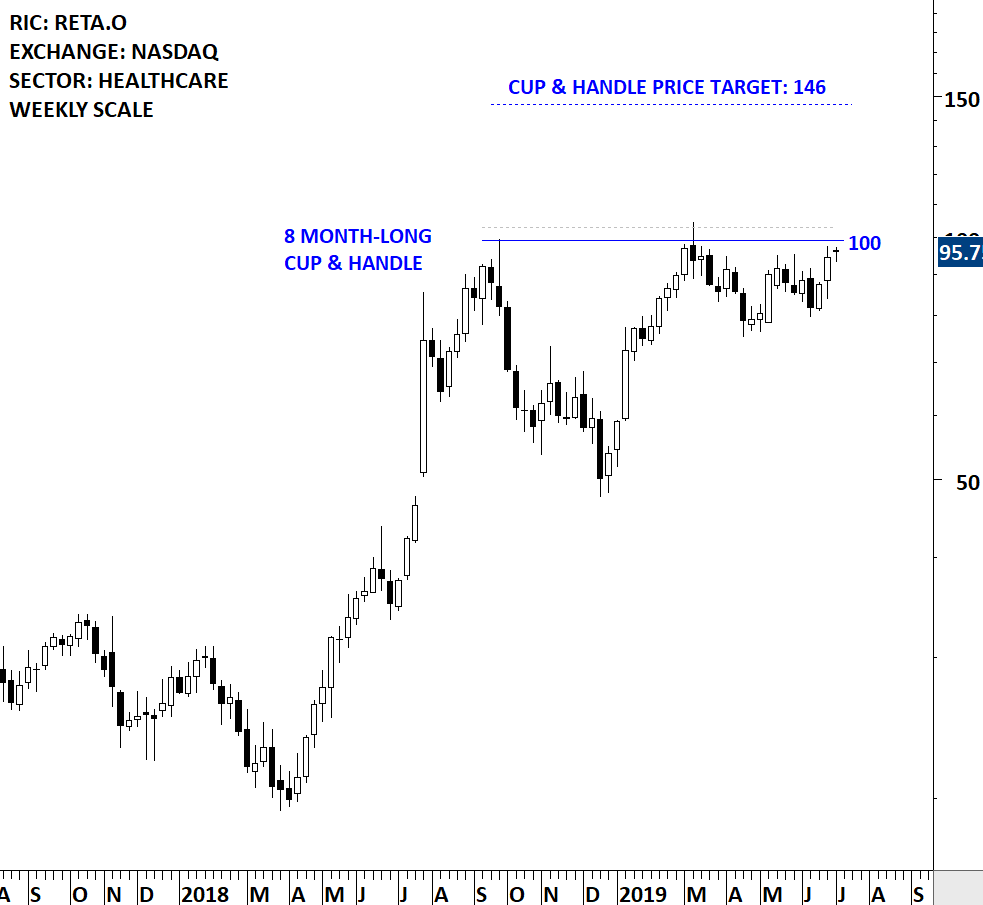
REATA PHARMACEUTICALS INC (RETA.O [3])
Reata Pharmaceuticals, Inc. is a clinical-stage biopharmaceutical company. The Company is focused on identifying, developing and commercializing product candidates that modulate the activity of regulatory proteins involved in the biology of mitochondrial function, oxidative stress, and inflammation to address the unmet medical needs of patients with a range of serious or life-threatening diseases. The stock is listed on the Nasdaq Stock Exchange. Price chart formed an 8 month-long cup & handle continuation with the horizontal boundary acting as strong resistance at 100 levels. A daily close above 103 levels will confirm the breakout from the 8 month-long cup & handle continuation with the possible chart pattern price target of 146 levels. Breakout can push the stock to all-time highs. (Learn more: Video Tutorial [2])
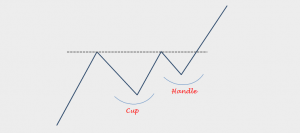
EDUCATIONAL VIDEO ON CUP & HANDLE BULLISH CONTINUATION
Tech Charts Membership

By becoming a Premium Member, you’ll be able to improve your knowledge of the principles of classical charting.
With this knowledge, you can merge them with your investing system. In fact, some investors use my analyses to modify their existing style to invest more efficiently and successfully.
Get Access Now [4]
As a Premium Member of Aksel Kibar’s Tech Charts,
You will receive:
-
Global Equities Report. Delivered weekly.
-
Classical charting principles. Learn patterns and setups.
-
Actionable information. Worldwide indices and stocks of interest.
-
Risk management advice. The important trading points of each chart.
-
Information on breakout opportunities. Identify the ones you want to take action on.
-
Video tutorials. How patterns form and why they succeed or fail.
-
Watch list alerts. As they become available so you can act quickly.
-
Breakout alerts. Usually once a week.
-
Access to everything (now and as it becomes available)o Reports
o Videos and video series -
Multi-part webinar course. You learn the 8 most common charting principles.
-
Webinars. Actionable and timely advice on breaking out chart patterns.
For your convenience your membership auto renews each year.
Get Access Now [4]