
Cross listing of shares is when a firm lists its equity shares on one or more foreign stock exchange in addition to its domestic exchange. Many companies cross-list, in which the stock is technically fungible between exchanges. Prices are subject to local market conditions, as well as FX fluctuations and are not kept in perfect parity between markets. Generally such a company’s primary listing is on a stock exchange in its country of incorporation, and its secondary listing(s) is/are on an exchange in another country. Cross-listing is especially common for companies that started out in a small market but grew into a larger market.
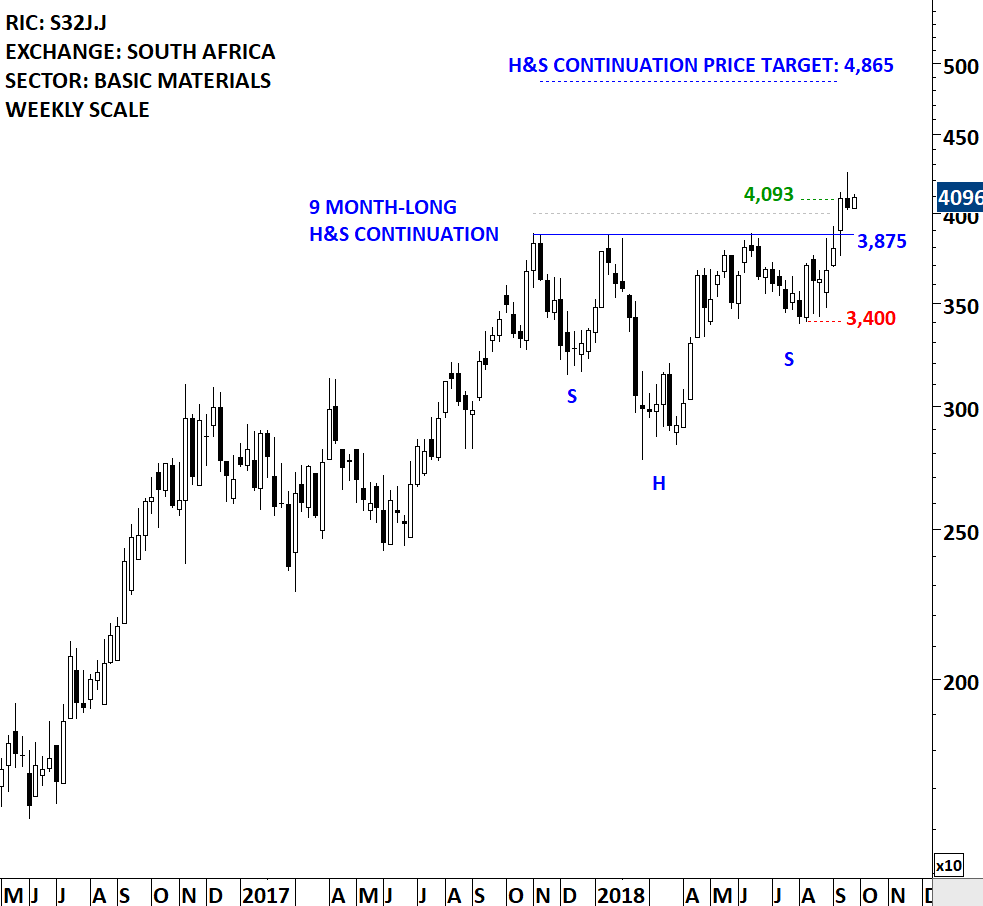
One of the recent breakout alerts was on a cross-listed share South32 Limited. South32 Limited is a metals and mining company. The stock is listed on the Australia Stock Exchange, London Stock Exchange and Johannesburg Stock Exchange. The breakout alert was on South Africa listing. Price chart formed a 9 month-long head and shoulder continuation with the horizontal boundary acting as strong resistance at 3,875 levels. The horizontal boundary was tested several times over the course of the chart pattern. The daily close above 4,000 levels confirmed the breakout from the 9 month-long head and shoulder continuation with the possible chart pattern price target of 4,865 levels. Breakout pushed the stock to all-time highs.
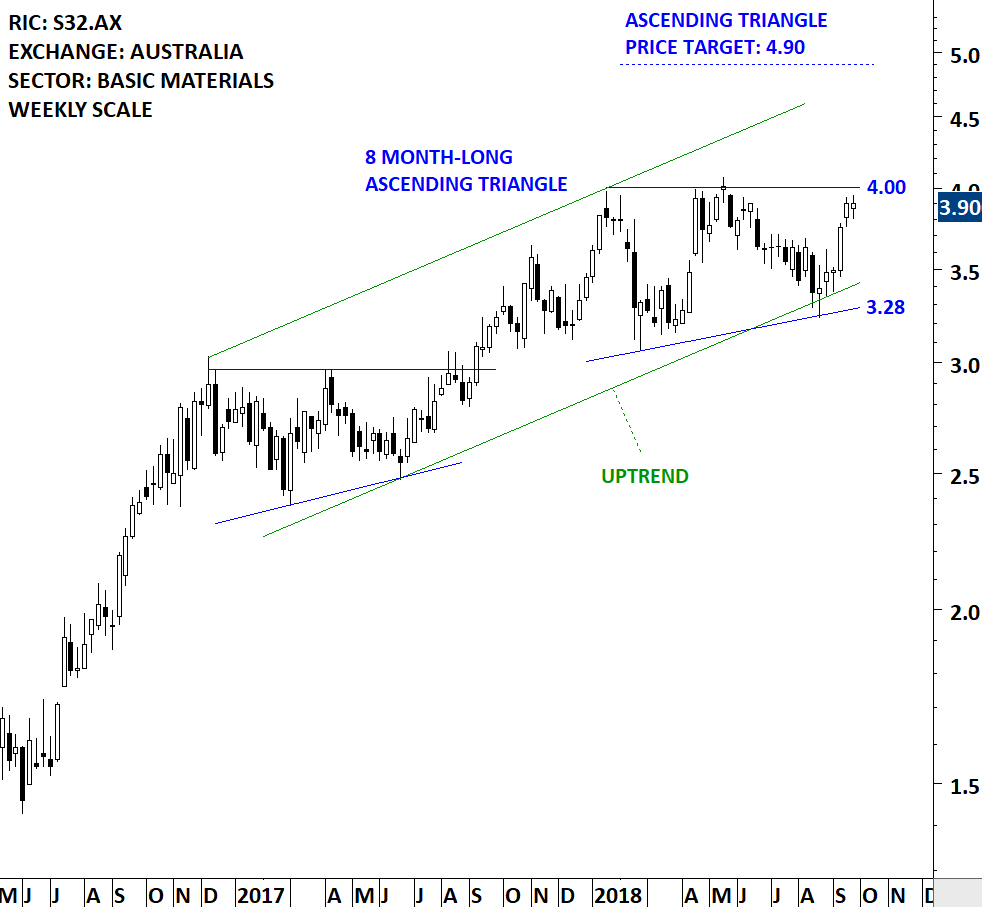
However, the price chart for South32 Limited on Australia Stock Exchange didn’t breakout from its possible 8 month-long ascending triangle. While the ascending triangle chart pattern can be interpreted as a bullish development, one should wait for a breakout confirmation.
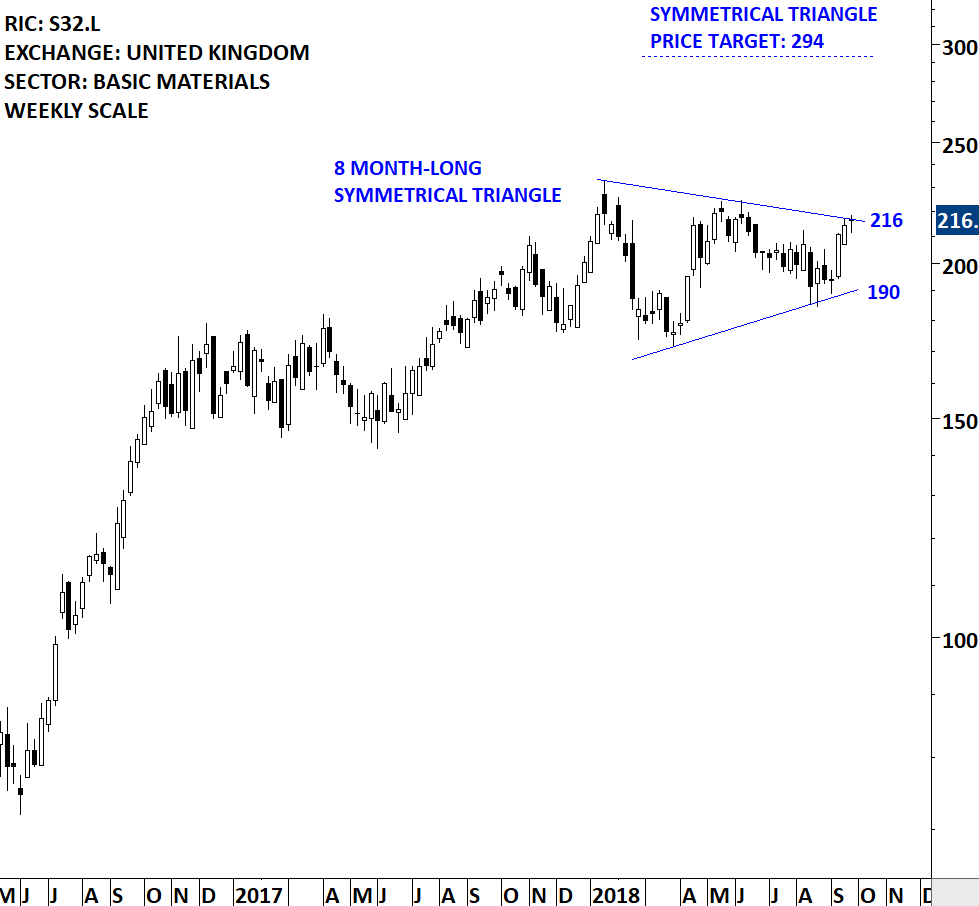
Price chart for South32 Limited on London Stock Exchange is possibly forming an 8 month-long symmetrical triangle with the upper boundary acting as resistance at 216 levels. Similar to the Australia Stock Exchange listing, this price chart is pending confirmation.
Cross-listing concept is distinctly different than examples such as: American Depositary Receipt (ADR), European Depositary Receipt (EDR), global depository receipt (GDR) (also referred to as international depository receipt), and Global Registered Shares (GRS). ADRs, GDRs and the like are a mechanism to repackage a security primarily listed on an Exchange (such as Frankfurt) to enable it to be purchased by an investor outside of that market (such as within the US on the NYSE). This is a distinct instrument, as not all the rights may come with the ADR (GDR, EDR, IDR, etc.), and the ADR is subject to the fluctuations of the underlying currency. The original issue (on Frankfurt) would be priced in EUR, while the ADR is priced in USD. In most cases, the ADR is convertible back into the original instrument (but needs to go through a process of conversion). The ADR (GDR,IDR,EDR, etc.) also receives a different ISIN number, recognizing that it is not the same fungible instrument as the underlying stock.
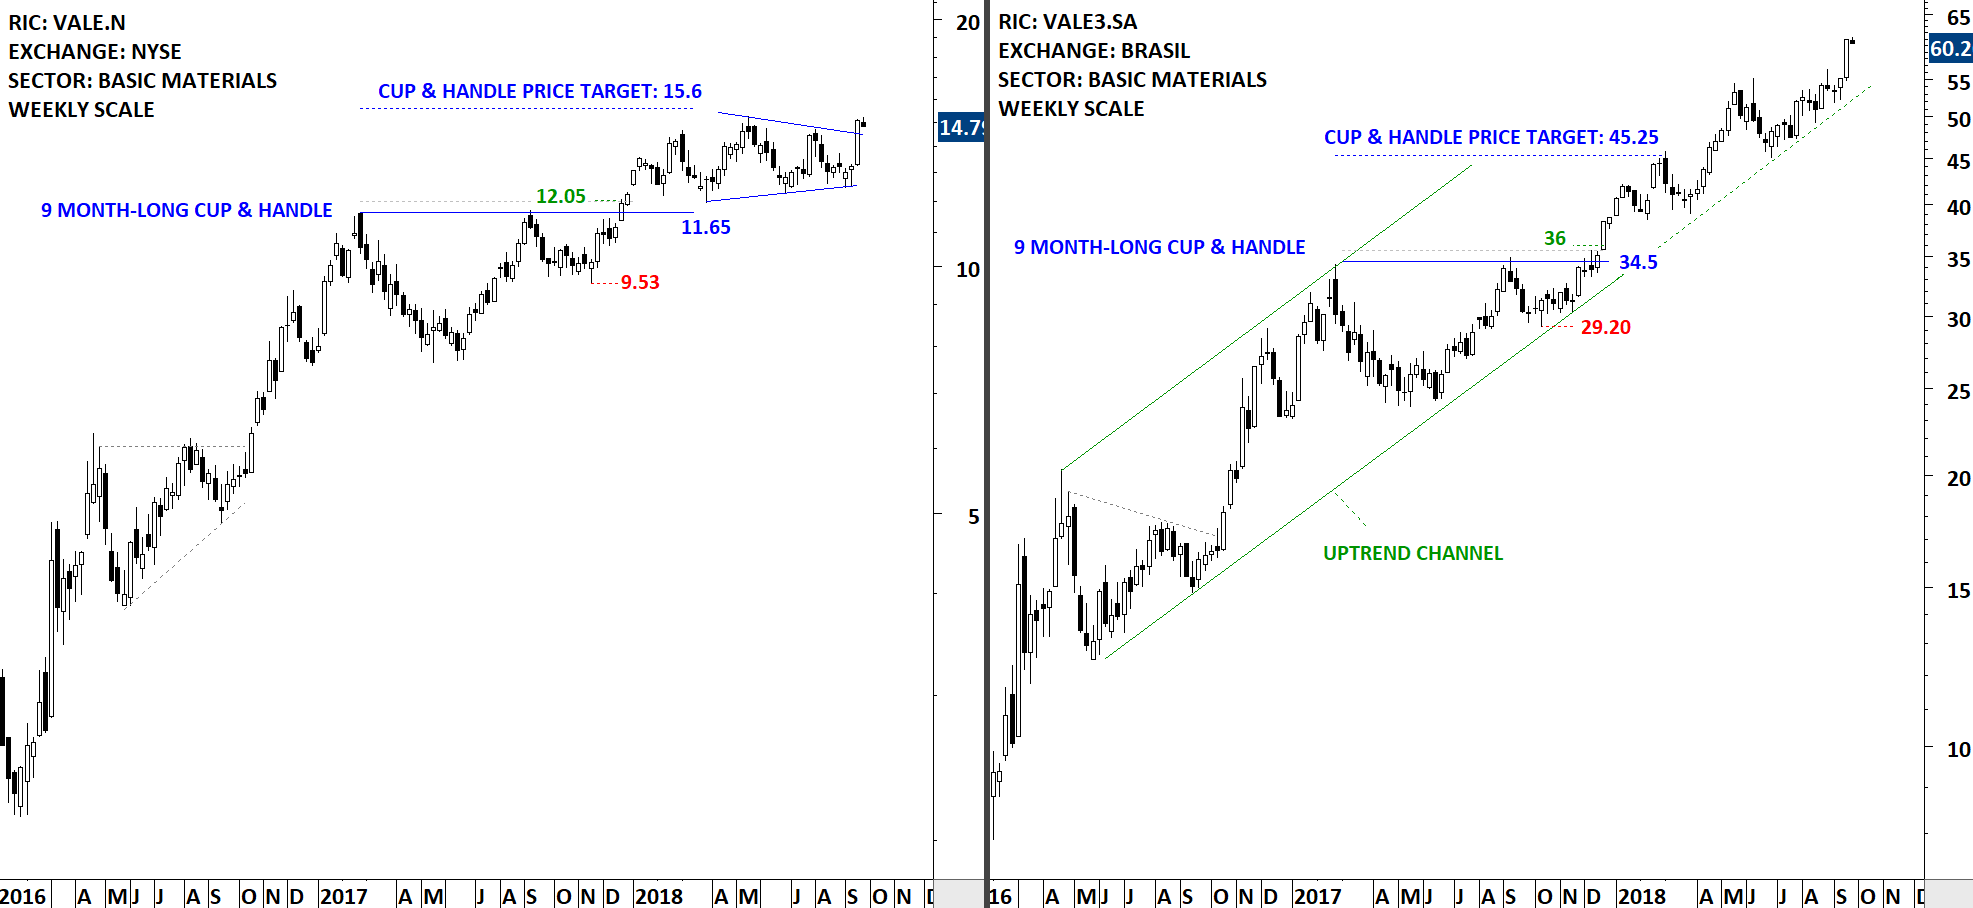
Below charts were featured in previous issues of Global Equity Markets report Breakout Alerts section. VALE SA listed on Brasil’s Sao Paulo stock exchange is available to investors via Depository Receipts in New York Stock Exchange. Both charts completed a similar cup & handle continuation chart pattern. However, price appreciation due to currency effect helped the price chart on Sao Paulo exhange reach its chart pattern price objective earlier than the Depository Receipt on the New York Stock Exchange.
Tech Charts Global Equity Markets report highlights breakout opportunities in Global Equities including cross-listed securities and depository receipts. I treat each chart on its own merit. I will go ahead and highlight a confirmed breakout irrespective of its market. I am interested in finding and highlighting well-defined and mature chart pattern breakout opportunities in the Global Equity Markets.
Tech Charts Membership

By becoming a Premium Member, you’ll be able to improve your knowledge of the principles of classical charting.
With this knowledge, you can merge them with your investing system. In fact, some investors use my analyses to modify their existing style to invest more efficiently and successfully.
Get Access Now [1]
As a Premium Member of Aksel Kibar’s Tech Charts,
You will receive:
-
Global Equities Report. Delivered weekly.
-
Classical charting principles. Learn patterns and setups.
-
Actionable information. Worldwide indices and stocks of interest.
-
Risk management advice. The important trading points of each chart.
-
Information on breakout opportunities. Identify the ones you want to take action on.
-
Video tutorials. How patterns form and why they succeed or fail.
-
Watch list alerts. As they become available so you can act quickly.
-
Breakout alerts. Usually once a week.
-
Access to everything (now and as it becomes available)o Reports
o Videos and video series -
Multi-part webinar course. You learn the 8 most common charting principles.
-
Webinars. Actionable and timely advice on breaking out chart patterns.
For your convenience your membership auto renews each year.
Get Access Now [1]