
Every week Tech Charts Global Equity Markets report features some of the well-defined, mature classical chart patterns under a lengthy watchlist and the chart pattern breakout signals that took place during that week. Global Equity Markets report covers single stocks from developed and emerging markets, ETF’s and global equity indices. The report starts with a review section that highlights the important chart developments on global equity benchmarks. This blog post features two equities from U.S. banking sector that formed rectangle chart patterns that can act as bullish continuation. Both charts were discussed in the latest weekly Global Equity Markets report.
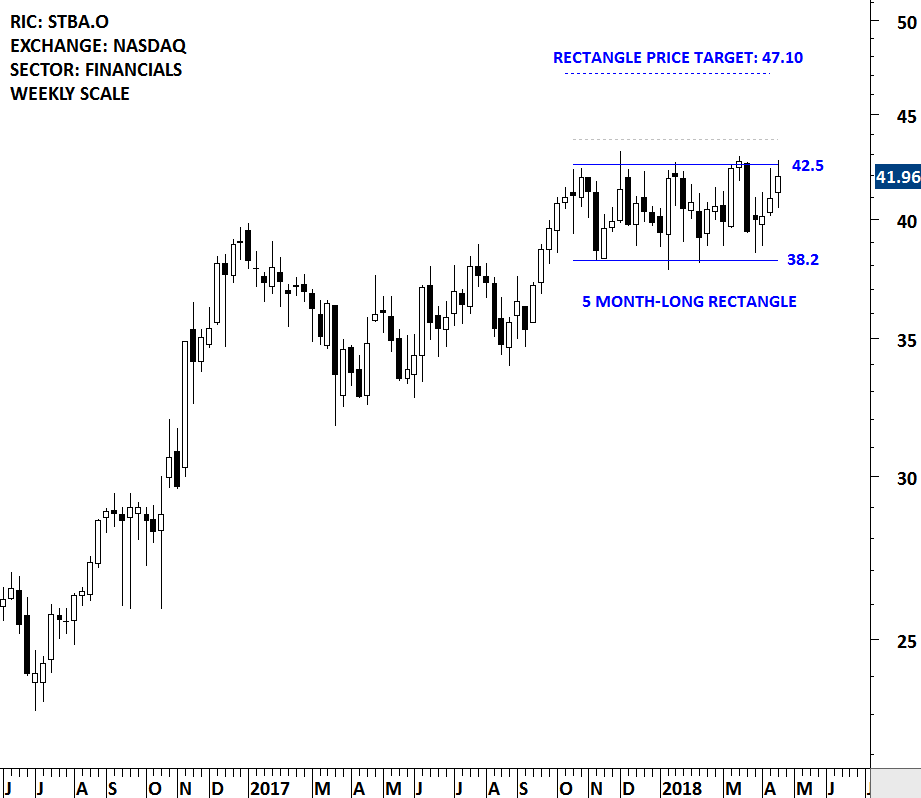
S&T BANCORP INC (STBA.O [1])
S&T Bancorp, Inc. (S&T) is a bank holding company. The Company operates through three segments: Community Banking, Wealth Management and Insurance. The stock is listed on the Nasdaq Stock Exchange. Price chart formed a 5 month-long rectangle with the upper boundary acting as strong resistance at 42.5 levels. The upper boundary was tested several times over the course of the chart pattern. A daily close above 43.75 levels will confirm the breakout from the 5 month-long rectangle with the possible chart pattern price target of 47.10 levels.
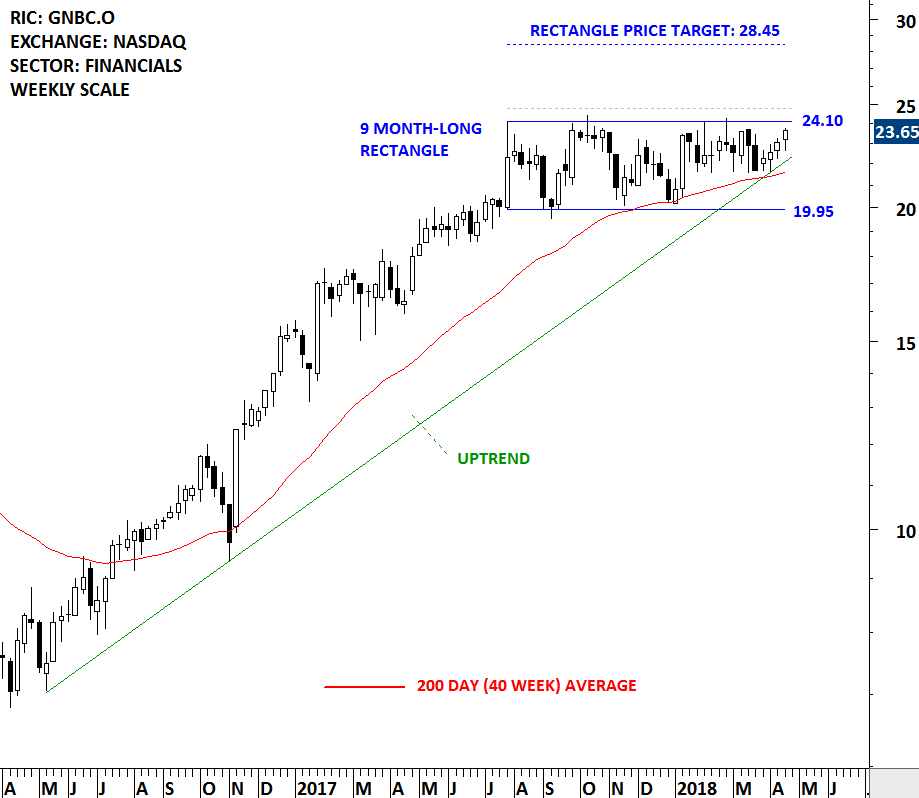
GREEN BANCORP INC (GNBC.O [2])
Green Bancorp, Inc. is a bank holding company. The Company provides banking services to a range of customers. The Company also offers debit cards, night depository, direct deposit, cashier’s checks and letters of credit, as well as treasury management services, wire transfer services and automated clearing house (ACH) services. The stock is listed on the Nasdaq Stock Exchange. Price chart formed a 9 month-long rectangle with the upper boundary acting as strong resistance at 24.10 levels. The upper boundary was tested several times over the course of the chart pattern. A daily close above 24.80 levels will confirm the breakout from the 9 month-long rectangle with the possible chart pattern price target of 28.45 levels.
Tech Charts Membership

By becoming a Premium Member, you’ll be able to improve your knowledge of the principles of classical charting.
With this knowledge, you can merge them with your investing system. In fact, some investors use my analyses to modify their existing style to invest more efficiently and successfully.
Get Access Now [3]
As a Premium Member of Aksel Kibar’s Tech Charts,
You will receive:
-
Global Equities Report. Delivered weekly.
-
Classical charting principles. Learn patterns and setups.
-
Actionable information. Worldwide indices and stocks of interest.
-
Risk management advice. The important trading points of each chart.
-
Information on breakout opportunities. Identify the ones you want to take action on.
-
Video tutorials. How patterns form and why they succeed or fail.
-
Watch list alerts. As they become available so you can act quickly.
-
Breakout alerts. Usually once a week.
-
Access to everything (now and as it becomes available)o Reports
o Videos and video series -
Multi-part webinar course. You learn the 8 most common charting principles.
-
Webinars. Actionable and timely advice on breaking out chart patterns.
For your convenience your membership auto renews each year.
Get Access Now [3]