
ISHARES 20+ YEAR TREASURY BOND ETF
Every week Tech Charts Global Equity Markets report features some of the well-defined, mature classical chart patterns under a lengthy watchlist and the chart pattern breakout signals that took place during that week. Global Equity Markets report covers single stocks from developed and emerging markets, ETF’s and global equity indices. The report starts with a review section that highlights the important chart developments on global equity benchmarks. This blog post features one of several great chart analysis that were highlighted in the review section from the previous Global Equity Markets report.
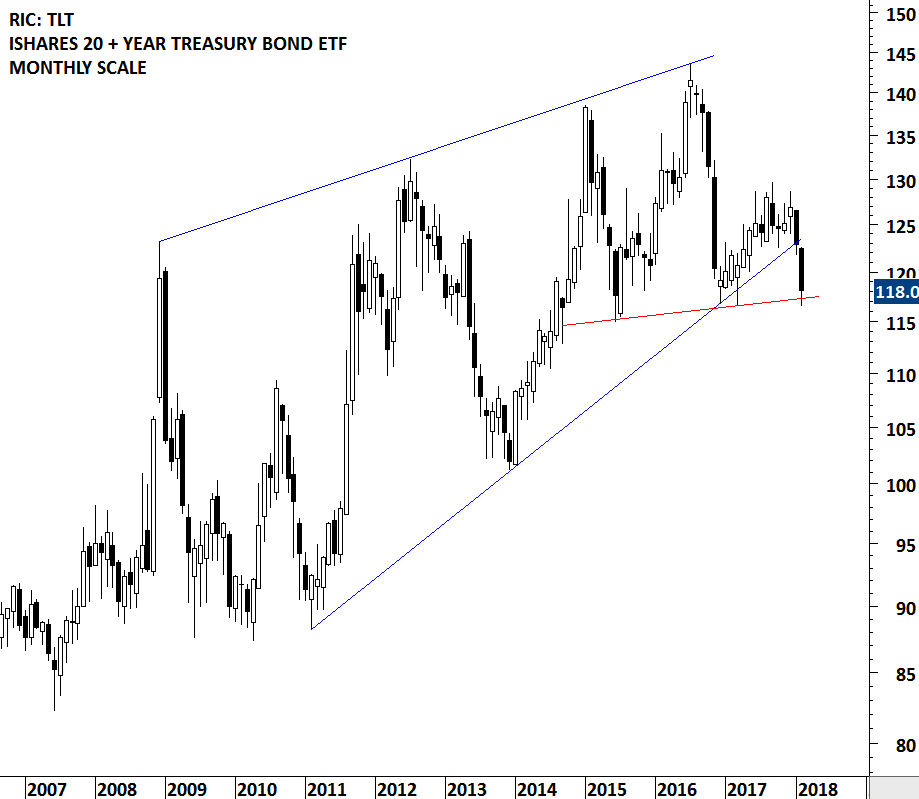
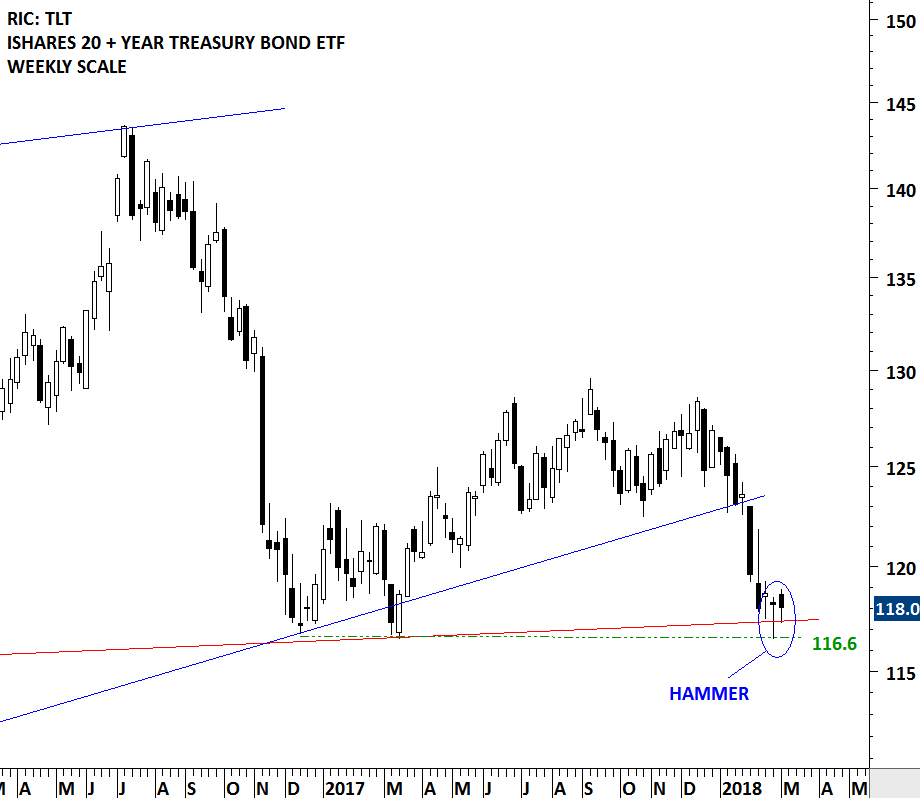
ISHARES 20+ YEAR TREASURY BOND ETF (TLT.O)
An important chart development is taking place on the long-term U.S. Treasury Bond ETF. The iShares 20 + Year Treasury Bond ETF (TLT) formed a hammer candlestick at an important support level on the weekly scale chart. I pay attention to bullish and bearish candlestick patterns at important support and resistance levels as they might signal possible reversal. While the long-term chart of TLT might be in the process of forming a massive top reversal, in the short-term on the weekly scale chart there is a possibility of a rebound from the support level at 116.6 levels.
Tech Charts Membership

By becoming a Premium Member, you’ll be able to improve your knowledge of the principles of classical charting.
With this knowledge, you can merge them with your investing system. In fact, some investors use my analyses to modify their existing style to invest more efficiently and successfully.

As a Premium Member of Aksel Kibar’s Tech Charts,
You will receive:
-
Global Equities Report. Delivered weekly.
-
Classical charting principles. Learn patterns and setups.
-
Actionable information. Worldwide indices and stocks of interest.
-
Risk management advice. The important trading points of each chart.
-
Information on breakout opportunities. Identify the ones you want to take action on.
-
Video tutorials. How patterns form and why they succeed or fail.
-
Watch list alerts. As they become available so you can act quickly.
-
Breakout alerts. Usually once a week.
-
Access to everything (now and as it becomes available)o Reports
o Videos and video series -
Multi-part webinar course. You learn the 8 most common charting principles.
-
Webinars. Actionable and timely advice on breaking out chart patterns.
For your convenience your membership auto renews each year.


