
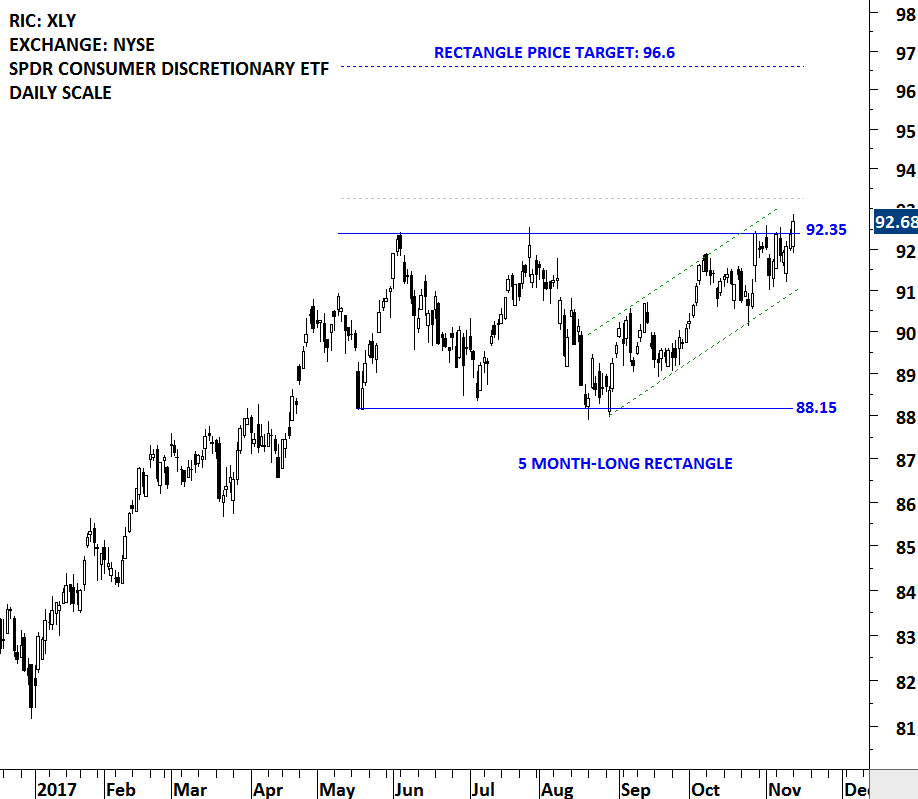
Consumer Discretionary Select Sector SPDR (XLY) [1] Fund (the Fund) seeks to provide investment results that correspond to the price and yield performance of the Consumer Discretionary Select Sector of the S&P 500 Index (the Index). The Index includes companies from industries, such as automobiles and components, consumer durables, apparel, hotels, restaurants, leisure, media and retailing. The ETF is listed on the New York Stock Exchange. Price chart formed a 5 month-long rectangle with the boundaries acting as resistance at 92.35 and support at 88.15 levels. Both the upper and lower boundary of the rectangle was tested several times. A daily close above 93.25 levels will confirm the breakout from the sideways consolidation with the possible chart pattern price target of 96.6 levels. You can check out the sample video below on bullish rectangle continuation.
Here are some of the sample educational videos you might find valuable. This sample video explains how to identify rectangles and to calculate possible chart pattern price targets. Tech Charts Educational Videos cover major reversal and continuation chart patterns.
Tech Charts Membership

By becoming a Premium Member, you’ll be able to improve your knowledge of the principles of classical charting.
With this knowledge, you can merge them with your investing system. In fact, some investors use my analyses to modify their existing style to invest more efficiently and successfully.
Get Access Now [2]
As a Premium Member of Aksel Kibar’s Tech Charts,
You will receive:
-
Global Equities Report. Delivered weekly.
-
Classical charting principles. Learn patterns and setups.
-
Actionable information. Worldwide indices and stocks of interest.
-
Risk management advice. The important trading points of each chart.
-
Information on breakout opportunities. Identify the ones you want to take action on.
-
Video tutorials. How patterns form and why they succeed or fail.
-
Watch list alerts. As they become available so you can act quickly.
-
Breakout alerts. Usually once a week.
-
Access to everything (now and as it becomes available)o Reports
o Videos and video series -
Multi-part webinar course. You learn the 8 most common charting principles.
-
Webinars. Actionable and timely advice on breaking out chart patterns.
For your convenience your membership auto renews each year.
Get Access Now [2]