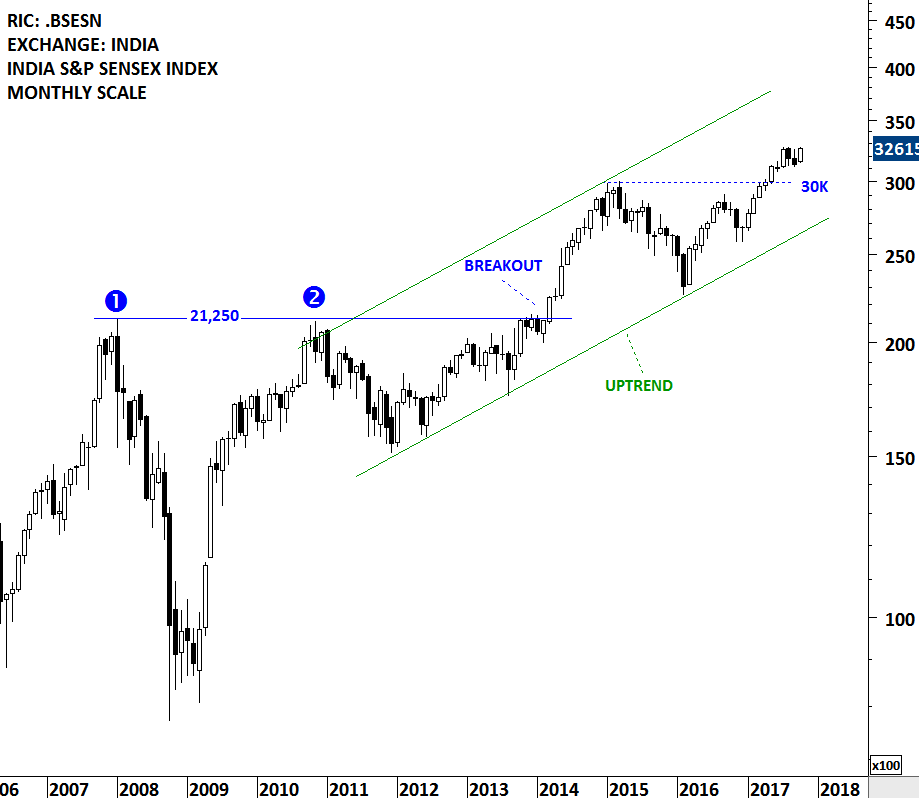
India equity benchmarks have been in a steady uptrend. For the past few months the BSE Sensex index and other equity benchmarks has been in a sideways consolidation. These short-term consolidations can prove to be bullish continuation chart patterns if resolved on the upside. On the long-term chart of BSE Sensex Index, 30K levels continue to form strong support. Long-term uptrend remains intact.
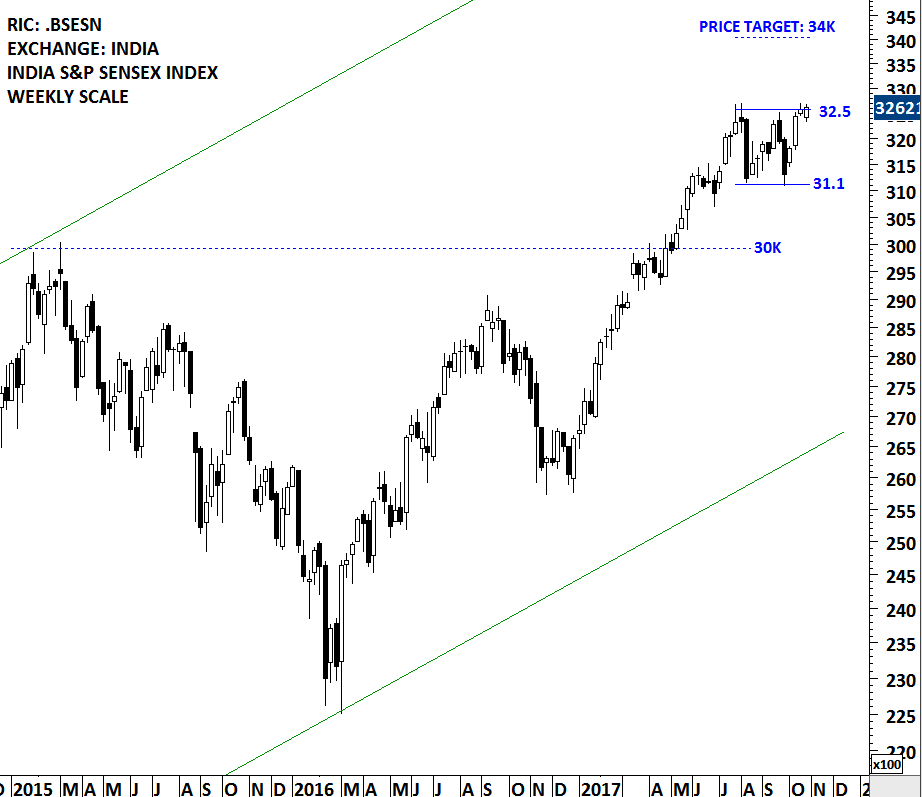
The weekly scale chart of the BSE Sensex Index shows the last few months sideways consolidation that is taking place between 31.1K and 32.5K levels. Breakout above 32.5 will be positive for India equities and will possibly add momentum to the existing uptrend. Initial price target for the 3 month-long sideways consolidation stands at 34K levels.
Tech Charts Membership

By becoming a Premium Member, you’ll be able to improve your knowledge of the principles of classical charting.
With this knowledge, you can merge them with your investing system. In fact, some investors use my analyses to modify their existing style to invest more efficiently and successfully.
Get Access Now [1]
As a Premium Member of Aksel Kibar’s Tech Charts,
You will receive:
-
Global Equities Report. Delivered weekly.
-
Classical charting principles. Learn patterns and setups.
-
Actionable information. Worldwide indices and stocks of interest.
-
Risk management advice. The important trading points of each chart.
-
Information on breakout opportunities. Identify the ones you want to take action on.
-
Video tutorials. How patterns form and why they succeed or fail.
-
Watch list alerts. As they become available so you can act quickly.
-
Breakout alerts. Usually once a week.
-
Access to everything (now and as it becomes available)o Reports
o Videos and video series -
Multi-part webinar course. You learn the 8 most common charting principles.
-
Webinars. Actionable and timely advice on breaking out chart patterns.
For your convenience your membership auto renews each year.
Get Access Now [1]