
U.S. DOLLAR INDEX ETF (UUP)
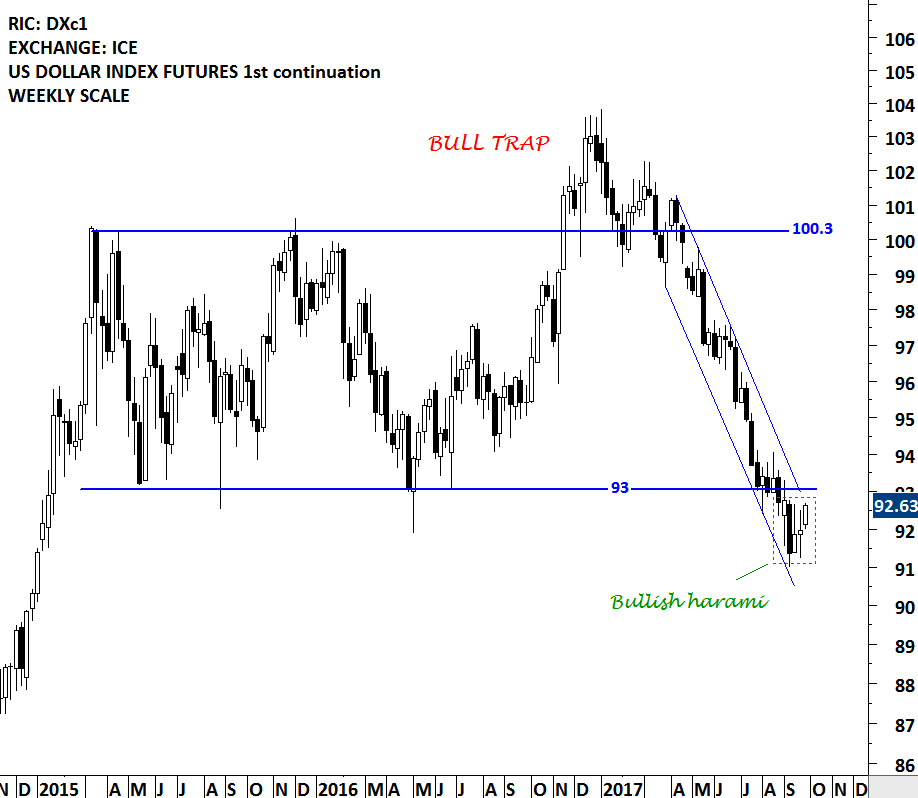
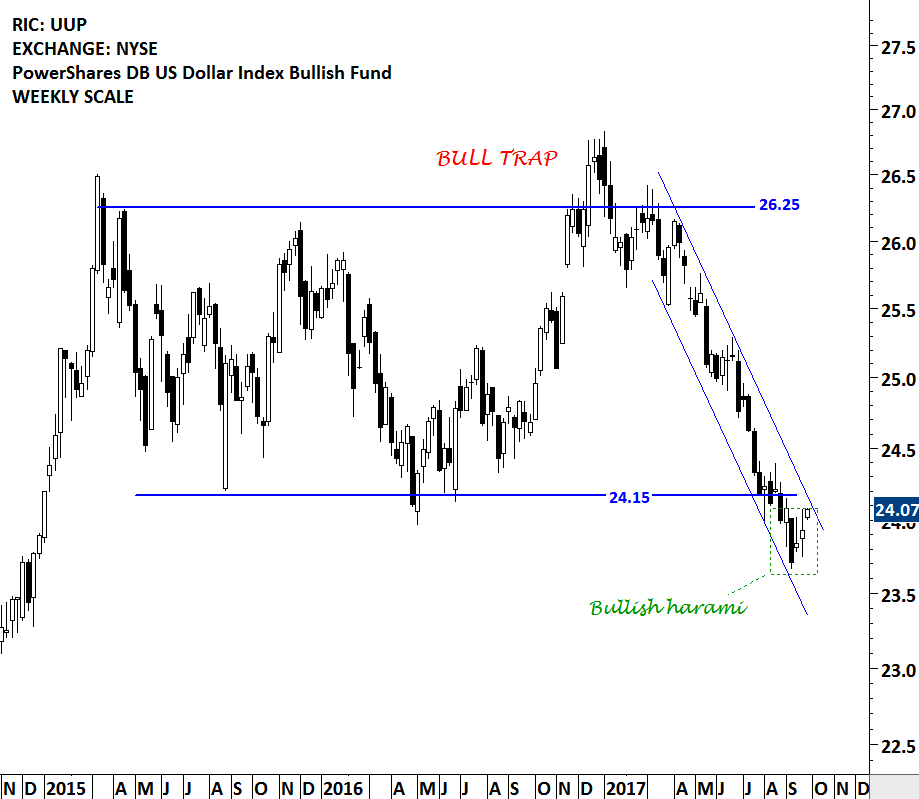
While still at the early stages, an important chart development might be taking place on the U.S. Dollar Index. In the second half of 2016, the U.S. dollar index breached the upper boundary of its consolidation range at 100.3 levels. The breakout was a bull trap (false breakout) and after couple of weeks, the price reversed back into the trading range and traveled sharply towards the lower boundary of the rectangle. In the beginning of September 2017, the price breached the chart pattern boundary on the downside. Those who are looking for a possible reversal of the downtrend on the U.S. dollar, should keep an eye on the 93 levels on the U.S. Dollar Index Futures chart and 24.15 levels on the US Dollar ETF (UUP) chart. A reversal above the mentioned levels can result in a bear trap (false breakdown) and turn out to be positive for the U.S. dollar in the coming months.
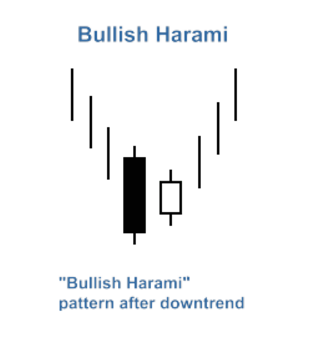 A bullish harami is a candlestick pattern in which a large candlestick is followed by a smaller candlestick whose body is located within the vertical range of the larger body. A bullish harami forms with a bearish candlestick (black) engulfing a small bullish candlestick (white) and is a sign of a reversal of the downtrend. If an outline is drawn around the pattern, it resembles a pregnant woman, which is why the pattern is named after the word “harami,” an old Japanese word meaning “pregnant.” In other words, expecting a change. Traders using the bullish harami should look for a confirmation of a reversal. For me, that confirmation will be the reversal into the chart pattern boundary.
Tech Charts Membership

By becoming a Premium Member, you’ll be able to improve your knowledge of the principles of classical charting.
With this knowledge, you can merge them with your investing system. In fact, some investors use my analyses to modify their existing style to invest more efficiently and successfully.

As a Premium Member of Aksel Kibar’s Tech Charts,
You will receive:
-
Global Equities Report. Delivered weekly.
-
Classical charting principles. Learn patterns and setups.
-
Actionable information. Worldwide indices and stocks of interest.
-
Risk management advice. The important trading points of each chart.
-
Information on breakout opportunities. Identify the ones you want to take action on.
-
Video tutorials. How patterns form and why they succeed or fail.
-
Watch list alerts. As they become available so you can act quickly.
-
Breakout alerts. Usually once a week.
-
Access to everything (now and as it becomes available)o Reports
o Videos and video series -
Multi-part webinar course. You learn the 8 most common charting principles.
-
Webinars. Actionable and timely advice on breaking out chart patterns.
For your convenience your membership auto renews each year.


